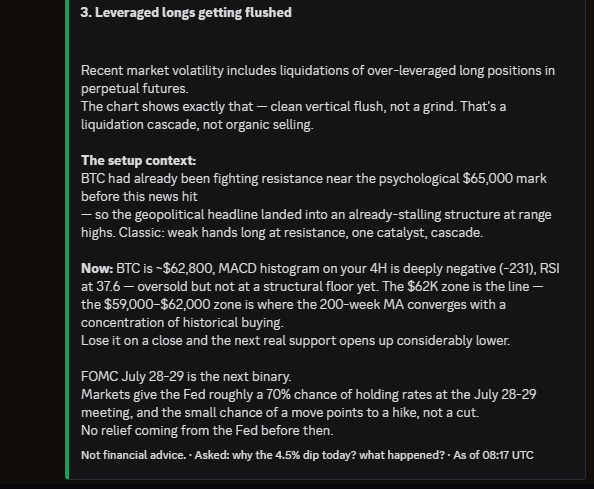
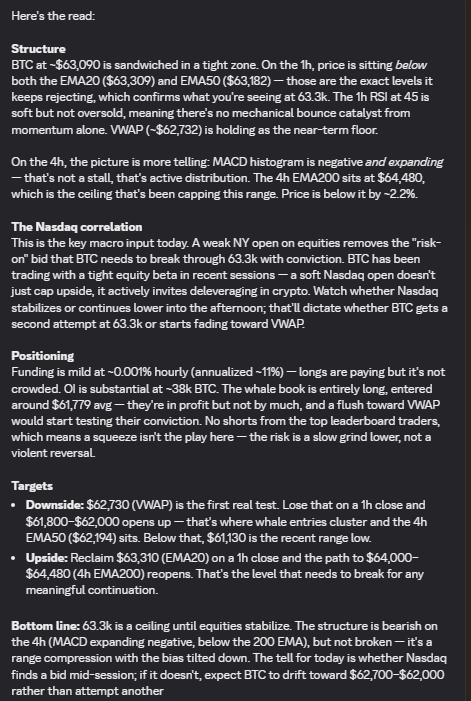
The weak open volume is the tell I flagged. If Monday’s first few hours show real bid absorption through $64.8-65k, the breakout thesis is alive. If it gaps up and immediately fades back under $64.5k, then compression wins another week.
We’re sitting in a selective range right now.
- pre fomc compression (July 29th), Fomc weeks tend to compress volume further into the mid-week then either resolve or solve into decision.
@Pipinvestbot does hold its own thesis on $BTC of not going above $65k
However we do have 2 plays from here,
The condition being for longing that we’re able to have a daily close above 6H 200ema. Anything below that, we might wick into $65k and not hold that area, making it a clean short.
Watch out of this compression lads.
$NVDA Fell a solid %s yesterday due to Kimi. Very similar playbook to Deepseek.
DeepSeek dropped $NVDA roughly 17% in a single session (Jan 27, 2025), then over the following ~14 weeks, it ran from ~$86 to ~$135
Yesterday, Kimi did give a shock; however, $NVDA did regain its stance when traders realized that the frontier model only performs better on hardware that is super expensive. Thus, making the model cheap but affording the whole stack expensive.
$NVDA could be worth a long soon. The setup rhymes closely. The difference worth watching: NVDA is now at $202 with a 52-week high of $236, so it's already in a more compressed range vs. where it was post-DeepSeek (near multi-year lows at the time)
Attached a little analysis from pip as well,
TLDR : $204-205 reclaim on daily close = EMA stack restored, bull structure back on. Holds above $195 (200 EMA) = higher low intact, recovery thesis alive. Aug 25 earnings is the real catalyst for 52w high retest. Loses $195 = structure breaks, DeepSeek analog invalidated.
Having access to micro,macro analysis with just a single prompt is handy
Helps me find confidence in my own thesis.
@Pipinvestbot is great if you ever need a helping hand while looking at the markets rationally
Memes,indices,commodites,crypto ~ works with everything
Just shared my own chart analysis with @Pipinvestbot and it didn't just agree/disagree.
It broke down the key levels, explained the most likely scenario, pointed out what invalidates it, and even added extra context I hadn't considered.
Pretty cool bot for anyone who likes doing TA.
Thanks @BrokenLull for the access 🤝
Introduced a newer but rather simpler feature on @Pipinvestbot
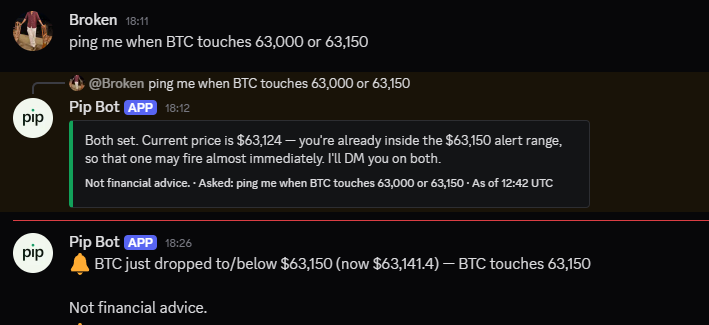
Pip pings you whenever the price reaches or goes above/below a certain level. I don't use Limit orders and rather like to manually view price and open trades based on the market and set limits from there on.
Thus, this feature, soon I'll push similar aspects for macro/fed and economic calendars.
Dm me if youd like access to Pip as well :)
@Pipinvestbot is perhaps one of the best risk-mitigation tools i know of. @BrokenLull has done an incredible job with creating an absolute beast that can save you truckloads with a wrong trade. Informed decisions are the best trading tools!
These are the things you get to interpret with @Pipinvestbot
Crypto is no longer just charts and technicals. It’s a lot about understanding data and breaking down the littlest of concepts.
Use pip🫡
Even tho the CPI was bullish. The macro market feels differently.
Bonds being sold, 205K jobless claims print + rising control group retail sales.
bitcoin:native down 1.8% breaking $65,300 became much harder.
2 months since I posted this...
Markets have closely followed that, wouldn't call it perfect, but it's a good enough direction
I continue to hold the thesis while trading LTF on longs and shorts
Dont know
BTC just pushed past $80K for the first time since January, hitting ~$82,000. But the move was driven by $303M in short liquidations and geopolitical relief (Hormuz situation). ETF inflows were strong ($630M Friday).
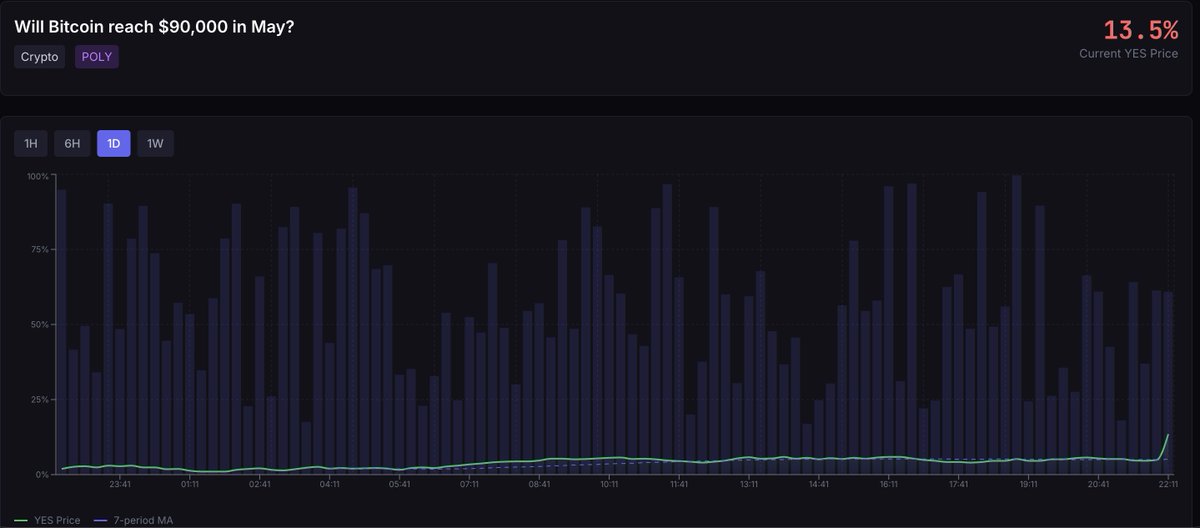
Polymarket gives only 13.5% odds of clearing $90K this month.
(I built a polymarket and Kalshi tracker myself to help me trade with odds and sentiment) (let me know y'all want proper access to it)
The part this plays is, BTC is contesting the 200ema on the 3D, which is @ 84,600
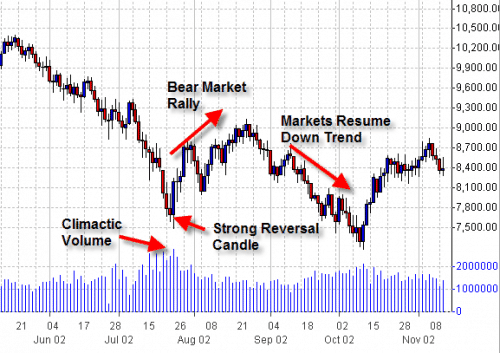
The idea of 90k would put a perspective that this starts rallying towards higher prices after breaking the 200EMA; however, the sentiment doesn't speak towards that. If we trace it back to 2002, the Nasdaq bear rally
In 2002, the Nasdaq followed a repeating cycle: sharp sell-off → climactic volume at the bottom → strong reversal candle → rally that looks convincing (20-35% bounce) → rejection at moving average resistance → lower highs form → downtrend resumes. Each rally trapped buyers who thought the bottom was in
This is what stands with BTC right now,
It shows the same sequence playing out. Price fell from ~$110K-120K highs down to the ~$60K area with climactic volume (that huge volume spike around Jan-Feb 2026). Then a strong reversal candle kicked off a bear market rally up to roughly $90,000. That rally potentially can fail at the 200 EMA ($84,417) and start to chop a bit there before crumbling down (or even lower, 82k, 200ema on 1D)
Don't know