Cohort 2 kicks off in 2 days.
Enroll to reserve your spot before tomorrow's deadline.
We guarantee
- job readiness by the end of the bootcamp.
- current in-demand skills to give you an edge.
@SamuelOtigba Please, I raised broiler chickens for Christmas hoping to get a small return on my little capital. I’ve sold 45 already, but I still have 55 left. What I really want this Christmas is to sell the rest. Prices are between ₦13k–₦15k. Location is Ipaja-Ayobo.
Day 1 of Data Analytics Bootcamp. Bookmark this tweet for subsequent days.
I’m giving this class out for FREE.
We covered the scope and concept of Data Analytics.
Tools and Processes.
Link to watch: https://t.co/LhPscQzNpI
Kindly like and retweet.
This interviewer go don tire for me for this call
You bring MySQL i bring sql server
You talk Alteryx, I talk Power Query
You talk Databricks, I give am fabric
😂😂😂
Moral of the lesson: Interviewer go wan whyne but no panic- talk about your strengths
I started learning data analysis following this method
-Python(dropped out)
-SQL
-Excel
-PowerBI
-Python (in view)
If i were to start over again, i will follow this method.
-Excel
-Power BI
-SQL
-Python
What about you?😊
Ready to be a master of data analytics? Join our exclusive masterclass and unlock the secrets to data-driven success.
Use the link below to apply:
https://t.co/djpfKKWQDp
As a data analyst, if you’re coming into an industry like mine (research based), just forget or care less about anything like dashboard because there are graphic designers that will design those dashboards for you.
Just focus on your analysis and master it. In fact, master excel
Hello X, i am looking to #connect with people interested in:
💹Data science
📊Data analysis
📈Business intelligence
💻Data engineering
🤖AI/ ML
🗣️Data advocacy
👩💻Volunteering
🏗️Building in public
Guidelines for documenting a data analysis project
1. Project Overview
- Title: A clear, concise title.
-Introduction/Summary: A brief summary of the project, including its purpose and main findings.
2. Dataset Description
- Source: Where the data came from.
- Content: What the data includes (number of rows, columns, types of data).
- Key Features: Important columns and what they represent.
3. Data Preprocessing
- Initial Exploration: Basic statistics and initial observations.
- Cleaning: How you handled missing values, outliers, and any changes made to the data.
- New Features: Any new columns you created and why.
4. Exploratory Data Analysis (EDA)
- Visualizations: Key charts and graphs.
- Insights: Main findings from the data exploration.
5. Conclusion/Recommendation
- Findings: Recap the main results and their implications.
- Limitations: Any limitations of the analysis.
This thread contains links to download to your PC or Mac the software you need as a Data Analyst.
Microsoft Excel, SQL, Power BI, Tableau, Anaconda.
Kindly like and retweet
If you’re looking to get into Data Analytics, watch and share this. Shared on Instagram last week and I’ve had a lot of folks tell me how it’s helped them gained clarity.
We hope you are as excited as we are to begin the 2nd half of the year.
We wish you the best things the remainder of the year has to offer. Including happiness and love.
Happy new month from all of us at @Build2Hire#newmonth#july#july2024#welcometojuly#build2hire
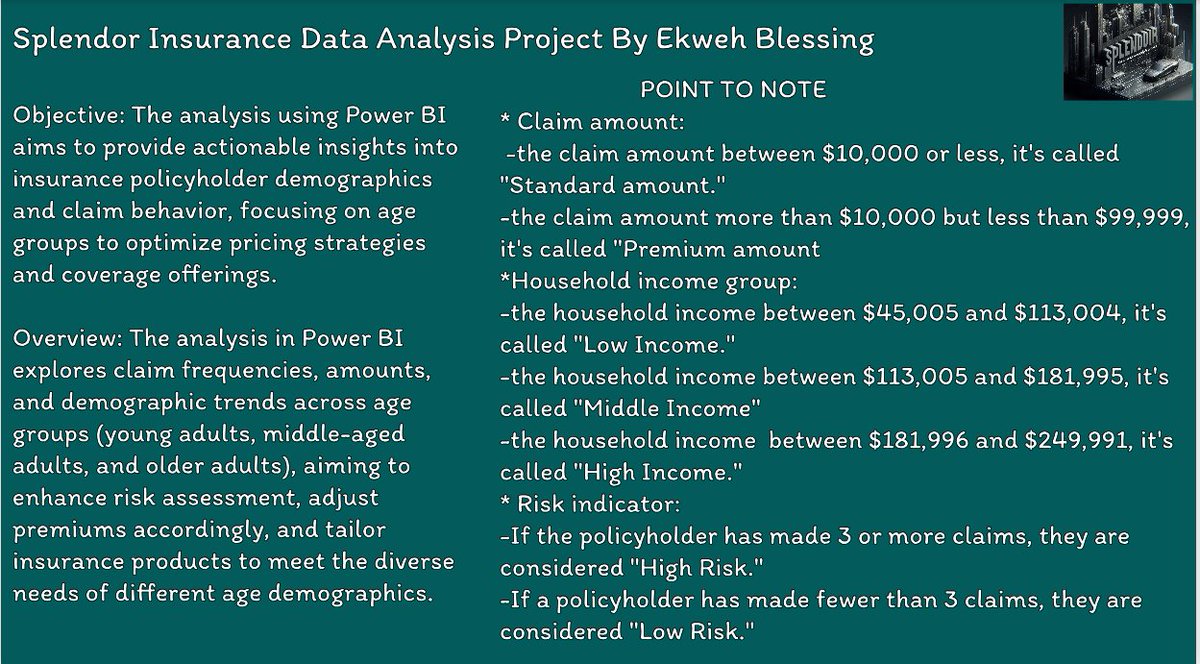
This is my submission of Splendor Analytics Insurance Data Analysis Project,
Because of the volume of the dataset Table visual was mainly used for visualising key characteristics,
please leave your reviews I will be anticipating
@iam_Uchenna@Femi_OfMainland