🚀 IN-DEPTH HUT8 MINER ANALYSIS – A MASSIVE SETUP? 🚀
🔹 ONE OF THE BEST SETUPS FOR HUT8 IN YEARS!
📊 Key Bullish Signals:
✅ Weekly RSI is breaking out of the Bollinger Bands – last time this happened, we saw an amazing uptrend!
✅ Weekly Rank Correlation Index at a low
✅ 2D RSI is on the verge of breaking out – momentum is building!
✅The Stochastic RSI is about to cross on the weekly chart
#HUT8 #CryptoMining #Bitcoin #BTC #Stocks #RSI #Trading #CryptoAnalysis
#BreakingNews #Bullish #MarketUpdate #Finance #Money
#Retweet #Fintwit #ChartOfTheDay #DYOR
@Hut8Corp
hi guys, i tried to make my first video. thanx to @ElevenLabs :)
ethereum:0x4a220e6096b25eadb88358cb44068a3248254675
i explain why the breakout will come for quant in the following weeks.
feedback is always welcome 🙏
$qnt (quant) men lie, woman lie but charts don’t lie 📊
The next days/weeks this chart will breakout 🚀
Interoperability ✔️
Staking is coming ✔️
Quant/ethereum chart ✔️
Quant/bitcoin chart ✔️
Ejoy the ride 🎢
It is happening before our eyes…
$Qnt (Quant) is ready for takeoff
Perfect elliot nine wave triangle breakout.
My target is around $600.
It always happens when nobody is expecting it. When this breakout, it will go fast and hard.
It is happening before our eyes…
$Qnt (Quant) is ready for takeoff
Perfect elliot nine wave triangle breakout.
My target is around $600.
It always happens when nobody is expecting it. When this breakout, it will go fast and hard.
🚀 IN-DEPTH HUT8 MINER ANALYSIS – A MASSIVE SETUP? 🚀
🔹 ONE OF THE BEST SETUPS FOR HUT8 IN YEARS!
📊 Key Bullish Signals:
✅ Weekly RSI is breaking out of the Bollinger Bands – last time this happened, we saw an amazing uptrend!
✅ Weekly Rank Correlation Index at a low
✅ 2D RSI is on the verge of breaking out – momentum is building!
✅The Stochastic RSI is about to cross on the weekly chart
#HUT8 #CryptoMining #Bitcoin #BTC #Stocks #RSI #Trading #CryptoAnalysis
#BreakingNews #Bullish #MarketUpdate #Finance #Money
#Retweet #Fintwit #ChartOfTheDay #DYOR
@Hut8Corp
🚀 3D RSI BREAKING OUT! 🚀
📈 The 3-Day RSI is breaking out after a perfect retouch of support.
⚡ Momentum is building — this setup has led to major moves in the past!
🔍 Are we on the edge of another breakout rally?
💬 What’s your take? Bullish or fakeout? 👇
🔁 Retweet if you're watching this move!
#Bitcoin #Crypto #RSI #Trading #TechnicalAnalysis #CryptoSignals #Breakout
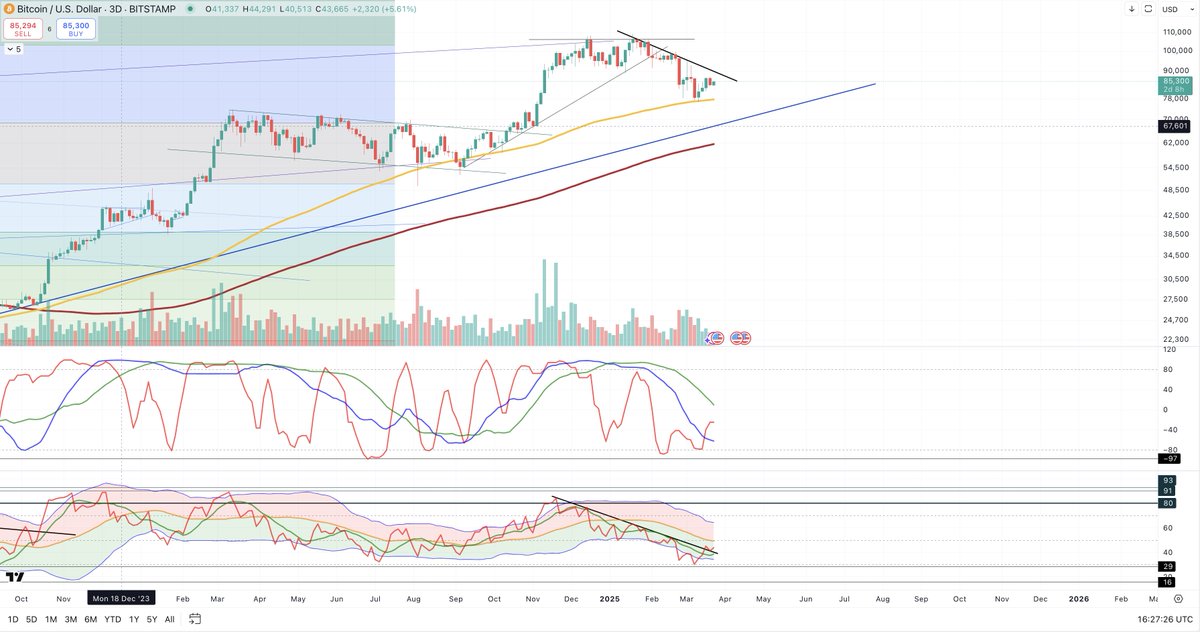
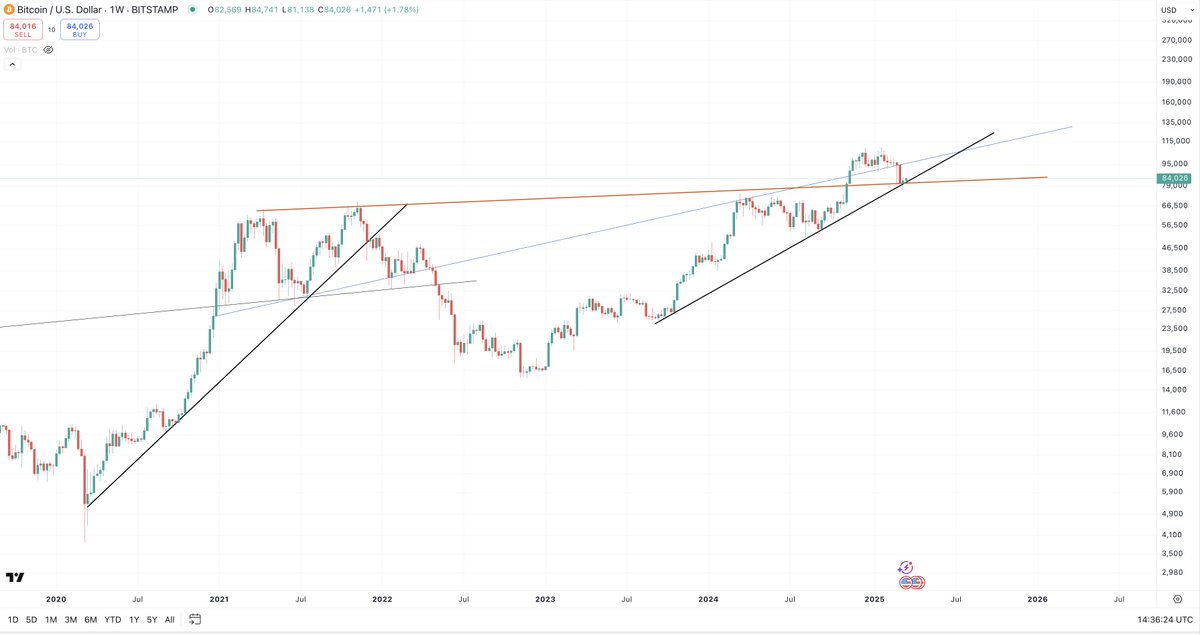
🚀 The Three Most Crucial Trendlines for Bitcoin – A Deep Analysis 🚀
In this analysis, we take a closer look at three critical trendlines that have historically shaped Bitcoin's price action. These lines represent key structural levels, and their behavior in the coming weeks will determine the market’s trajectory.
🟠 The Orange Line: The Macro Trendline Since 2021
* This trendline originates from 2021 and is even more prominent on the monthly chart.
* At the end of 2024, Bitcoin broke above this massive resistance, and we are now witnessing a retest.
*Why It Matters: This is a structural support level—if Bitcoin holds above it, the uptrend remains intact.
*Risk Factor: A breakdown below this line would imply a prolonged consolidation phase before any potential reclaim.
🔵 The Blue Line: The 2022 Downtrend Reclaimed in 2024
*This trendline acted as a strong resistance throughout 2022, driving a multi-year downtrend.
*It wasn’t until 2024 that Bitcoin successfully reclaimed this level, signaling a macro shift.
At the end of 2024, Bitcoin broke above this line, but in recent weeks, it has fallen back below it.
*Two Possible Scenarios:Reclaim & Confirm: If Bitcoin climbs back above this trendline, we could see another strong uptrend.
*Rejection & Prolonged Consolidation: If price only touches and rejects, it may take a significant amount of time before Bitcoin reclaims this level again.
⚫ The Black Line: The Bull Cycle Uptrend Line
*Every bull cycle is characterized by a primary uptrend line, and this is it.
*Right now, Bitcoin has retested this line, a pivotal moment for price structure.
*Key Factor: Holding above this line confirms a sustained uptrend.
*Downside Risk: If this line is lost, reclaiming it will be extremely difficult in the short term, potentially delaying the next leg up significantly.
🔎 Conclusion
At this moment, the Orange Line (macro trendline from 2021) and the Black Line (bull cycle uptrend) are perfectly converging. This creates a crucial inflection point—Bitcoin must hold these lines to maintain its bullish structure.
🔎 Final Thoughts
These three trendlines are the foundation of Bitcoin’s market structure right now.
We will be monitoring them closely, as they will dictate whether the next move is a continuation of the uptrend or a reset before another leg higher.
📉 Hold above these lines → Bullish Continuation
🔻 Lose these lines → Extended Consolidation
#Bitcoin #Crypto #BTC #TechnicalAnalysis #Trading #CryptoSignals #Finance
#Retweet #DYOR #Fintwit #BreakingNews #MarketUpdate
🚀 BITCOIN’S 100% ACCURACY CHART! 🚀
📊 This chart has predicted Bitcoin’s moves with 100% accuracy!
✅ Each time we saw a green dot appear, the local ✅ TOP ✅ was in.
🔴 Each time we saw a red dot appear, the local 🔻 BOTTOM 🔻 was in.
#Bitcoin#BTC#Crypto#CryptoTrading #CryptoNews
#BuyTheDip #BullRun #CryptoMarket
#Retweet #DYOR #Fintwit #BreakingNews #MarketUpdate