📍 #BTC $btc #bitcoin
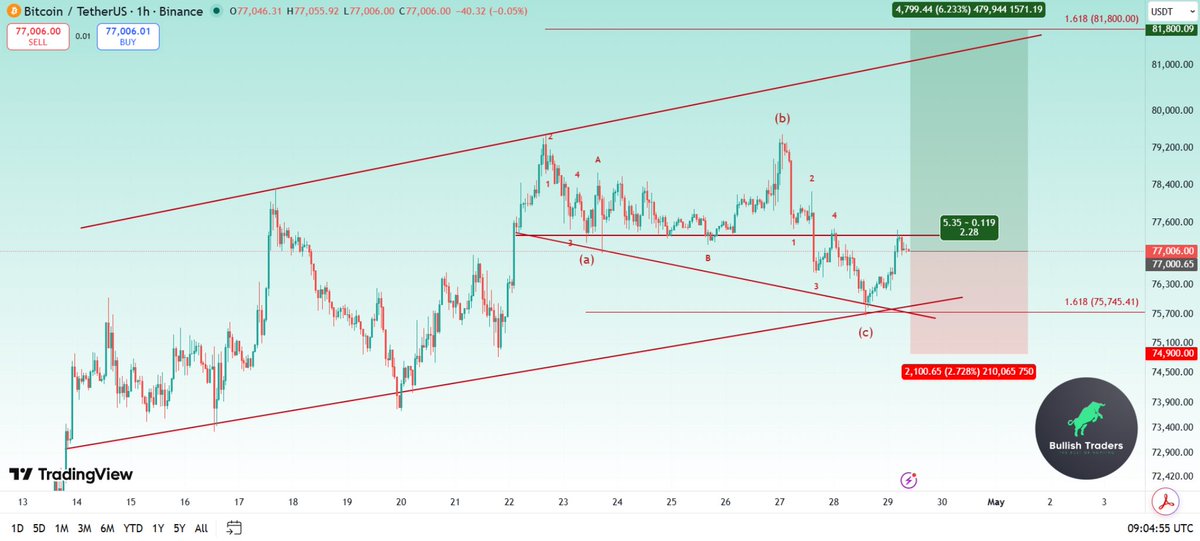
👉 An ABC corrective pattern has formed on the chart, and a leg up to $81,800 is possible before a new downtrend. Therefore,it may not be a bad idea to open a long position here with a tight stop loss
📍 #BTC#bitcoin $btc
📉 a clear bear flag with an ABCDE structure has formed on the chart. From an Elliott Wave perspective, wave 5 of the main impulsive structure could begin at any moment, with 48K as the primary target
📍 #BTC#bitcoin $btc
📉 a clear bear flag with an ABCDE structure has formed on the chart. From an Elliott Wave perspective, wave 5 of the main impulsive structure could begin at any moment, with 48K as the primary target
📍 #BTC $btc Update
👉 The decline could start from the current 72k area, or #Bitcoin might touch 78k briefly before starting the new downward move. Either way, my view on Bitcoin is bearish, with a target of $50,000
🟡 $GOLD #GOLD
📈 The $gold chart is currently forming a bullish flag pattern on the 4H timeframe. It has shown a strong rebound reaction around the 1.618% Fibo level, and I expect a short-term upward move toward the 5578$ level
📍 #DXY $dxy #btc
📈 The dollar chart is strongly bullish, and this cannot be considered a good sign for financial markets, especially for crypto and #Bitcoin
👉 The main mid-term targets for the dollar is around 103$ and 107.4$ areas
📍 $BTC Update
👉 Even though #BITCOIN selling pressure was stronger than I expected and the price wicked deeply into the 80k zone, in my view nothing has changed in the overall trend.
📥 I still consider the recent decline as a correction rather than a new trend, and the drop into the 80k area was wave 5 and the final leg down.
🔰 Although #BTC recent range has been tiring and exhausting, sellers are being disciplined in this zone.
📈 My outlook on #Bitcoin remains unchanged, and I still see 150k as the main target.
📍 #BTC $btc #bitcoin Update
👉 On the lower timeframe, wave C has clearly unfolded into a five-wave structure, and the large wick that formed today around the 89,300$ zone signals a potential end to the correction
📈 From my perspective, a strong new bullish trend is imminent.
📍 #Bitcoin
📊 In days when everyone is talking about a 60,000k $btc, the chart is showing something completely different.
👉 From a classical perspective, the price has touched a very critical trendline and is currently moving right above it.
📥 From an Elliott viewpoint, #btc is in wave 4 of 5. This wave 4 has turned into a complex correction, and the price has now hit the critical 1.618% level, from which we’ve seen a solid rebound.
🔰 As long as the price remains above 94k, #BITCOIN trend is bullish and there’s absolutely no reason to worry.
📈 I expect a strong bullish move from the current area toward 140k as a typical target and 167k. I definitely don’t want to miss this golden buying opportunity
📍 $XLM
🚀 One of the most bullish charts at the moment belongs to #XLM, showing a strong bullish pattern.
👉 The price has reacted beautifully to the trendline and now seems to be preparing for another attempt to break through the 0.35$ resistance. This time, I expect a strong breakout toward 0.376$ , followed by a trendline breakout that could open the way to 0.376$, 0.415$, 0.468 and 0.578$ targets
📍 #ETH $eth
📥 price of #Ethereum has tested the bottom of the bullish flag several times and has managed to hold its position well.
👉 Currently, in the lower timeframes, it is breaking the descending trendline.
📈 I expect a bullish move to start from this area toward 4600$, followed by a breakout of the bullish flag and a continuation of the move toward 5370$ as a new ATH.
🔰 Overall, the structure of Ethereum looks strongly bullish to me, and I anticipate a powerful upward trend in the near future.The price remains in a strong demand area and still looks attractive for buying
📍 #BTC#bitcoin $btc
📥 Nothing has changed from my previous update — Bitcoin moved exactly as I expected
👉 The price touched the trend line and support area, bounced, and is now trading above the crucial 107k resistance level
📈 I expect a bullish continuation from here toward 123K as the top of the channel, followed by 136,330$ as the main target
📍 #BTC#bitcoin $btc (Higher Timeframe)
📉 Last night, the market witnessed one of the sharpest and most terrifying crashes in crypto history — and as most of you probably know, the fundamental reason behind it was the U.S. imposing a 100% tariff on Chinese products.
👉 In this analysis, we’ll take a comprehensive look at Bitcoin on the higher timeframes, so let’s get started.
📥 As shown in the chart, we’re facing a highly reliable trendline that has been forming since November 2022. Every time the price has touched this line, we’ve seen a strong bullish reversal.
📊 Last night, the price once again reacted to this trendline with a large wick and showed a solid rebound.
👉 In addition to that, there’s also a strong static resistance around the $107,000 level, and currently, the price is consolidating above this zone.
📥 Overall, from a technical perspective, no major structural change has occurred in Bitcoin’s chart, and if the price manages to break above the $123,000 level, it could potentially form a new high around $136,330.
📍 $ETH
📈 The main structure of #Ethereum is a corrective ABCDE pattern, where wave E has beautifully bounced from the 1.272 Fibonacci level. Today, the price has broken through and consolidated above the key $3,800 zone.
👉 I expect an upward trend for #Eth toward a new all-time high (ATH).
📥 Buy Area : 4,000$
🎯 Targets : 4600$, 5370$, 5900$
📍 $xlm
📥 One of the coins that held up well during the recent drop is #XLM.
From a technical perspective, we’re seeing a bullish flag pattern with an ABCDE structure, where wave D has beautifully bounced off the trendline and the 1.618 Fibonacci level.
👉 A breakout above the 0.35$ zone will signal the start of a strong upward trend.
📊 Buying in the current area looks very attractive and offers a solid risk-to-reward ratio.
📥 Buy Area : 0.34$
🎯 Targets : 0.388$, 0.472$, 0.573$
📍 #BTC#bitcoin $btc (Higher Timeframe)
📉 Last night, the market witnessed one of the sharpest and most terrifying crashes in crypto history — and as most of you probably know, the fundamental reason behind it was the U.S. imposing a 100% tariff on Chinese products.
👉 In this analysis, we’ll take a comprehensive look at Bitcoin on the higher timeframes, so let’s get started.
📥 As shown in the chart, we’re facing a highly reliable trendline that has been forming since November 2022. Every time the price has touched this line, we’ve seen a strong bullish reversal.
📊 Last night, the price once again reacted to this trendline with a large wick and showed a solid rebound.
👉 In addition to that, there’s also a strong static resistance around the $107,000 level, and currently, the price is consolidating above this zone.
📥 Overall, from a technical perspective, no major structural change has occurred in Bitcoin’s chart, and if the price manages to break above the $123,000 level, it could potentially form a new high around $136,330.
📍 #BTC $btc #bitcoin
👉 Nothing has changed about my previous idea on Bitcoin. the price has perfectly broken out from the trend line and is now trying to hold above it. The next targets I’m watching are $127,500 and $133,000
#btc $btc #bitcoin
📈 BTC is printing an ABCDE structure — wave E looks done around 108.5k. A breakout above 108k could trigger a fresh bullish leg targeting 127.5k and 133k 🚀
📍 #ETH $eth update
🔥 Nice! The #Ethereum price has successfully broken out of the flag and nearly reached $4,700 as my first target. It’s time to sell 30% of your position here for about a 10% profit, while holding the remaining portion for the next target at $5,250
📍 #ETH $ETH #Ethereum
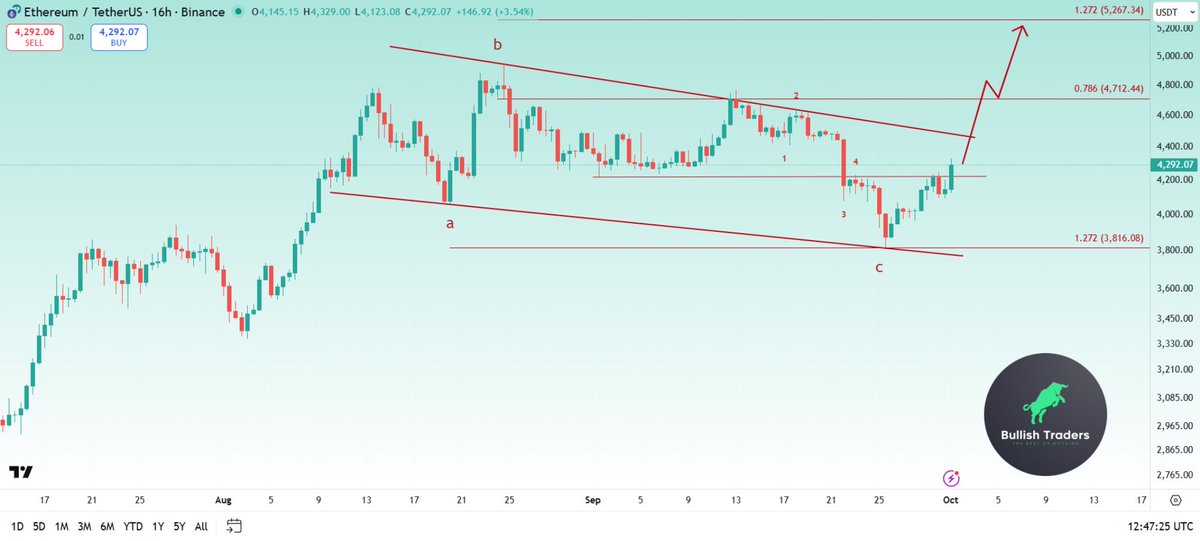
👉 Overall, Ethereum has completed an ABC correction, with wave C beautifully bouncing off the 1.272 Fibonacci level. Today, we saw the price break through the key $4,200 level and stabilize above it.
📈 In my view, a new bullish trend has begun for Ethereum, and I expect the trendline to reach a new all-time high soon
🎯 Targets : 4700$ and 5250$
📍 #ETH $ETH #Ethereum
👉 Overall, Ethereum has completed an ABC correction, with wave C beautifully bouncing off the 1.272 Fibonacci level. Today, we saw the price break through the key $4,200 level and stabilize above it.
📈 In my view, a new bullish trend has begun for Ethereum, and I expect the trendline to reach a new all-time high soon
🎯 Targets : 4700$ and 5250$
📍 $eth.d #dominance $dominance
📈 $ETH Dominance has clearly completed a 4-wave cycle, and we are now at the beginning of wave 5, with the main target for this wave being 16.4%.
👉 An important point regarding this chart is that its bullish movement indicates capital flowing into Ethereum, which in turn leads to increased buying pressure across the overall altcoin market. Therefore, I personally expect a bullish rally in altcoins