Zero gamma? ...no... Lets make it clear...
After the GameStop gamma squeeze, a wider know of retail crowd started to learn about options market dynamics and how they interfere with the market.
Gamma was the main concept that became very popular and it was necessary doomed to being misunderstood, like that.
A lots of data providers came in, and started to sell their GEX charts that have been simply based on assumptions like "GEX = gamma * OI in
specific strike of Interest x 100" and multiplied by (-1) if we code put OI.
This is called as "naive assumption".
Why? - Bcs its basic assumption is that customers always buying puts and selling calls putting MMs into short put gamma and long call gamma.
This arises from that OI is nothing else but the number of open contracts. Not a directional data.
Now, if you think about it, it's always gonna draw a positive speed environment, bcs downside gammas are negative and upside gammas are positive.
Here vanna and charm flows are always supprotive, spot/vol beta is always negative, and the profile misses out key patterns in the positioning:
- put spreads become customer long put positions,
- flies and condors become short risk reversals etc.
But bcs customer long skew positioning is more usual/common than short skew, naive gex is seemed to be more/less accurate like slightly more than 51% of times.
The concept of "zero gamma" arises from this. In a naive GEX profile zero gamma is basically equvivalent to its own zero speed, bcs it is defined as "the point were dealer profile switches from long to short gamma", and bcs this is the put territory, short gamma is indentified with bearishness between the retails.
As much as I know there are only two providers who actually take the exchange datas and derive the positioning from it. Optiondepth first, followed by Spotgamma's Trace.
I do something like that as well, the methods are likely a bit different so are the datasets that can be purchased, and I'm also taking vol on different tenors to get vanna, zomma, using extended BS models to derive the greeks like color (gamma change in time), and so one can decode what is the positioning.
(no I'll never build a dataservice, these aren't my lifegoals even posting here, just a period in my life. If i do substack, I will share charts what you can see, but thats all... however I will show you how to derive the greeks mathematically, how to take IV, and maybe how to derive positioning from cboe dataset - how I do it, but thats a long code, and pretty expensive game)
And so in a positioning chart that you can find at SG or OD, you see that the landscape is way more complex that "above/below null gamma" (no to mention that there are multiple zero gammas in the delaer book).
But we can derive logically the vol profile assuming how structural flows will net behave in certain territories.
This is crucial to change your mind, and take your time to understand this new approach.
Find educational posts about positioning in my highlights menu: https://t.co/btXYi0L1EJ
More detailed explainations with figures plus underlying math, I will share on substack where i can format posts😉
Thinking like a Market Maker 🧠
In the ICT private mentorship, countless lessons were provided with the goal of making it easier for traders to begin to view the market like the big players do
Learning how the market makers trade make it possible for retail traders to succeed
Here's the transcript from the video:
"If the high during the Friday is not as high as the high in on Thursday, the day before, then the odds are overwhelmingly high that whatever low you made on Friday will be visited on Monday during the regular trading session. That's an example of situational analysis.
Another situational analysis that I have published is that if Wednesday is low with Wednesday's high lower than Monday's high, then you will see the lows of Wednesday being visited on Thursday with—I think when I did it, I had 24 out of 25, which is really quite a mind-boggling statistic. But it's just that's a situational analysis."
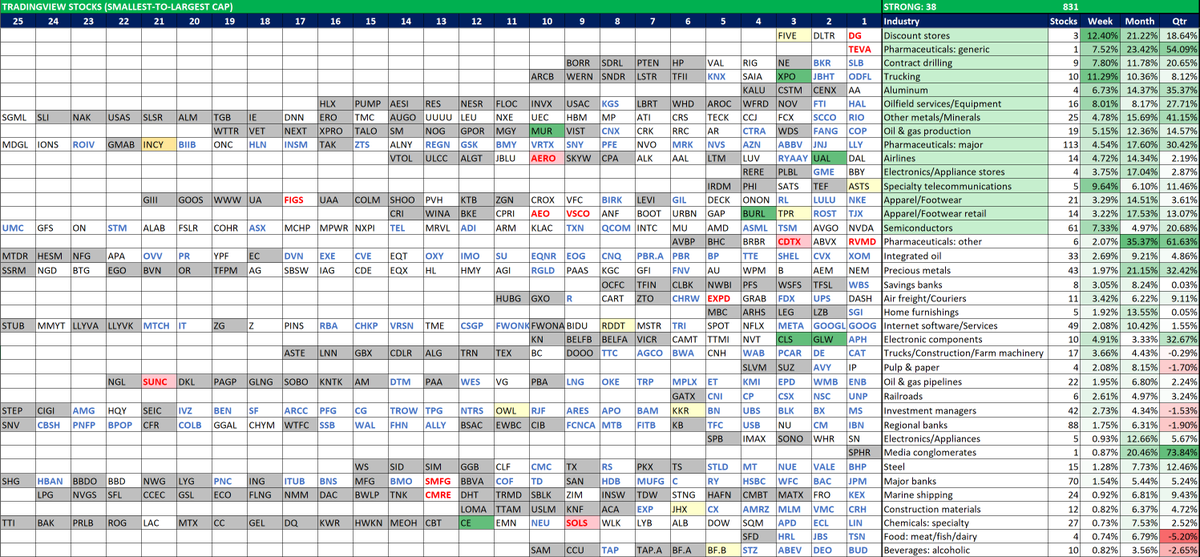
📈Leading Stocks In Leading Industries (TradingView)
“You want to own the leading stocks in the leading industry groups.” - William O'Neil
The chart shows largest stocks in the strongest industry groups, based on "Week x Month" Relative Strength (RS)
Watchlist:👀
Screen 1: $MUR $UAL $XPO $CLS $GLW $RMBS $BURL $CE
Screen 2: (None)
Screen 3: $FIVE $BF.B $SMTC $RDDT $KKR $TPR $ASTS $OWL $JHX
Screen 4: $INCY
Source: @tradingview
Below is a version using the ever excellent Finviz:
https://t.co/SV4AHV58oq