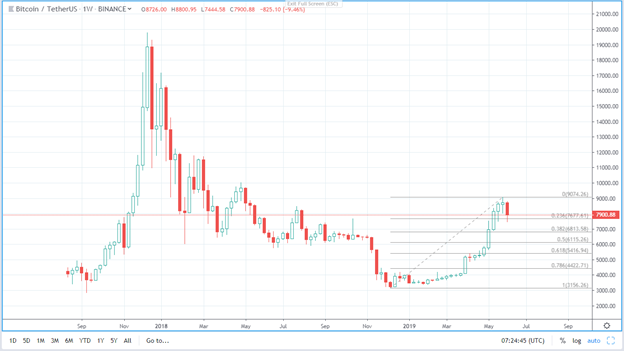
$BTC currently holding the 23.6% ($7,677) Fibonacci retracement level as support however the 38.2% ($6,813), 50% ($6,115), and 61.8% ($5,416) levels remain potential areas of interest.
$BTC bounced off the 100-period moving average (MA) last week only to find strong resistance at $8200. The MACD continues to form bullish histogram candles however both the Stoch RSI and RSI are losing momentum. Further pull-back could lead to a retest of the 100 MA as support.
$BTC / $USDT, 1W, BINANCE
5924.18 ↑ +77.84 (+1.33%)
$BTC advancing towards Ichimoku Cloud resistance and TD Sequential resistance levels with a bleeding green 9 on the weekly signaling a potential bearish setup.
Crypto Total Market Cap (TOTAL), Crypto Total Market Cap Excluding $BTC (TOTAL2), and Bitcoin (BTCUSD) starting the month below the 12 and 26-period moving averages.
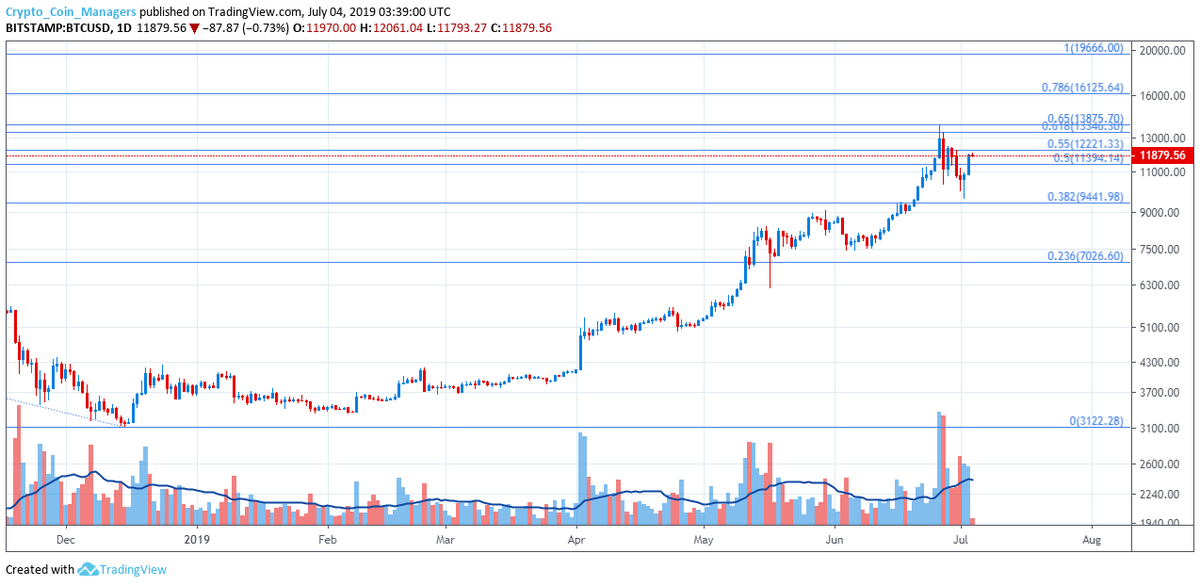
$BTC opening the week with a green TD9 on the sequential indicator over the middle Bollinger Band. Increasing price and declining volume may also suggest the recent rally may be losing momentum.