December 13th, as forecasted 3 months ago, the #DXY continued Its weak trajectory downward in this major pivot from its high, the decade long Elliot wave has come to an end, the target is 96, the bottom of its macro channel. #BTC is testing $18k bottoming at a generational low.
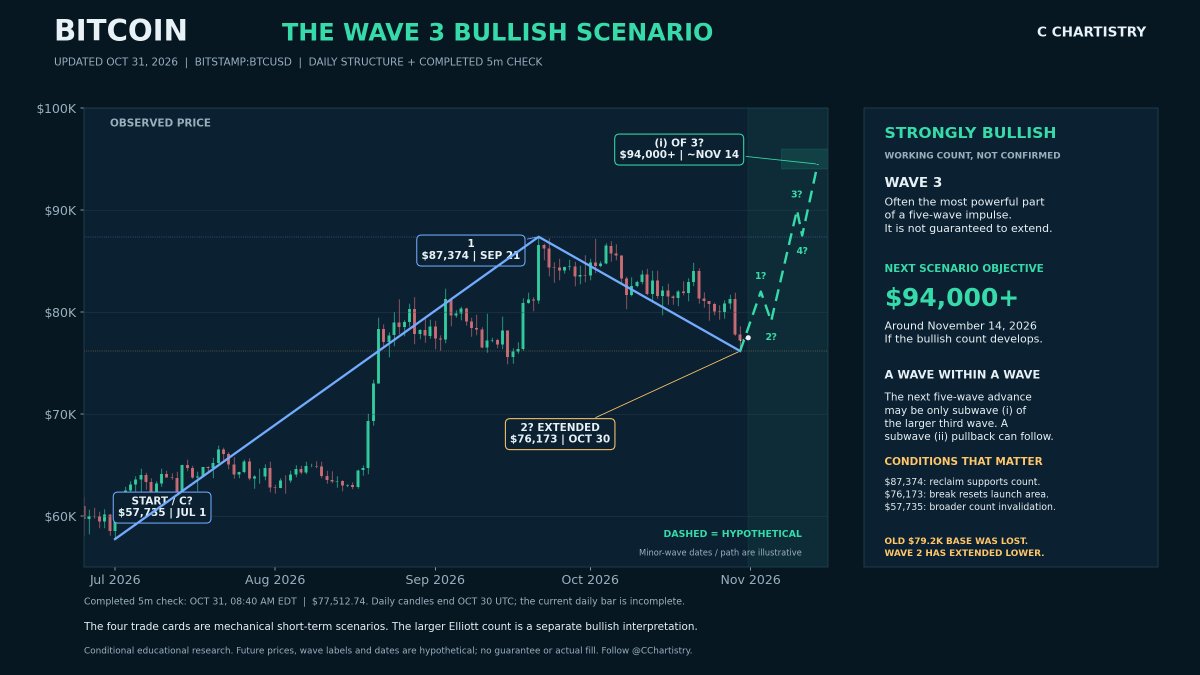
The updated Elliott Wave map: our larger working bias is strongly bullish, with $94,000+ as the next scenario objective around November 14, provided the count develops. Third waves are often the strongest part of an impulse; the next five-wave advance may be only subwave (i) of a larger wave 3, rather than completion of the entire third wave.
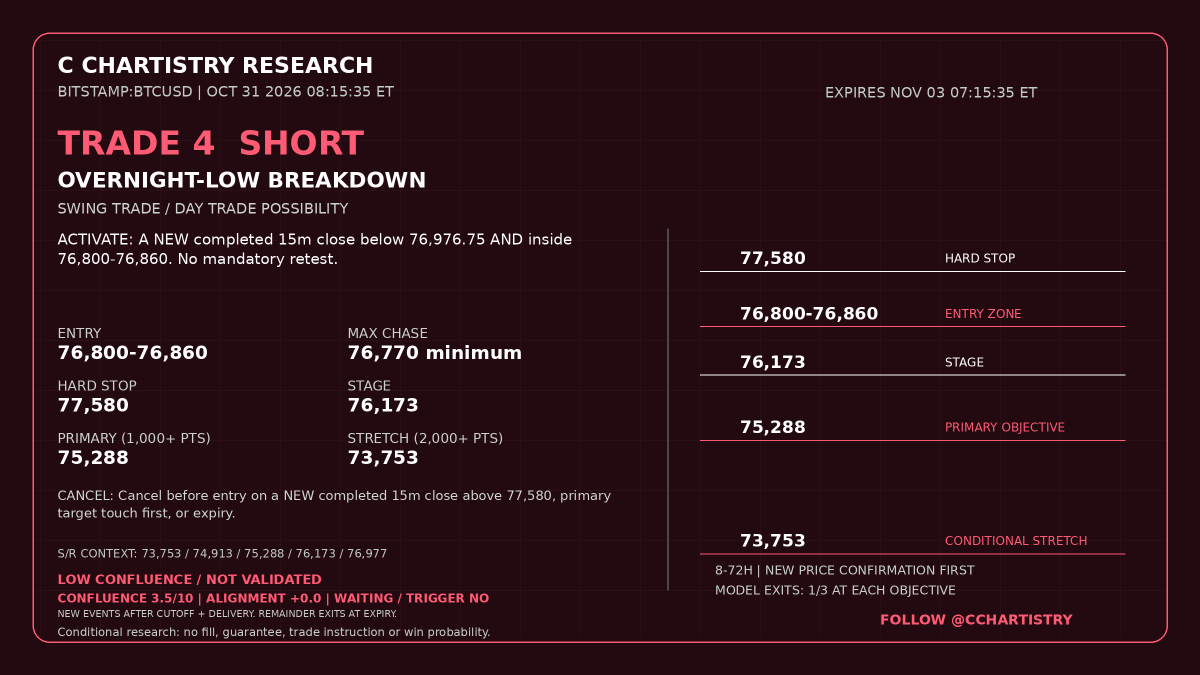
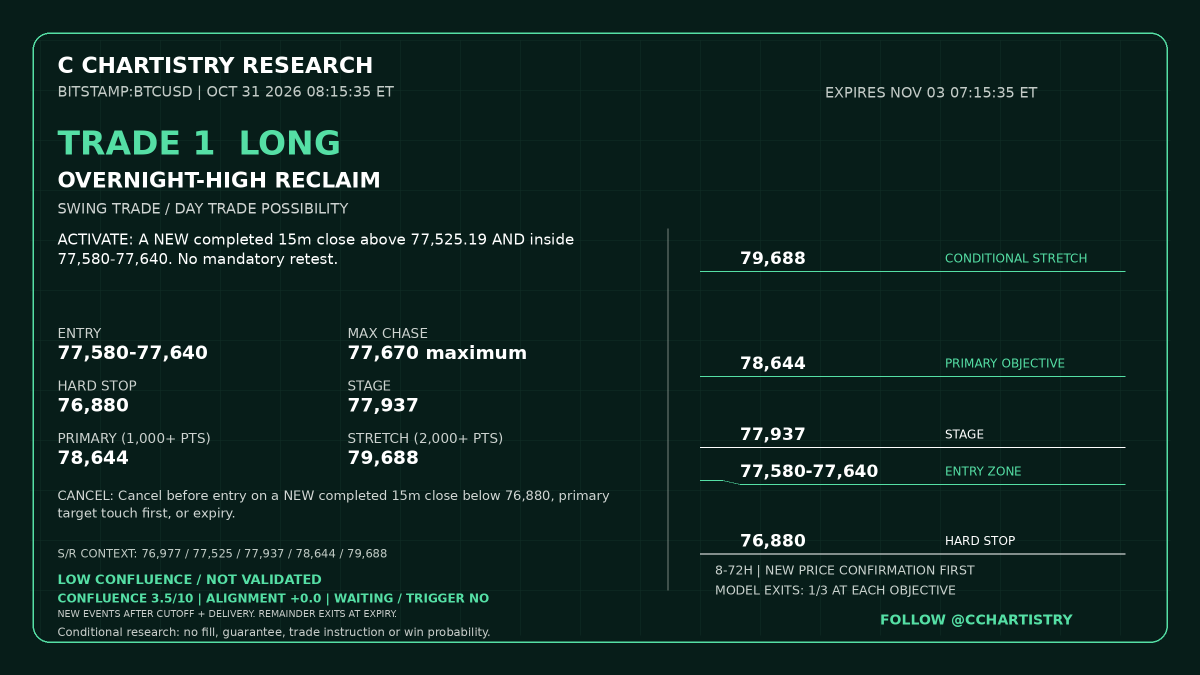
The earlier $79.2K wave-2 marker was lost, so this version shows the extended candidate base at October 30's $76,173 low. A reclaim of $87,374 would strengthen the count; a break of $76,173 resets the launch area, while $57,735 is the broader origin/invalidation. Dashed paths and minor-wave dates are hypothetical. The four cards above are mechanical short-term alternatives, separate from this multiweek bullish interpretation. Follow @CChartistry for more. #Bitcoin #BTC #ElliottWave
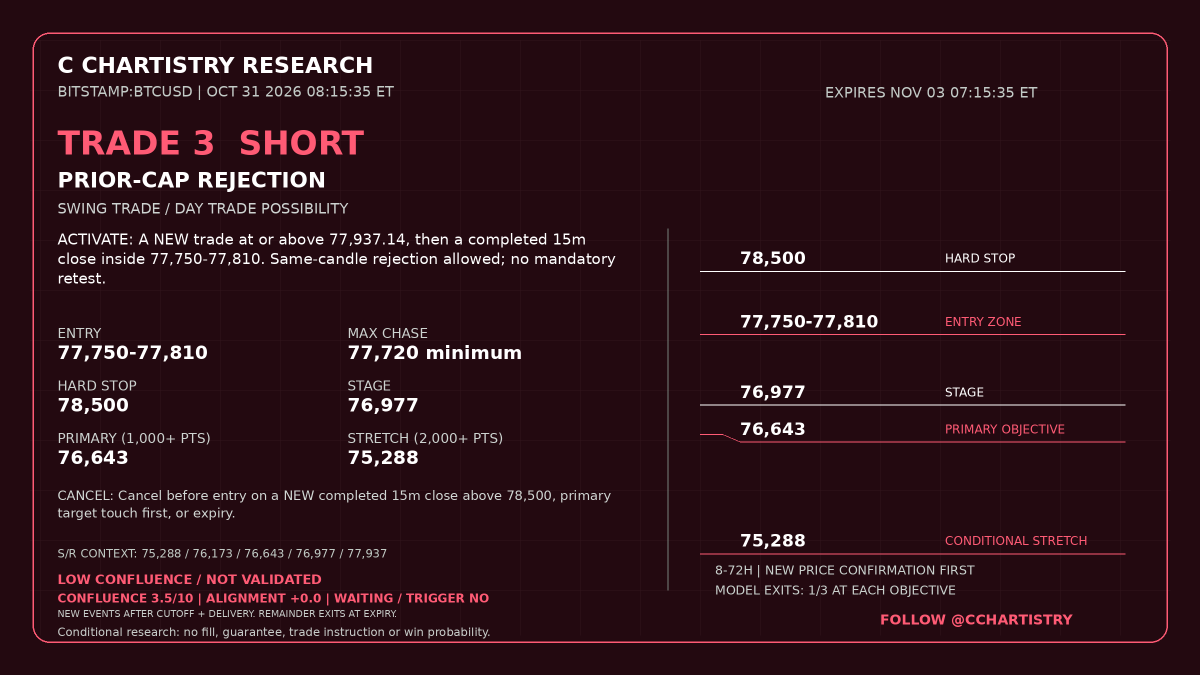
#Bitcoin: mechanical short-term plans, strongly bullish bigger picture. Research: October 31, 2026, 8:15 AM New York | BITSTAMP:BTCUSD; completed-price check through 8:45 AM. Wednesday's recovery gave way to Thursday's reversal, Friday reached $76,173, and Saturday has so far held a higher overnight low. Since our October 29 Elliott chart, the proposed wave-2 base extended below the old $79.2K marker; the count must acknowledge that. The four cards are conditional mechanical swing/day-trade scenarios, including bearish alternatives when their rules confirm. They are not a declaration that our larger bias has turned bearish. We remain very bullish on the working multiweek count: a developing third-wave advance has a $94,000+ scenario objective around November 14. Wave 3 is often the most powerful impulse wave; this next advance may be only subwave (i) within that larger third wave, with a subwave (ii) pullback before further extension. The updated chart is in the next post of this thread.
Next-24-hour timing watches, New York time: 15m trough Saturday October 31 at 7:45 PM EDT, then peak Sunday November 1 at 1:30 AM EDT (before clocks fall back); 1h peak Saturday at 10:00 PM EDT; 4h peak Sunday at 7:00 AM EST. These are reaction windows, not automatic entries or a reliable price-amplitude forecast. Reclaiming $87,374 would support the larger count; losing the $76,173 launch area would delay/reset it, and the broader count fails below its $57,735 origin. The short-term cards retain their own exact cancellation, chase and expiry rules and need NEW confirmation after this post; no earlier signal is replayed. Monday brings ISM manufacturing at 10:00 AM EST and the RBA decision at 10:30 PM EST. Conditional educational research, not certainty or actual fills. Follow @CChartistry for more. #BTC #Crypto #ElliottWave
BTC ELLIOTT WAVE: CAN $110K ARRIVE BY DECEMBER 1? 🟢
Our weekly count points to a potential five-wave advance after the 2025–26 correction. This is one bullish scenario, not a confirmed forecast.
THE BIGGER PICTURE — approximate spot pivots:
2023 low: ~$24.9K
1: Mar 2024 ~$73.8K
2: Aug 2024 ~$49.6K
3: Jan 2025 ~$109.3K
4: Apr 2025 ~$74.4K
5: Oct 2025 ~$126.3K
A: Feb 2026 ~$59.9K
B: May 2026 ~$82.8K
C: Jul 1, 2026 ~$57.7K
POSSIBLE NEW ADVANCE:
1: $57.7K → $87.4K (Jul 1–Sep 21)
2: $87.4K → ~$79.2K (Oct 24 low; may continue)
3: ~$110K around Nov 20 / by Dec 1
4: ~$99K around mid-December
5: ~$127K around mid-January 2027
WHY $110K? Wave 1 gained about $29.6K. An equal advance from $79.2K projects ~$108.8K. Projected wave 4 near $99K stays above the $87.4K wave 1 high, while wave 3 is not the shortest under these assumptions.
WATCH: A sustained reclaim of $87.4K strengthens the bullish count. Below $79.2K, wave 2 may extend and the equal-leg target changes. Below $57.7K invalidates this specific impulse.
$110K would still be below the 2025 high; a corrective rally is an alternative. Future dates and prices are approximate.
#Bitcoin #BTC #Crypto #Cryptocurrency #Blockchain #BTCUSD #BitcoinPrice #BitcoinTrading #CryptoTrading #TechnicalAnalysis #ElliottWave #TradingView #BitcoinAnalysis #CryptoAnalysis #CryptoNews #PriceAction #Trading #Investing #Markets #BitcoinNews #CryptoMarkets #MarketAnalysis
BTC ELLIOTT WAVE: CAN $110K ARRIVE BY DECEMBER 1? 🟢
Our weekly count points to a potential five-wave advance after the 2025–26 correction. This is one bullish scenario, not a confirmed forecast.
THE BIGGER PICTURE — approximate spot pivots:
2023 low: ~$24.9K
1: Mar 2024 ~$73.8K
2: Aug 2024 ~$49.6K
3: Jan 2025 ~$109.3K
4: Apr 2025 ~$74.4K
5: Oct 2025 ~$126.3K
A: Feb 2026 ~$59.9K
B: May 2026 ~$82.8K
C: Jul 1, 2026 ~$57.7K
POSSIBLE NEW ADVANCE:
1: $57.7K → $87.4K (Jul 1–Sep 21)
2: $87.4K → ~$79.2K (Oct 24 low; may continue)
3: ~$110K around Nov 20 / by Dec 1
4: ~$99K around mid-December
5: ~$127K around mid-January 2027
WHY $110K? Wave 1 gained about $29.6K. An equal advance from $79.2K projects ~$108.8K. Projected wave 4 near $99K stays above the $87.4K wave 1 high, while wave 3 is not the shortest under these assumptions.
WATCH: A sustained reclaim of $87.4K strengthens the bullish count. Below $79.2K, wave 2 may extend and the equal-leg target changes. Below $57.7K invalidates this specific impulse.
$110K would still be below the 2025 high; a corrective rally is an alternative. Future dates and prices are approximate.
#Bitcoin #BTC #Crypto #Cryptocurrency #Blockchain #BTCUSD #BitcoinPrice #BitcoinTrading #CryptoTrading #TechnicalAnalysis #ElliottWave #TradingView #BitcoinAnalysis #CryptoAnalysis #CryptoNews #PriceAction #Trading #Investing #Markets #BitcoinNews #CryptoMarkets #MarketAnalysis
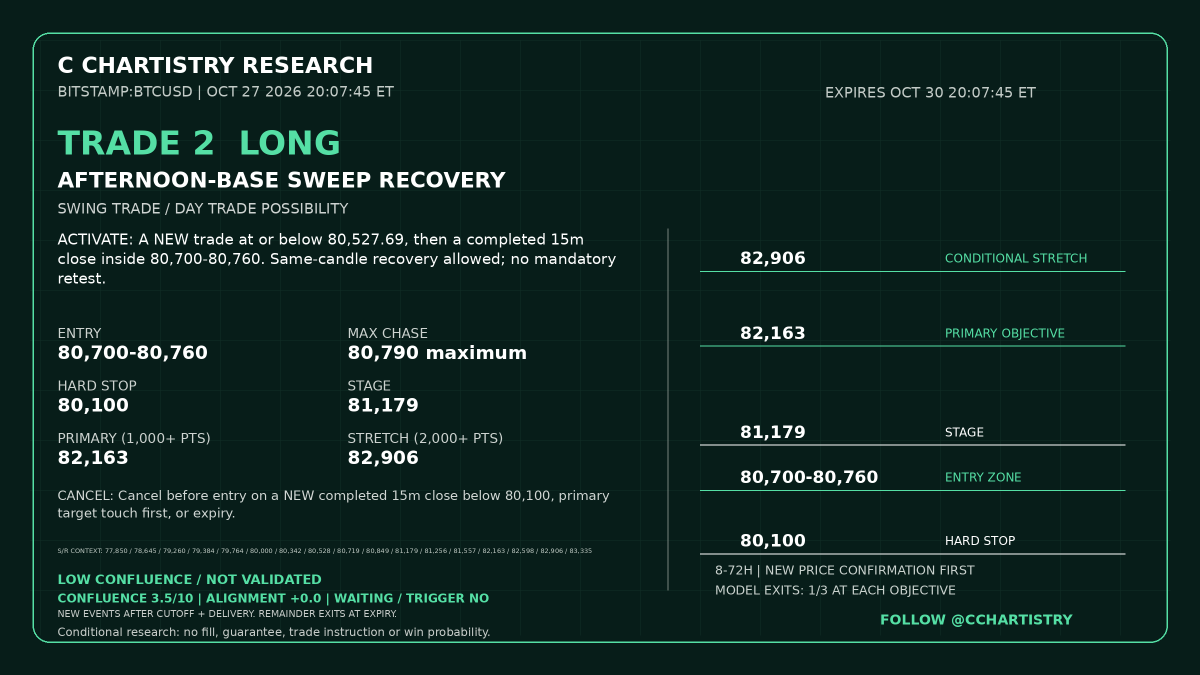
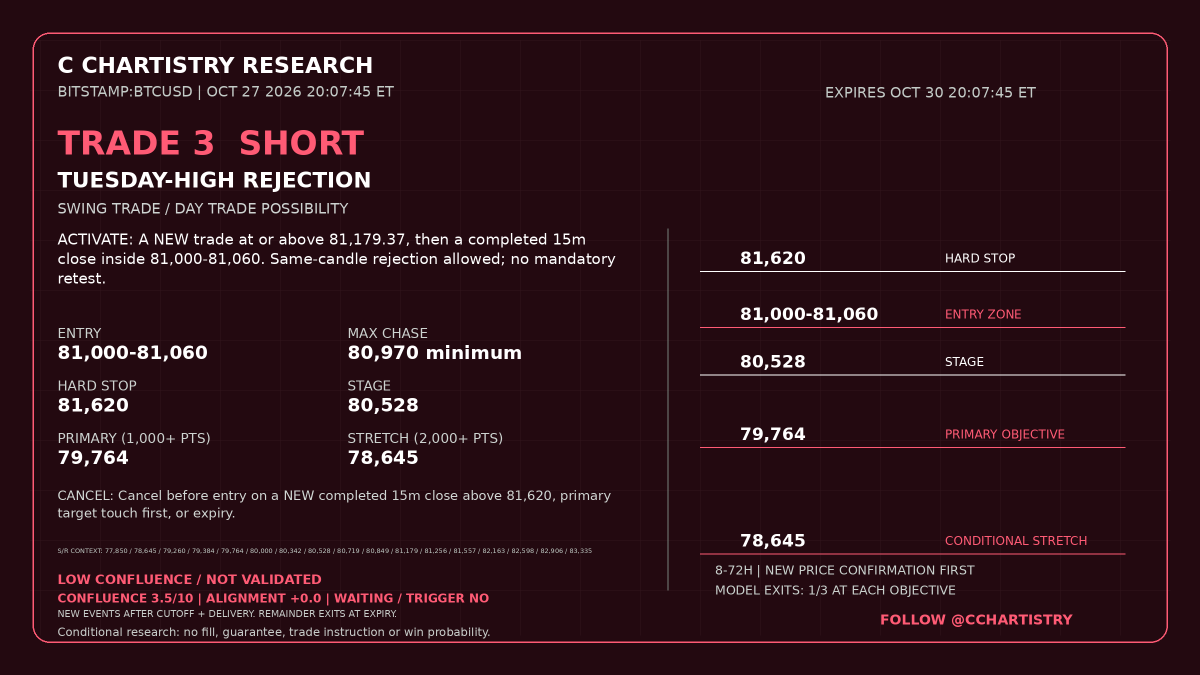
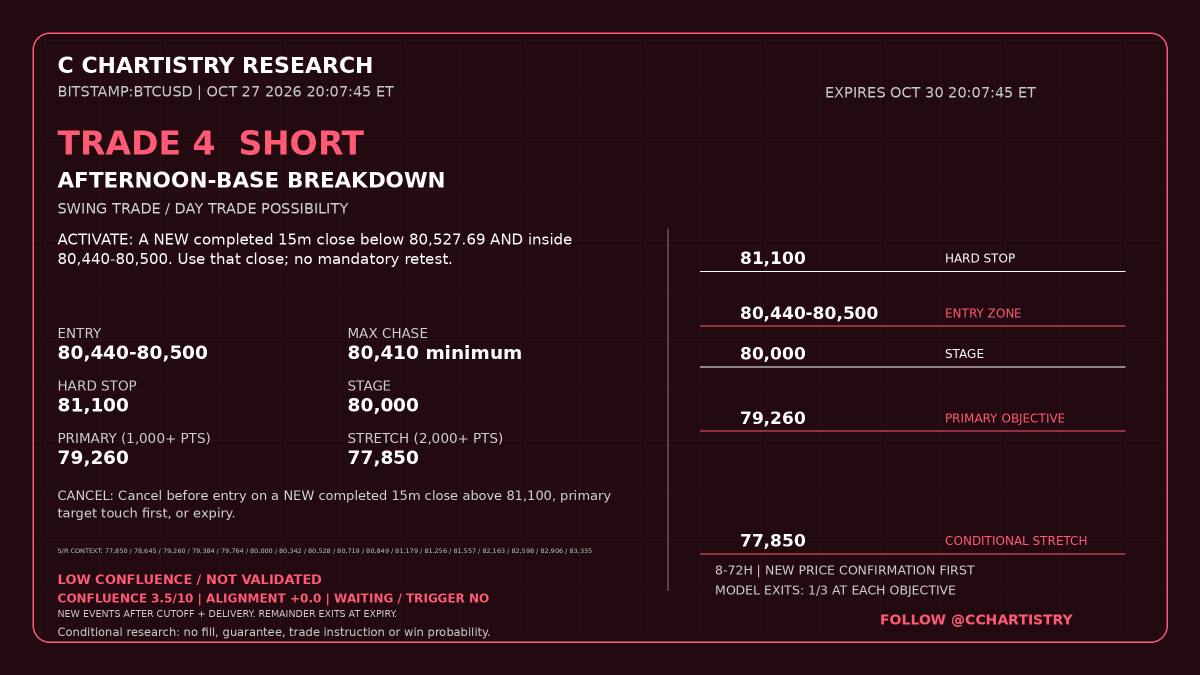
#Bitcoin is rebuilding, one higher low at a time. Research: October 27, 2026, 8:07 PM New York | BITSTAMP:BTCUSD; completed-price check through 8:35 PM. Over the last 72 hours, Sunday found support near $79,260, Monday held a higher low, and Tuesday extended the recovery toward $81,180 before pulling back. That improves the near-term structure; holding the afternoon base near $80,528 keeps the higher-low recovery intact, while a confirmed loss would reopen the lower range. Since yesterday’s weekly post, that broader rebound thesis remains in play: one of our proprietary weekly indicators supports a possible recovery toward $87,500, in the upper weekly cloud shelf region discussed earlier around $88,000. The 2025 range volume-profile point of control near $90,000 remains a potential magnet if that recovery develops. We lean more bullish than bearish over the next two to three weeks. The four cards address shorter-term continuation, recovery, rejection and breakdown conditions; their short scenarios can coexist with that broader bullish outlook.
The next 24 hours’ timing map places an hourly trough tonight, October 27, at 10:00 PM; a 15-minute trough October 28 at 2:00 AM; an hourly peak at 8:00 AM; and a 15-minute peak at 3:15 PM, all New York time. There is no 4-hour turn center inside this 24-hour window. That sequence allows for an overnight reaction followed by a recovery attempt into Wednesday, but timing alone does not establish higher highs: price must defend its higher lows and reclaim the recovery high. Wednesday’s Bank of Canada and Federal Reserve decisions can disrupt that path. The weekly rebound is a separate, multiweek possibility—not a promise that every intraday swing will rise. Conditional swing/day-trade research; every card requires fresh confirmation after this post, with no earlier signal replayed. Follow @CChartistry for more. #BTC #Crypto #BitcoinTrading
$BTC weekly cyan compression puts the upper shelf near $88K; the 2025 range POC sits near $90K.
Bullish thesis: a wick through the cyan top into $88K–$90K over the next 2–3 weeks.
We favor a $90K test. Beyond that, the next move remains open. #Bitcoin
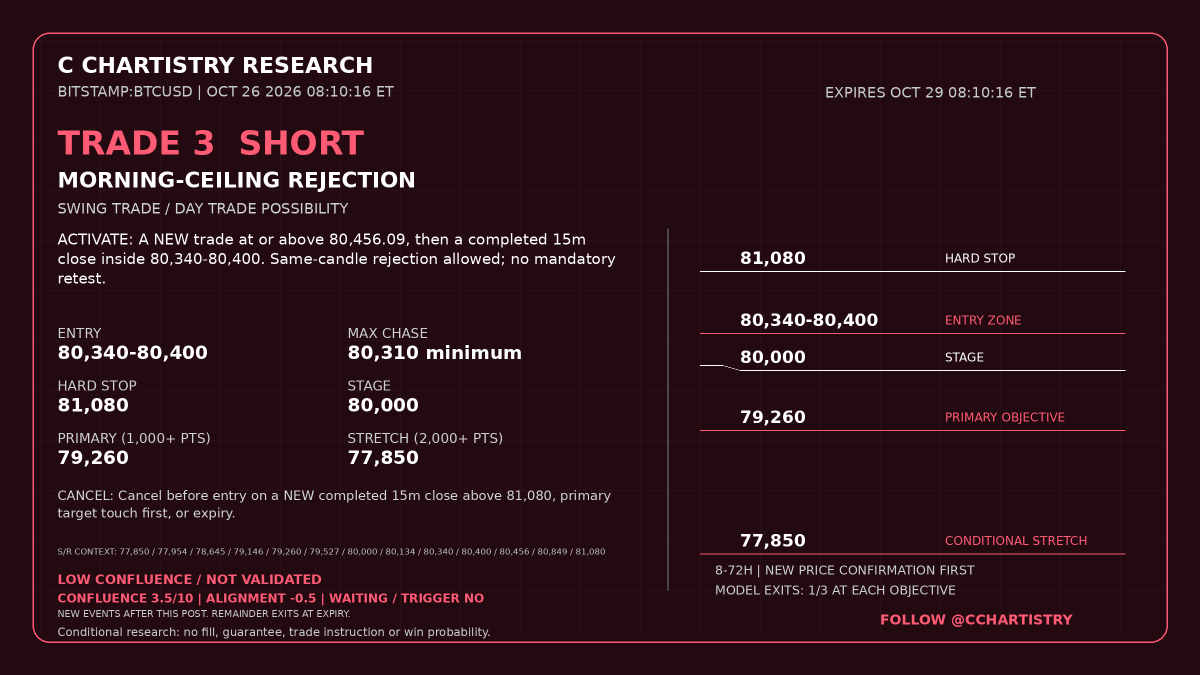
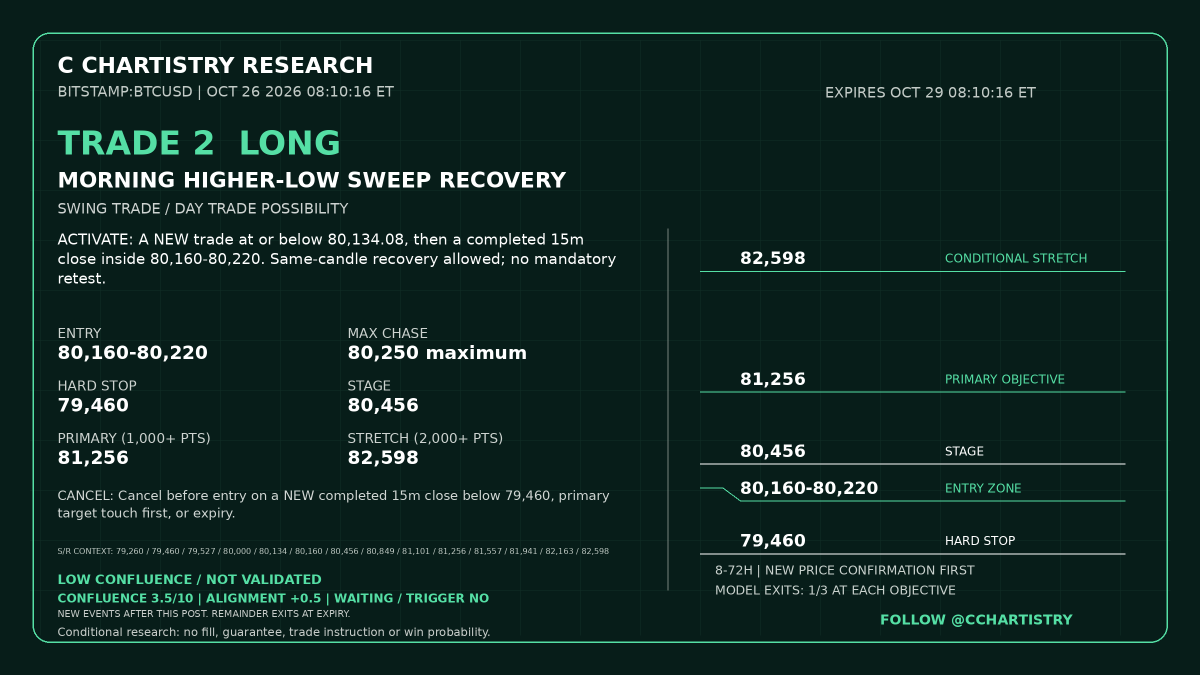
#Bitcoin’s early rebound has lost its footing again. Research: October 26, 2026, 8:10 AM New York | BITSTAMP:BTCUSD; completed-price check through 9:30 AM. Over the last 72 hours, Friday extended the lower-high decline, Saturday washed out and rebounded, and Sunday stalled near $80,849 at 12:55 AM before reaching $79,260 at 11:50 PM. Since Friday’s base-building post, the weekend recovery failed to repair the broader structure. Monday recovered early, then slipped back below $80,000 on the latest completed check, leaving the larger lower-high sequence intact. Sustained recovery needs a fresh ceiling reclaim and a protected higher low; another rejection or reaction-floor break favors renewed lower highs and lower lows. The first LONG card was cancelled by the 9:30 AM close and is marked inactive. The other three cards retain their exact conditional plans.
The next 24-hour cycle map, all New York time: 1h peak October 26 at 10:00 PM; 15m trough October 26 at 10:45 PM, followed by a peak October 27 at 4:15 AM; 4h has no new turn center in this 24-hour window. The nearby hourly crest and 15-minute trough make tonight a mixed reaction window, followed by an overnight rebound window. There is not a second same-frame high or low within this map to establish a sustained rising or falling sequence, so price structure decides whether that rebound becomes a higher low or another lower high. Daily and weekly context remains softer against the more constructive monthly backdrop, with Wednesday’s policy decisions the next major wider-horizon risk. Fresh confirmation must occur after this post; earlier touches do not count. Conditional research, not a guaranteed path. Follow @CChartistry for more. #BTC #Crypto #BitcoinTrading
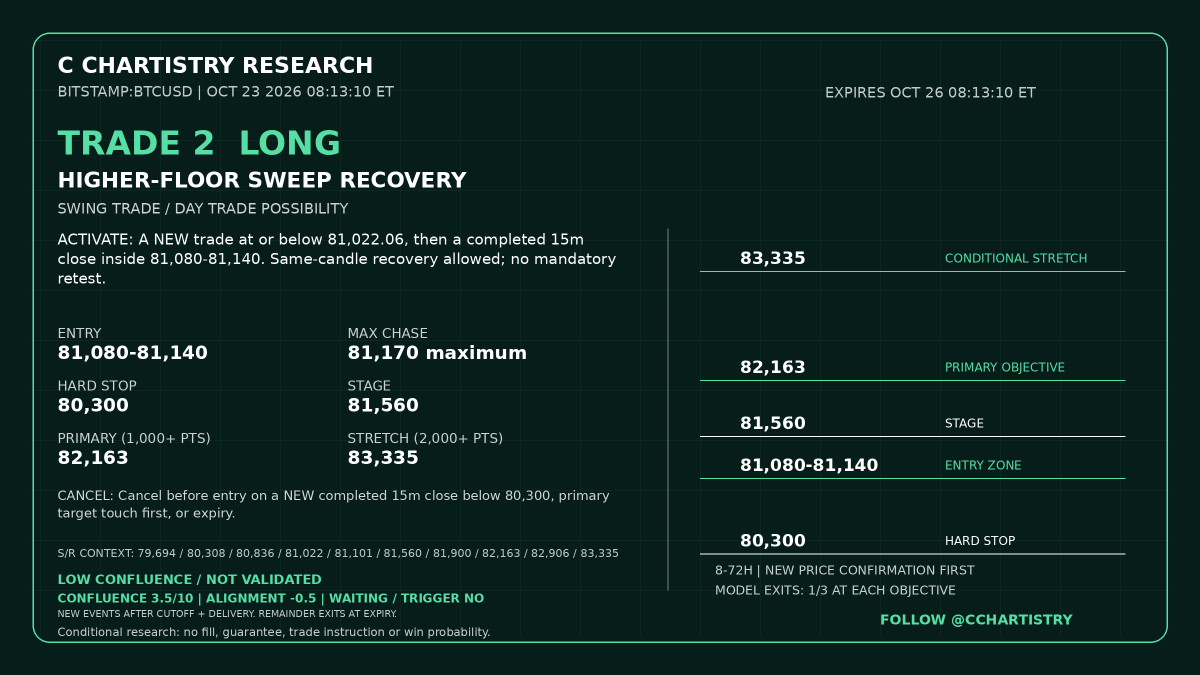
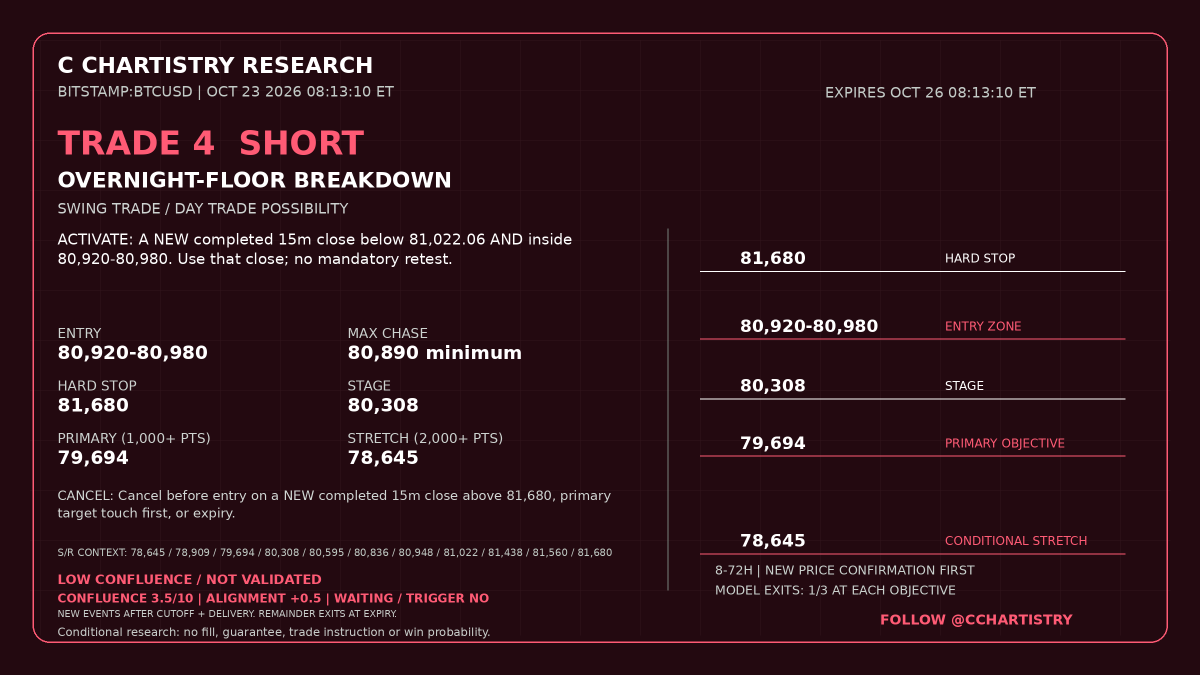
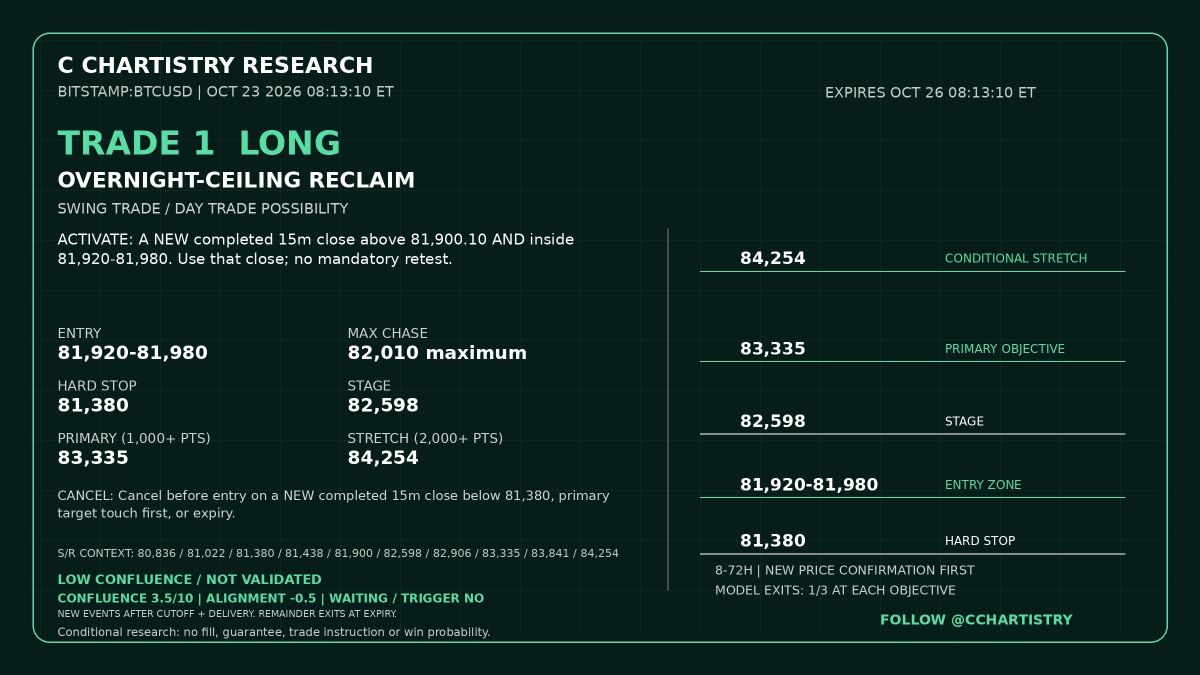
#Bitcoin is trying to build a base after the recovery broke down. Research: October 23, 2026, 8:13 AM New York | BITSTAMP:BTCUSD; completed-price check through 9:05 AM. Over the last 72 hours, Tuesday rebuilt the recovery, Wednesday reached about $84,843 at 12:35 PM, and Thursday reversed to $80,836 at 12:50 PM. The overnight rebound then stalled near $81,900 at 11:50 PM. Since the last post, the morning floor gave way and the failed-rally bias held; the subsequent bounce has improved the short-term floor without repairing the broader lower-high sequence. This morning’s dip has rebounded, but the overnight ceiling remains the boundary to reclaim. My near-term bias remains cautious beneath it: another rejection would leave room for a renewed support test, while a completed reclaim would strengthen the higher-low recovery case. The projected intraday peaks ease lower while troughs edge higher, suggesting compression rather than a clean directional trend; price must confirm the break. The four cards carry the exact conditional plans and risk limits.
For the next 24 hours, all times New York: Friday, October 23 has a 15-minute peak at 12:00 PM, a trough at 6:15 PM and a peak at 11:15 PM; Saturday, October 24 has a 15-minute trough at 4:15 AM and a peak at 8:45 AM. The 1-hour and 4-hour maps both place a trough at 12:00 PM Friday, with no additional centers on either frame inside this horizon. Their broader trough window collides with the intraday peak, so noon is a reaction window, not automatic agreement or a buy/sell instruction. The sequence leaves room for an afternoon pullback and another overnight recovery attempt, but its price amplitude is not reliable enough to declare higher highs or lower lows in advance. Today’s 10:00 AM Michigan release can disrupt that path. Conditional educational research: require NEW completed-candle confirmation after this post, respect cancellations and chase limits, and treat timing windows as watches. Follow @CChartistry for more. #BTC #Crypto #BitcoinTrading
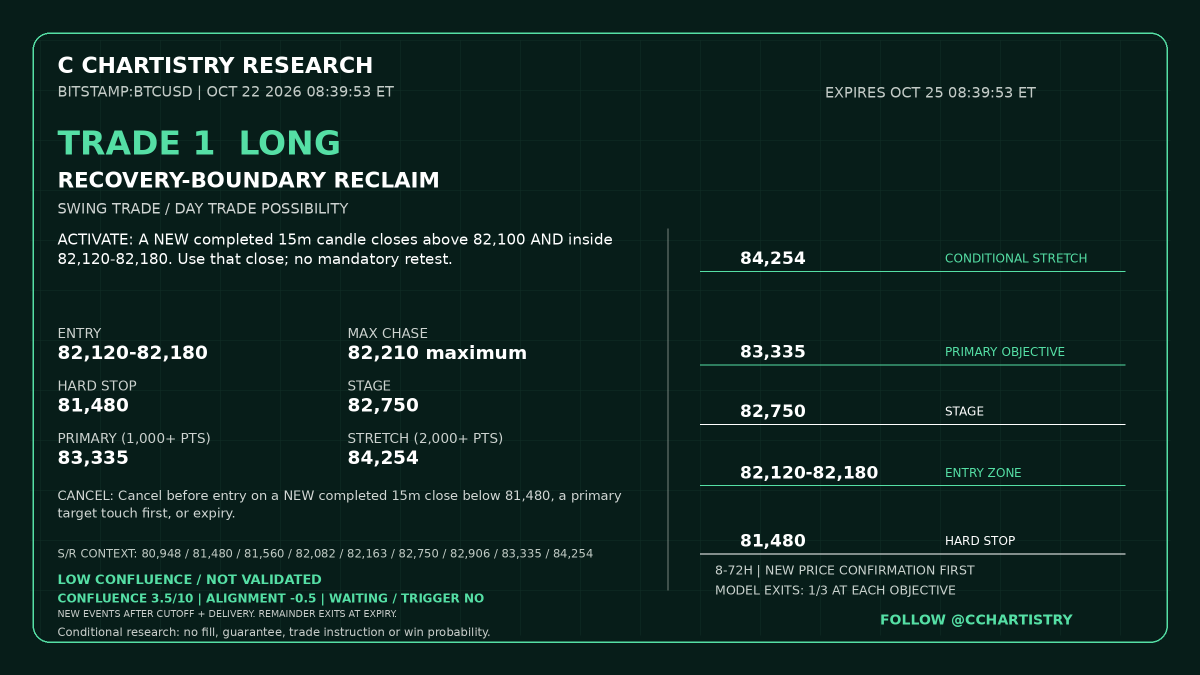
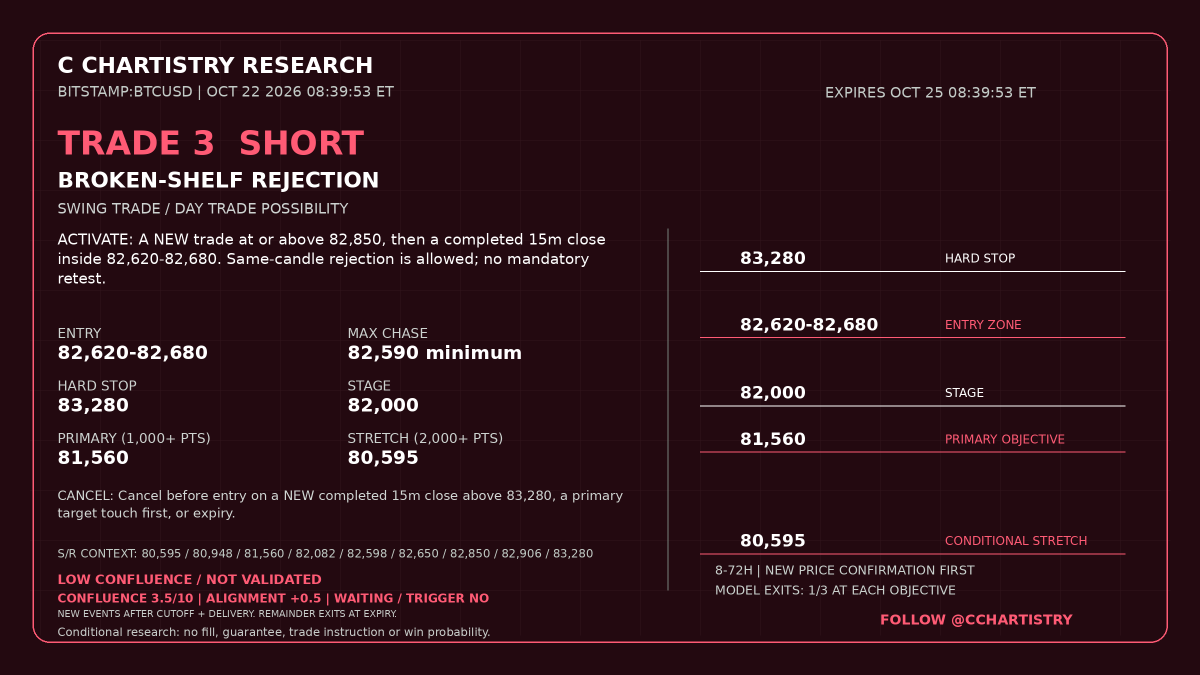
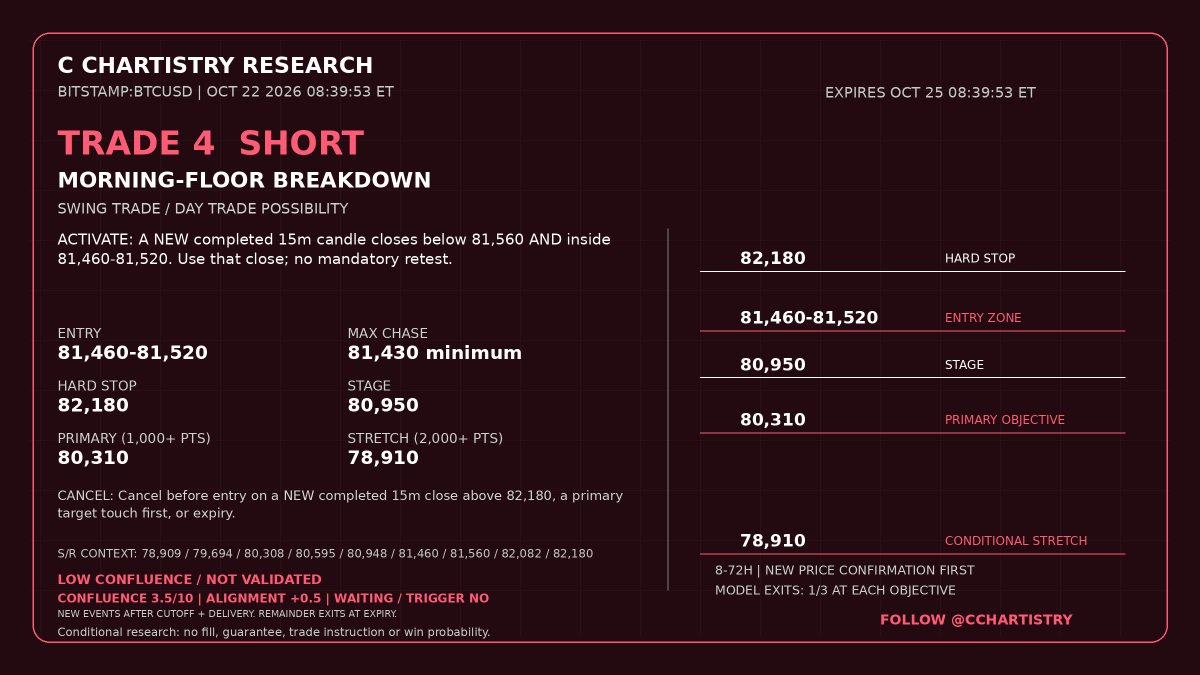
#Bitcoin gave the recovery a real test, then handed control back to sellers. Research: October 22, 2026, 8:39 AM New York | BITSTAMP:BTCUSD. Over the last 72 hours, Monday's bounce faded, Tuesday rebuilt the recovery, and Wednesday extended it toward $84,800 before reversing sharply. Since our last post, losing the reclaimed $82,200 area broke the higher-high/higher-low repair condition; Thursday's rebound has so far left a lower high above the $81,560 morning floor. My near-term bias favors failed rallies and another test of support while that reclaim stays out of reach. A sustained recovery of the broken boundary would shift attention back to rebuilding higher lows. One selected timing highlight was Thursday's 3:15 AM local trough, which matched its printed center; it was an interim reaction, not the final morning bottom, and the other overnight timing calls were mixed. The four fresh cards cover reclaim, sweep recovery, rejection and breakdown, with their exact conditions and risk limits.
For the next 24 hours, all times New York: Thursday, October 22 has 1-hour trough watches at 11:00 AM and 1:00-2:00 PM, a 15-minute peak at 3:15 PM with an older alternative at 5:30 PM, a broader 4-hour trough watch at 8:00 PM, and a separate 1-hour trough alternative at 10:00 PM. Friday, October 23 has a 1-hour peak around 2:00 AM, 15-minute trough alternatives at 2:00 AM and 3:45-4:00 AM, and an older 4-hour trough watch at 8:00 AM; the refreshed 4-hour center falls beyond this 24-hour map. Nearby alternatives are reaction windows, not independent votes. This leaves room for a rebound into an afternoon lower high, then another overnight test; the projected high/low sequences are mixed, so price must establish whether that test holds a higher low or extends the decline. Japan's CPI at 7:30 PM Thursday and UK retail sales at 2:00 AM Friday can disrupt the sequence. Treat the windows as places to watch, require fresh completed-candle confirmation after this post, and respect cancellation and chase limits. Follow @CChartistry for more. #BTC #Crypto #BitcoinTrading
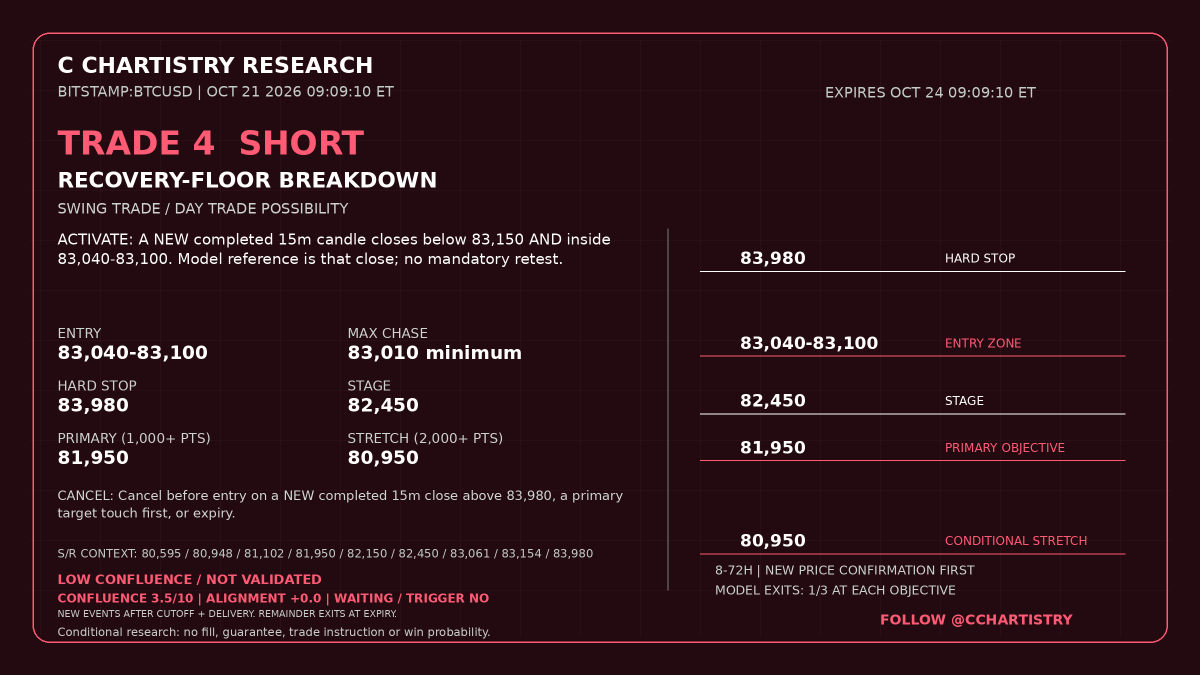
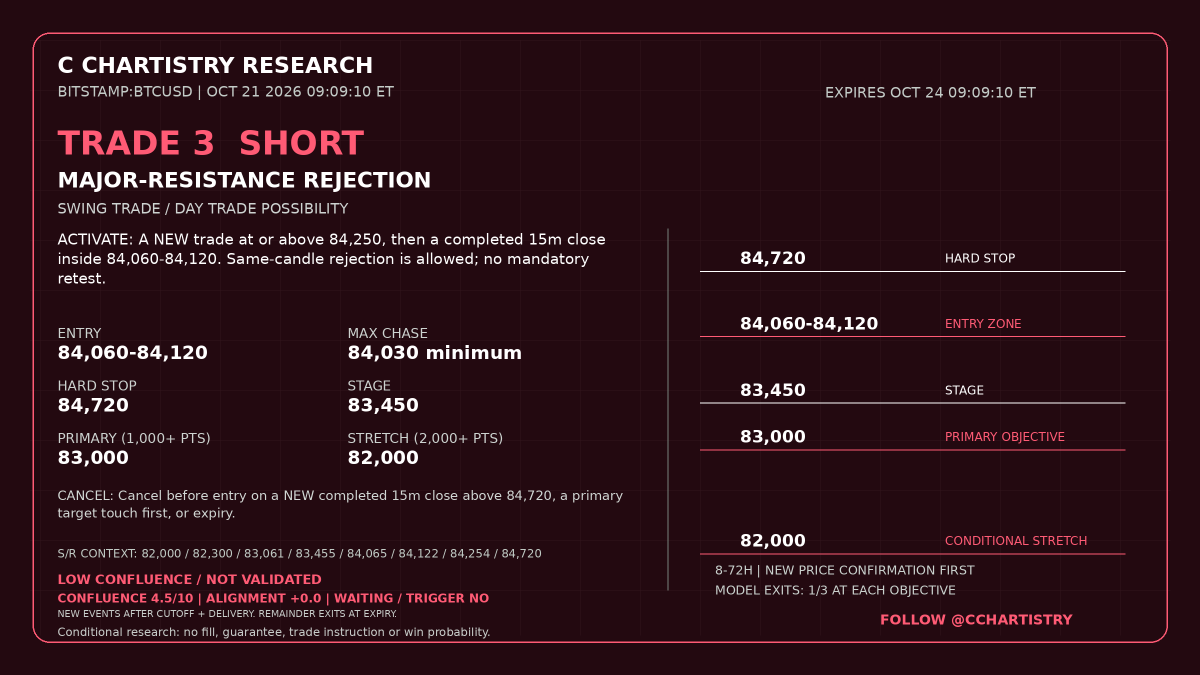
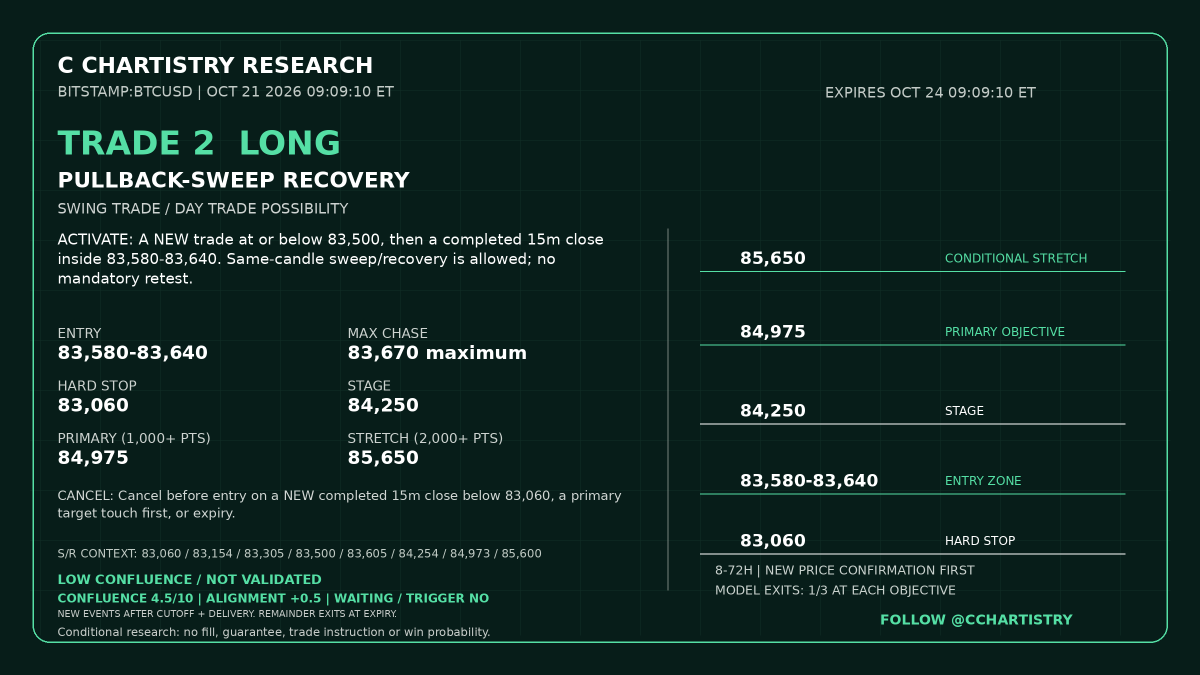
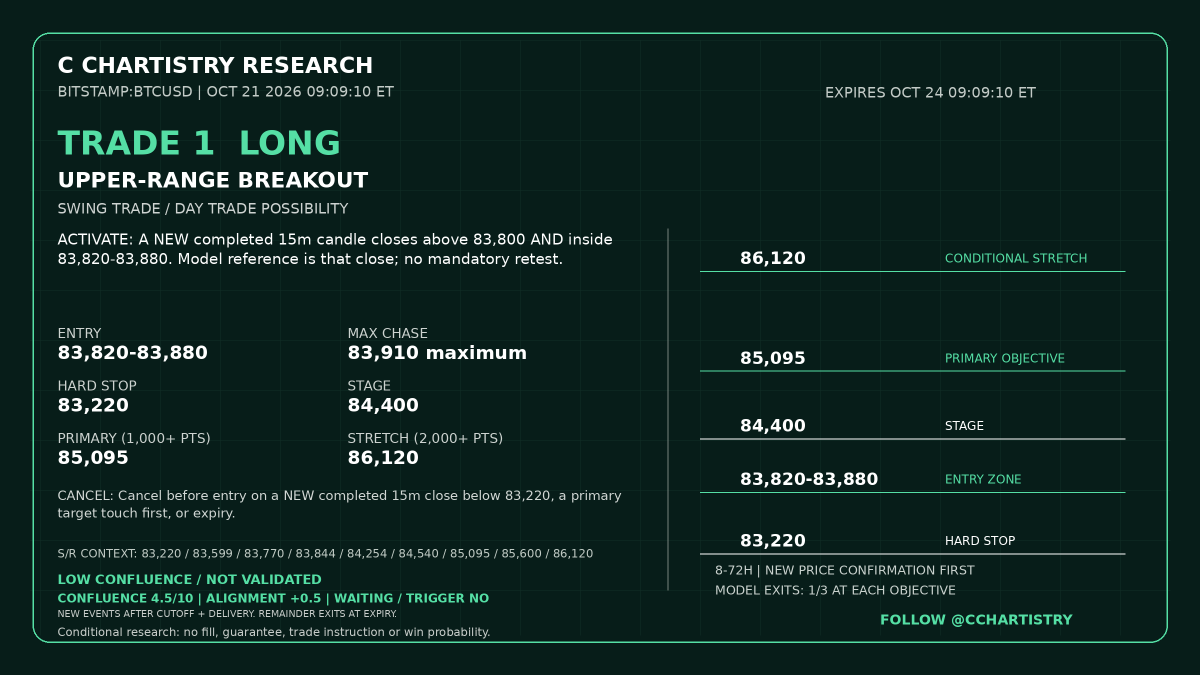
#Bitcoin is repairing the damage, but the next dip still matters. Research: October 21, 2026, 9:09 AM New York | BITSTAMP:BTCUSD. Over the last 72 hours, Sunday defended the $80,600 area; Monday's recovery faded, Tuesday reclaimed $82,200, and Wednesday extended the rebound toward $83,800. Since our last post, that reclaim invalidated the failed-recovery bias: observed intraday structure now favors higher highs and higher lows, provided the reclaimed structure holds. Selected timing highlights from Tuesday, October 20: the 2:30 PM trough matched at 2:30 PM, and the 7:30 PM peak resolved at 7:45 PM on the 15-minute chart. Those are selected timing highlights, not a complete performance record or proof that the earlier directional bias held. The four fresh cards cover continuation, pullback recovery, rejection and breakdown; exact conditions and risk boundaries stay there.
For the next 24 hours, all times New York: Wednesday, October 21 has a 15-minute peak reaction window from 5:00-6:00 PM. Thursday, October 22 has a 15-minute trough window from 2:15-3:15 AM, followed by a 1-hour trough around 6:00 AM; there is no new 4-hour turn center inside this horizon. Nearby times are alternative timing estimates, not separate votes. This maps an evening upswing into an overnight pullback; if that pullback holds a higher low, the recovery can extend, while failure of reclaimed structure would reopen the bearish path. Thursday's 8:30 AM U.S. jobless claims can disrupt the sequence. A cycle window is a place to watch price, not an automatic entry: require fresh completed-candle confirmation after this post, respect the cards' cancellation rules, and never chase an elapsed signal. Follow @CChartistry for more. #BTC #Crypto #BitcoinTrading
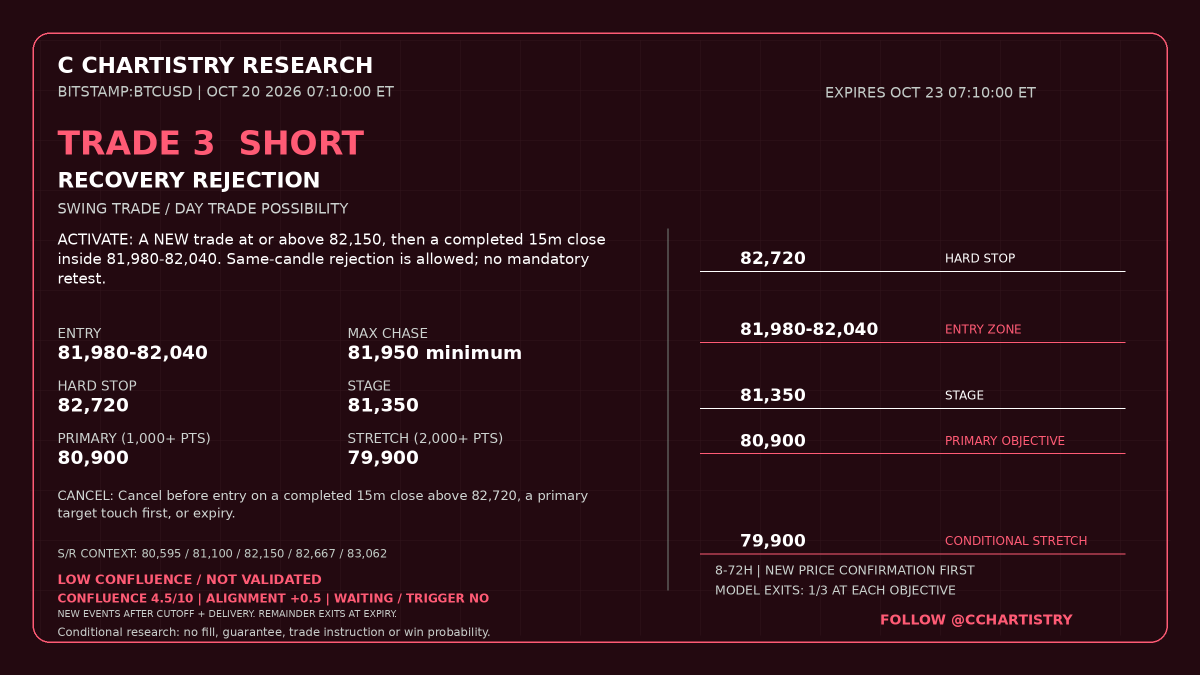
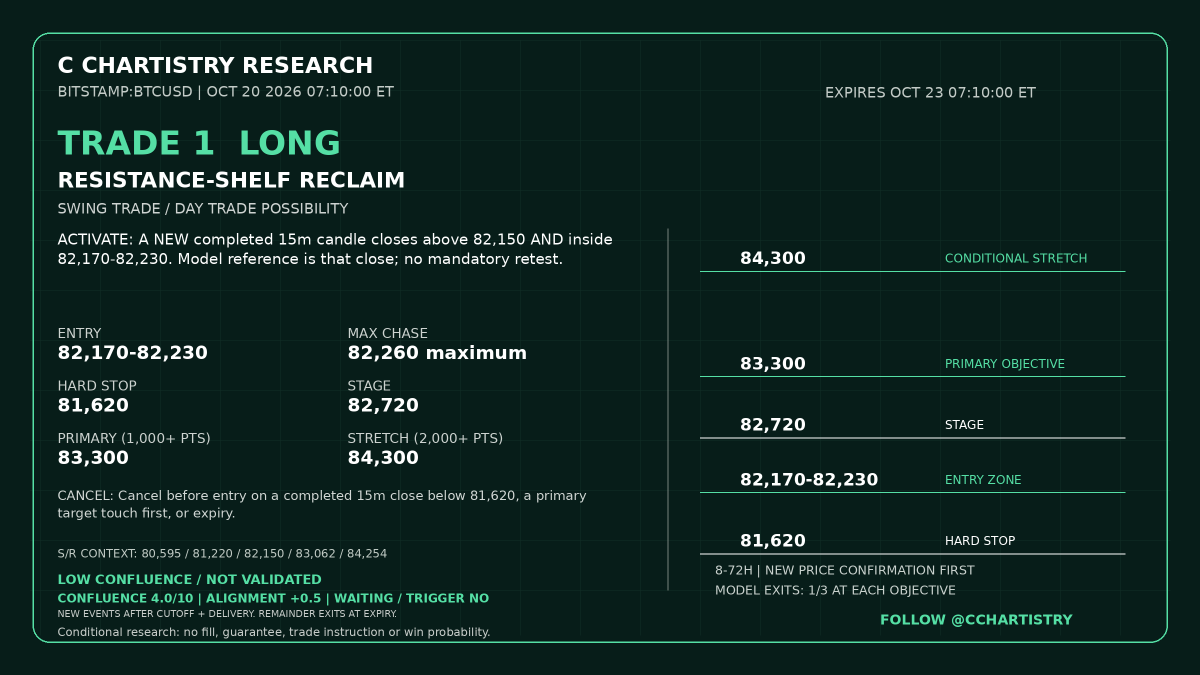
#Bitcoin | Research Oct 20, 2026, 07:10 ET | BITSTAMP:BTCUSD. Over the last three days, Bitcoin held the $80,600 floor, rebounded to roughly $83,100, then rolled into lower highs and lower lows back toward the low-$81,000s. Since the last post, three of five matured printed windows passed the strict one-bar timing audit: the Oct 18 1:45 PM trough matched exactly, the 7:45 PM peak resolved one 15m bar later, and the Oct 19 5:45 AM peak resolved one bar early; the two misses remain in the private audit. Current structure favors failed-recovery selling pressure unless price can reclaim about $82,200. The cards carry the exact confirmation, entry, stop and objective ladders.
Next 24 hours, New York time: the 15m map shows an early peak window today 7:45-8:45 AM, an afternoon trough at 2:30-2:45 PM, an evening peak sequence at 5:45-7:30 PM, then an overnight trough Wednesday 2:30-2:45 AM. The 4h map adds a broader peak window around 8:00 PM; the 1h map has no new turn center inside this horizon. Successive projected 15m peaks and troughs step lower after the early window, so the working path is lower-high/lower-low pressure with rebounds along the way; a sustained reclaim of the ceiling would shift it toward range repair. Timing windows need fresh price confirmation after this post and are not automatic entries. Follow @CChartistry for more. #BTC #Crypto #BitcoinTrading
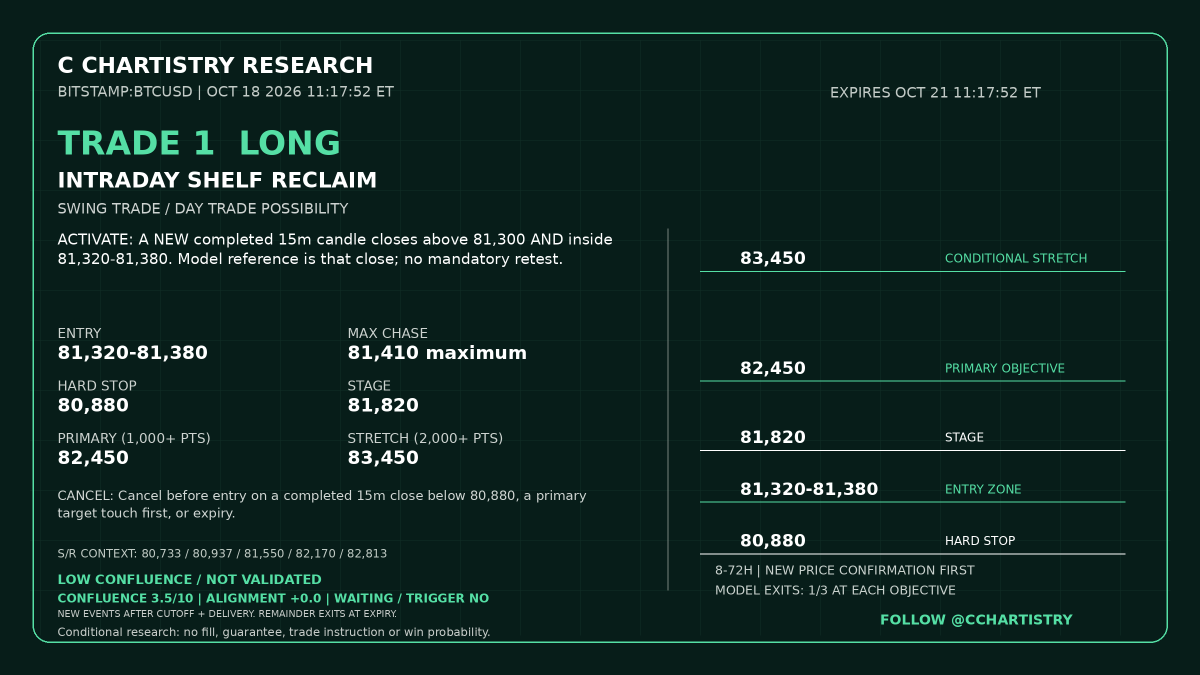
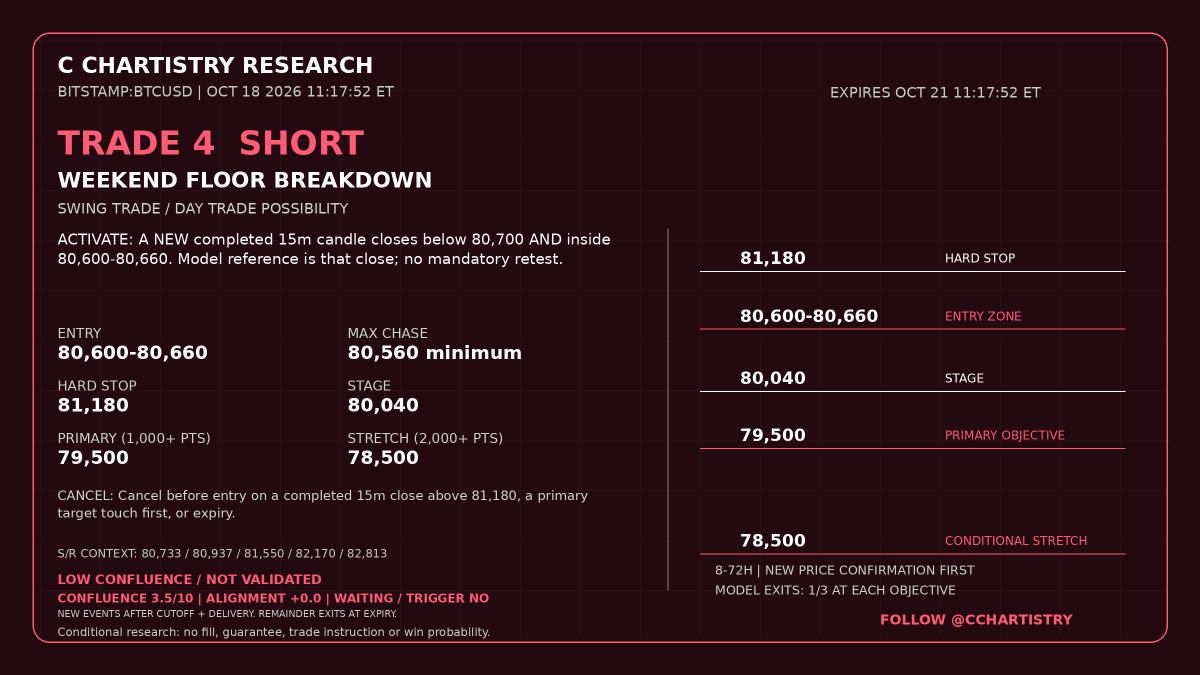
#Bitcoin | Sunday into the new week. Research: Oct 18, 2026, 11:17 ET | BITSTAMP:BTCUSD. The last 72 hours have been a recovery followed by repeated tests of that recovery: Thursday rebounded from the earlier washout near $79,700, Friday stalled around $82,800, and Saturday revisited the $80,700 area before an overnight climb. Since yesterday’s post, that climb cleared Saturday’s high, but Sunday’s breakout failed to hold and sellers pushed price back into the weekend range. Selected timing highlights from yesterday’s map: the Sunday 01:30 trough window matched a local 15-minute low at 01:45, and the 04:45 peak window matched a local high at 05:00; the hourly 01:00 trough matched its 01:00 bar. The same 15-minute projection series passed 3 of its 4 matured calls within one source bar; Saturday’s late-morning call was a two-bar near-miss. These were local turns, not every major session extreme.
For the next 24–48 hours, my conditional bias is a relief-rebound attempt inside an unfinished repair. The next 24-hour cycle map, all New York time: 15-minute trough Sunday 13:45, peak 19:45, trough Monday 00:15, then peak 05:45; hourly trough Sunday 19:00. The current 4-hour map has no new turn center inside that 24-hour window. Successive projected 15-minute highs and lows edge higher into early Monday, suggesting tentative base-building, but the evening hourly trough and nearby 15-minute peak pull against each other, so expect a reaction zone rather than a straight line. Holding a higher low and reclaiming the broken intraday shelf would improve the recovery; a failed bounce or a fresh weekend-floor break keeps lower highs and lower lows in play. The four cards carry the exact confirmation, stop and objective ladders. New completed-candle confirmation after this post only; a cycle window alone does not activate a plan.
Stepping back, one of our proprietary methods is deeply oversold on the daily chart, currently near negative 60, which leaves room for an upward retracement as the new week begins. The weekly is still in its overbought region and is losing momentum. Those conditions can coexist: a daily bounce can become a lower high within a weekly pullback. Daily price is trying to hold above Thursday’s washout, while weekly highs have stepped down and this week has undercut last week’s low. I would treat an early-week bounce as a repair attempt until price establishes higher lows and holds reclaimed resistance. The current daily and weekly candles are still developing.
The monthly picture is beginning to curl upward from negative territory, and the completed monthly lows have risen since the summer. That is a possible foundation for a broader recovery over coming weeks, with the current month still open; it does not settle Monday’s direction. The coherent path to watch is a short-term rebound first, then whether that rebound builds durable higher lows or rolls into another weekly lower high. China’s economic releases tonight around 22:00 ET and Monday’s Bank of Canada surveys at 11:30 ET are nearby catalysts. Use the clock to focus attention and price structure to confirm the idea. Conditional educational scenarios, not guaranteed outcomes. Follow @CChartistry for more. #BTC #Crypto #BitcoinTrading
#Bitcoin | Sunday into the new week. Research: Oct 18, 2026, 11:17 ET | BITSTAMP:BTCUSD. The last 72 hours have been a recovery followed by repeated tests of that recovery: Thursday rebounded from the earlier washout near $79,700, Friday stalled around $82,800, and Saturday revisited the $80,700 area before an overnight climb. Since yesterday’s post, that climb cleared Saturday’s high, but Sunday’s breakout failed to hold and sellers pushed price back into the weekend range. Selected timing highlights from yesterday’s map: the Sunday 01:30 trough window matched a local 15-minute low at 01:45, and the 04:45 peak window matched a local high at 05:00; the hourly 01:00 trough matched its 01:00 bar. The same 15-minute projection series passed 3 of its 4 matured calls within one source bar; Saturday’s late-morning call was a two-bar near-miss. These were local turns, not every major session extreme.
For the next 24–48 hours, my conditional bias is a relief-rebound attempt inside an unfinished repair. The next 24-hour cycle map, all New York time: 15-minute trough Sunday 13:45, peak 19:45, trough Monday 00:15, then peak 05:45; hourly trough Sunday 19:00. The current 4-hour map has no new turn center inside that 24-hour window. Successive projected 15-minute highs and lows edge higher into early Monday, suggesting tentative base-building, but the evening hourly trough and nearby 15-minute peak pull against each other, so expect a reaction zone rather than a straight line. Holding a higher low and reclaiming the broken intraday shelf would improve the recovery; a failed bounce or a fresh weekend-floor break keeps lower highs and lower lows in play. The four cards carry the exact confirmation, stop and objective ladders. New completed-candle confirmation after this post only; a cycle window alone does not activate a plan.
Stepping back, one of our proprietary methods is deeply oversold on the daily chart, currently near negative 60, which leaves room for an upward retracement as the new week begins. The weekly is still in its overbought region and is losing momentum. Those conditions can coexist: a daily bounce can become a lower high within a weekly pullback. Daily price is trying to hold above Thursday’s washout, while weekly highs have stepped down and this week has undercut last week’s low. I would treat an early-week bounce as a repair attempt until price establishes higher lows and holds reclaimed resistance. The current daily and weekly candles are still developing.
The monthly picture is beginning to curl upward from negative territory, and the completed monthly lows have risen since the summer. That is a possible foundation for a broader recovery over coming weeks, with the current month still open; it does not settle Monday’s direction. The coherent path to watch is a short-term rebound first, then whether that rebound builds durable higher lows or rolls into another weekly lower high. China’s economic releases tonight around 22:00 ET and Monday’s Bank of Canada surveys at 11:30 ET are nearby catalysts. Use the clock to focus attention and price structure to confirm the idea. Conditional educational scenarios, not guaranteed outcomes. Follow @CChartistry for more. #BTC #Crypto #BitcoinTrading
#Bitcoin | Sunday into the new week. Research: Oct 18, 2026, 11:17 ET | BITSTAMP:BTCUSD. The last 72 hours have been a recovery followed by repeated tests of that recovery: Thursday rebounded from the earlier washout near $79,700, Friday stalled around $82,800, and Saturday revisited the $80,700 area before an overnight climb. Since yesterday’s post, that climb cleared Saturday’s high, but Sunday’s breakout failed to hold and sellers pushed price back into the weekend range. Selected timing highlights from yesterday’s map: the Sunday 01:30 trough window matched a local 15-minute low at 01:45, and the 04:45 peak window matched a local high at 05:00; the hourly 01:00 trough matched its 01:00 bar. The same 15-minute projection series passed 3 of its 4 matured calls within one source bar; Saturday’s late-morning call was a two-bar near-miss. These were local turns, not every major session extreme.
For the next 24–48 hours, my conditional bias is a relief-rebound attempt inside an unfinished repair. The next 24-hour cycle map, all New York time: 15-minute trough Sunday 13:45, peak 19:45, trough Monday 00:15, then peak 05:45; hourly trough Sunday 19:00. The current 4-hour map has no new turn center inside that 24-hour window. Successive projected 15-minute highs and lows edge higher into early Monday, suggesting tentative base-building, but the evening hourly trough and nearby 15-minute peak pull against each other, so expect a reaction zone rather than a straight line. Holding a higher low and reclaiming the broken intraday shelf would improve the recovery; a failed bounce or a fresh weekend-floor break keeps lower highs and lower lows in play. The four cards carry the exact confirmation, stop and objective ladders. New completed-candle confirmation after this post only; a cycle window alone does not activate a plan.
Stepping back, one of our proprietary methods is deeply oversold on the daily chart, currently near negative 60, which leaves room for an upward retracement as the new week begins. The weekly is still in its overbought region and is losing momentum. Those conditions can coexist: a daily bounce can become a lower high within a weekly pullback. Daily price is trying to hold above Thursday’s washout, while weekly highs have stepped down and this week has undercut last week’s low. I would treat an early-week bounce as a repair attempt until price establishes higher lows and holds reclaimed resistance. The current daily and weekly candles are still developing.
The monthly picture is beginning to curl upward from negative territory, and the completed monthly lows have risen since the summer. That is a possible foundation for a broader recovery over coming weeks, with the current month still open; it does not settle Monday’s direction. The coherent path to watch is a short-term rebound first, then whether that rebound builds durable higher lows or rolls into another weekly lower high. China’s economic releases tonight around 22:00 ET and Monday’s Bank of Canada surveys at 11:30 ET are nearby catalysts. Use the clock to focus attention and price structure to confirm the idea. Conditional educational scenarios, not guaranteed outcomes. Follow @CChartistry for more. #BTC #Crypto #BitcoinTrading
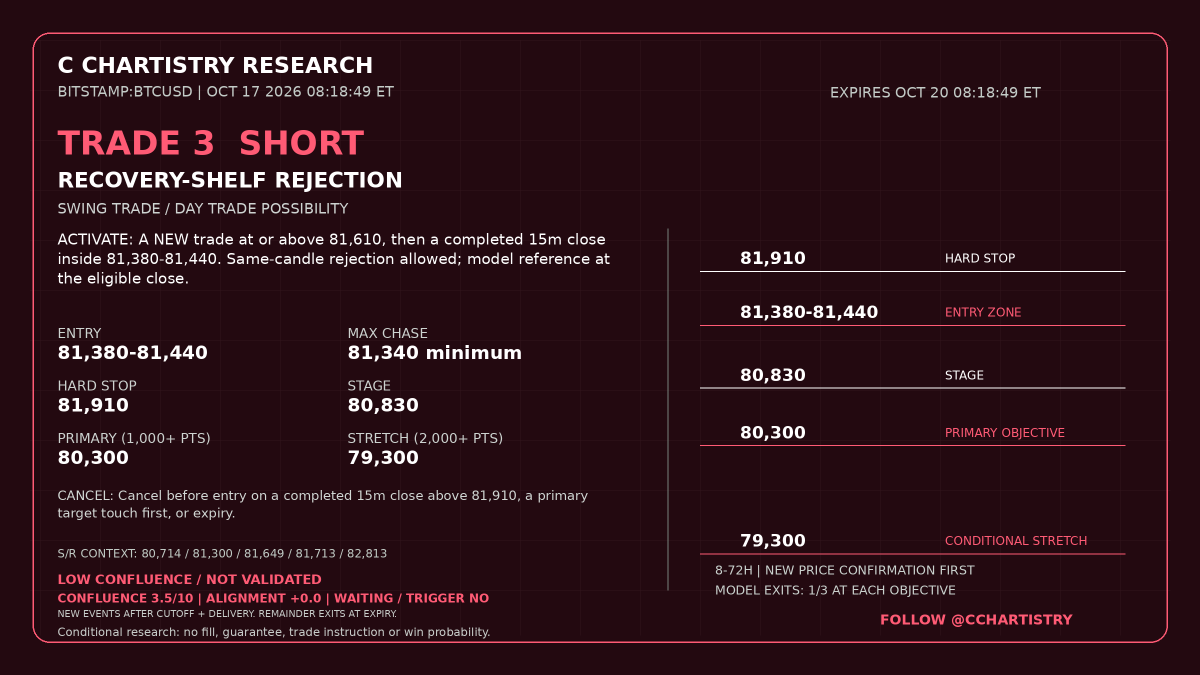
#Bitcoin | Research Oct 17, 2026, 08:18 ET | BITSTAMP:BTCUSD. The last three days tell a clear story: Wednesday rejected the upper range near $84,000, Thursday swept toward $79,700 and recovered, then Friday's rebound stalled around $82,800 before sellers regained control. My next-24-hour bias favors selling pressure on failed recoveries: the projected 15m sequence steps down to a lower overnight trough and a lower following peak. That favors a lower-high/lower-low path, with rebounds along the way. A sustained reclaim of the recovery ceiling would challenge that view; a fresh floor break would reinforce it. The four cards carry the exact confirmation, entry, stop and target ladders.
Next 24 hours, New York time: 15m trough window today 10:15-10:45 AM; peak 4:15-4:45 PM; Sunday Oct 18 trough 1:00-1:45 AM; peak 4:30-4:45 AM. The 1h trough watches are tonight 11:00 PM and Sunday 1:00 AM, concentrating attention on the late-night/early-morning rebound window. No 4h turn center falls inside this 24-hour window. Two peak windows and two trough windows: their descending sequence, rather than the count, drives the bias. Timing windows need price confirmation; they are not automatic entries. These are conditional educational scenarios, not guaranteed outcomes. Public confirmations must occur after this post; no earlier signals are replayed. Follow @CChartistry for more. #BTC #Crypto
#Bitcoin | Three days of structure
Research: October 16,2026 14:28:29 ET | BITSTAMP:BTCUSD | completed candles through 14:25 ET.
Wednesday began with another rejection near 84,000 at 04:10 ET. The rebound later that morning could not reclaim the upper range, and the loss of its floor turned the rest of the day into a sequence of lower rallies. The late-evening flush deepened the damage rather than repairing it.
Thursday extended the decline to roughly 79,700 at 09:55 ET, then delivered a sharp recovery that carried into Friday morning. Friday reached about 82,800 at 07:25 ET, but that rebound also failed to hold. The subsequent lower high and renewed afternoon selling leave the recovery fragile despite the latest bounce.
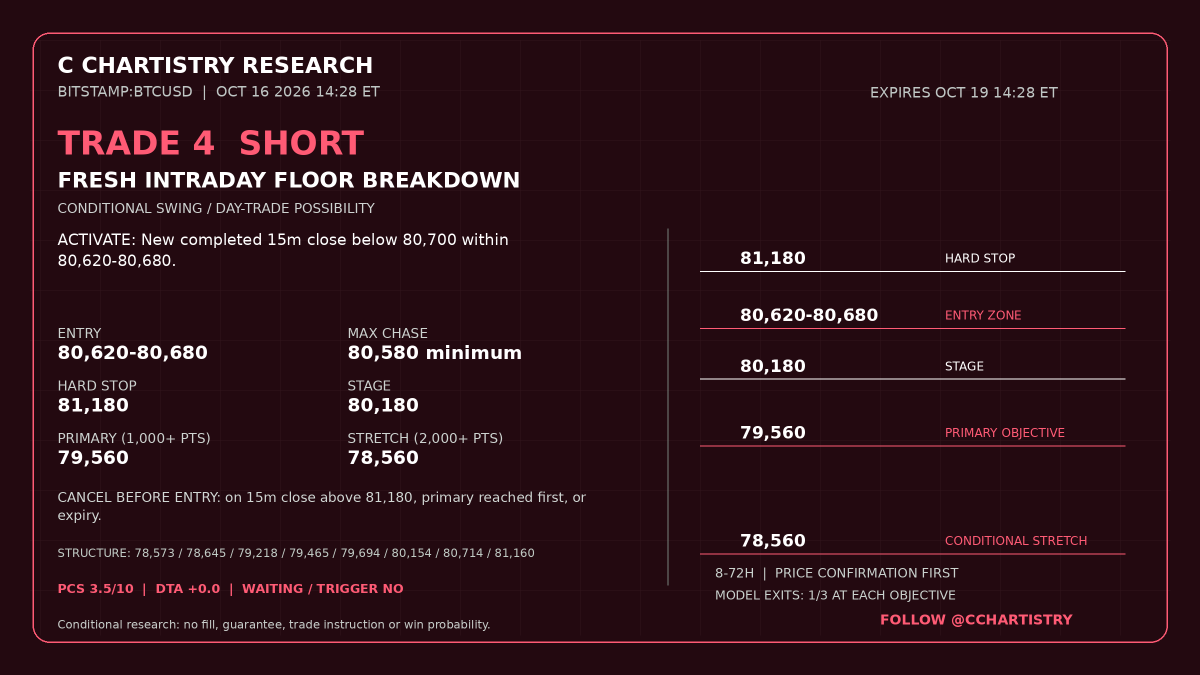
My conditional bias still favors failed recoveries while broken supply stays overhead. A sustained completed-candle reclaim would change that assessment; a clock turning alone would not. Two recovery paths and two downside paths are mapped on the cards, where the exact entry, stop, target and no-chase numbers belong.
Selected verified local timing highlights: the Oct 14 evening map's 1h trough at 21:00 matched the 22:00 source-bar low; its Oct 15 17:00 peak matched the 18:00 source-bar high. The complete original evening timing cohort passed 15 of 28 matured calls under the strict ±1 source-bar rule; 13 missed. Those local calls were useful, but they were not the main daily extremes. Timing accuracy does not establish price accuracy, profitable trades or certainty. The full audit stays in the private report.
48-hour timing watch (New York): 15m: peak Oct 16 16:15, trough Oct 17 01:30, peak Oct 17 04:15, trough Oct 17 09:15, peak Oct 17 16:15, trough Oct 18 02:30, peak Oct 18 04:30, trough Oct 18 10:15; 1h: peak Oct 17 00:00, trough Oct 18 03:00; 4h: no retained rolling center within 48h. All timing paths are weak/unvalidated and can conflict; clusters mark reaction windows, not automatic entries.
Same-type cluster watches, all weak/unvalidated: peak Oct 17 04:05-04:30 ET (2 source intervals); trough Oct 17 09:00-10:00 ET (2 source intervals); peak Oct 17 16:00-16:15 ET (2 source intervals); trough Oct 17 23:00-23:20 ET (2 source intervals); trough Oct 18 01:45-02:30 ET (2 source intervals); trough Oct 18 02:30-03:00 ET (2 source intervals); peak Oct 18 04:30-05:15 ET (2 source intervals). Related paths on the same interval count once; nearby opposing turns can weaken the read.
China Sunday-evening data and Monday Bank of Canada surveys are nearby calendar risks. Price must confirm the path; the cards carry the conditional boundaries. Cards show the original 14:28 cutoff state. Public confirmations must be new completed candles after this post; no earlier signal is replayed. Conditional swing/day-trade research, not fills, guarantees, trade instructions or win probabilities.
Follow @CChartistry for more.
#BTC #Crypto