somebody on the $MOBI board just went shopping 👀 director Casey Tansey bought 68,559 shares on aug 13, 14 and 17. about $797k . blended near $11.63. his direct stake jumped 29.38%, now 301,891 shares.
that's only about 0.206% of shares out. so this ain't some giant company event. it's one guy's wallet talking. and he paid up close to where it trades today, not at some dusty old price.
newly public. still losing money. he bought anyway. that's real conviction, not a promise. volume's gotta back it up. yall know what time it is!!!
this week's really just two questions wearing one costume 🥸
1) is the consumer still showin' up?
$HD, $LOW, $TGT, $WMT plus housing data answer that. watch traffic, transactions, margins. holding sales by discounting everything ain't the same as holding up.
2) will rates let stocks enjoy it?
20yr auction, fomc minutes, 30yr. soft demand and hawkish minutes push the long end higher, and pricey names get marked down quick.
good consumer + ugly yields is not a green light. friday's weak print only matters if these two agree with it. yall know what time it is!!!
$TLT
somebody's been quietly parked in the same $IWM downside zone for two weeks straight.
on friday somebody dropped $39k on sept 18 $289/$290 put spreads while price sat at $305. (a put spread is just buying one put and selling another at the same time. the sold one helps pay for the bought one. cheaper trade, smaller payout. pros do it every single day.)
⬇️ but here’s what really caught my attention ⬇️
aug 4 → $15,000 $287 puts
aug 7 → $32,000 $288/$291
aug 12 → $16,580 $286/$288
aug 13 → $24,000 $288/$289
friday → $39,000 $289/$290
same expiration. same $286–$291 pocket. again and again
$289 had only 1,037 contracts open, then traded 40,407. $290 already had 53,958 open, part of friday could just be someone sliding an old position to a new strike.
this ain't a sell signal, it's a zone big money keeps circling. watch $295 and $292 on the way down. that's where it gets interesting. yall know what time it is!!!
$IREN traded about 9.2m shares off exchange in two days. 4.42m at $44.06 on 8/14, then 4.8m at $44.76 on 8/13. roughly $410 million. every one of them shares had a seller too.
but here's the interesting part, options are stacked in that same low-to-mid $40’s pocket. GEX has $44 as the pivot, $45 as the heavy strike. short interest around 26.2%. and price walked right back into the zone.
five different clues, same address. that's worth watching 👀
⬇️ the levels i’m watching ⬇️
• close above $45 with real volume and hold that shelf, old supply becomes support and those shorts get itchy.
• lose $44.02 and the bull story gets thin.
• under $43.67 you ain't in the zone anymore, you're under it.
watch the reaction, not the print. yall know what time it is!!!
$SGML flow looks like a whale until you check the receipts. friday, the 9/18 $12 call traded 3,182 contracts. prior open interest? 150. that's 21x turnover in one session. 77.8% of it hit the ask. only 19.3% on the bid. $352k premium.
and one print at 8:31am (texas time) went 239 lots at $1.10 into a $1.05 x $1.10 market. that's a buyer paying up. no hiding it.
so folks see that and starts yelling whale alert.
open interest only finished +188. that's 5.9% of the volume 🧐. position got built, sure, but most of that tape was churn and folks closing out. real bullish participation ain't the same thing as 3,182 brand new longs.
stock closed $11.99. strike was 0.08% out of the money. that's near the money, not a lotto ticket. earnings already came 8/14. $54.7M rev, -$0.02 EPS. catalyst is behind us.
so it's continuation or it's nothing.
📊 confirm: 15-min close above $12.14
❌ invalidate: daily close under $10.99
a wick don't count. watch the close. yall know what time it is!!!
somebody dropped $147,085 on $PGR puts friday morning and folks didn't even blink
one print. 1,279 contracts at $1.15 on the $202.50 put expiring aug 21. that single trade was 91.75% of the entire day's volume in that contract. total volume 1,394 against only 135 open interest. that's 10x the existing position sitting there.
and they didn't sneak in. 93% of the flow hit ask-side. market was $0.55 bid, $1.45 ask. they paid $1.15. that's over the middle. that's somebody who wanted filled, not somebody fishing.
trade hit friday. PGR reports july results wednesday. option expires friday. it lives right through the news.
but don't just go off buying puts. we still don't know if this opened something new or closed something old. the next open interest print answers it. 135 → 1,300+ means fresh money. barely moves and somebody was just tidying up.
price closed friday at $209.60.
$207.01 is your line. 15 min close under it, chart and flow finally shake hands. then $203.80 → $203.11 → $203.08 → $202.50.
15 min close back above $212.73 and this whole idea is cooked. flow's a clue. price is the verdict. watch the level. yall know what time it is!!!
2,500 $WDAY aug 21, $195 puts hit the tape and the timeline lost its mind "somebody's betting on a crash!"
✅ 94% printed at the bid
✅ 89% were sweeps
that's not fear buying protection. that's somebody selling puts in a hurry and collecting the check 👀
they sold around $3. $195 strike – $3 = $192 breakeven. so the line ain't $195. it's $192. and WDAY had just tagged $195.01. they planted that flag right on the low
selling puts can also just be dumping fat IV or trimming a bigger position somewhere else. the full tape was mixed, not screaming bullish.
⬇️ so watch monday's open interest ⬇️
oi jumps = fresh short put position and $192 means something
oi flat = old business, nothing to see
volume shows the noise. open interest shows the commitment. yall know what time it is!!!
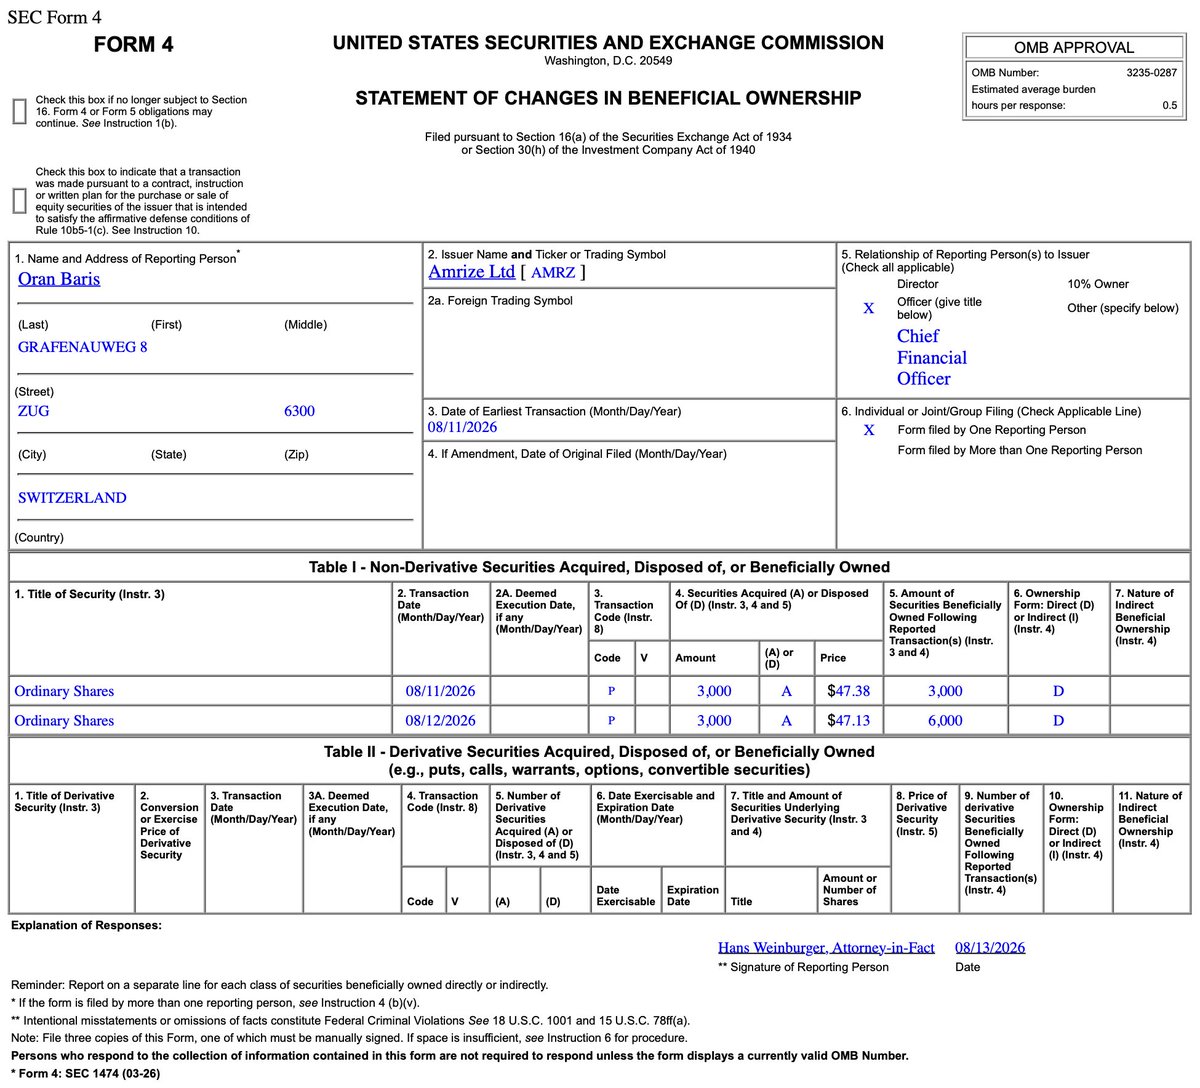
five $AMRZ insiders just went shopping. code-p buys, about $838,852 total
Baris Oran —> $283,530
Stephen Clark —> $248,850.60
Mario Gross —> $166,251.84
Jaime Hill —> $70,680
Roald Brouwer —> $69,540
no trading plans attached. nobody scheduled this. they just bought. retail waits on a headline. these folks already opened the wallet. volume's gotta back it up though. watch that. yall know what time it is!!!
$SMCI on my radar and the chart's telling a story.
post-earnings it ripped 19% on 4.5x volume and held $32.59. textbook. then it walked into $40–$42 and just stalled. big volume, tiny progress. like flooring the gas pedal with the trailer brake still on. somebody up there is selling every bid
tagging $42 ain't a breakout. 😂 a daily close over $42.31, ideally 45.9m shares or two closes in a row. that's acceptance.
get it → $43.55–$44.95
then $46.90–$51.40
close under $37.61 → the whole move's in trouble.
yall know what time it is!!!
big week on deck
$FN —> mon after close
$HD —> tue 8am (texas time)
$TGT —> wed 7am
$WMT + $DE —> thu
folks gonna stare at beat or miss, that's the shallow read. guidance is the tell.
WMT tells you how the shopper feels. FN tells you if ai spending is still cookin. gap up ain’t an invite. it’s usually the trap. yall know what time it is!!!
$BABA $LOW $TJX $ADI $AMAT
$RDNT beat earnings, raised guidance, and traded 2.29x its normal volume. then it went flat. four days stuck between $76.34 and $77.31 while volume dried up
folks see flat and think "boring", but flat after a big run isn't weakness. it means nobody's dumping. sellers had their shot and didn't take it
$77.35 is the line. that's the roof it keeps bumping into. close above it and the measured move points to $82.30, then $87.20
close below $75.90 and the idea's dead. no argument
a quick spike over $77.35 that falls right back? that's the trap, not the trade. wait for the close. yall know what time it is!!!
everybody wrote $ACI off after the july 23 guidance cut. down 20%+ in one day, new low at $10.86. folks sees a broken grocery stock. i see two straight weeks of higher lows, insiders loading, and blackrock adding 14% more shares while retail was hitting the sell button
so here's my plan for monday:
small starter if it holds $11.90–12.05
bigger add only if an hour candle closes above $12.17–12.20
no buying green candles into resistance just because they're green
if it loses $11.30 with volume on the hourly, i'm out. daily close under $10.86 and the whole idea's dead. no hero adds
earnings 10/13. the $600m kroger trial 10/19. i want my spot before the crowd shows up. yall know what time it is!!!
$TNC insiders stepped up. two buys, $640,990 combined.
Donal Mulligan grabbed 8,000 at $67.34, held indirectly through a trust for his spouse.
Tim Morse took 1,500 direct at $68.18.
no 10b5-1 plan on either one. somebody sat down and chose to buy. watch what price does around those levels 👀 yall know what time it is!!!
a director just backed up the truck on $DFH
richard beckwitt bought 90,000 shares outright aug 11–13 for about $1.26m . 70k at $13.95, 8k at $13.83, 12k at $14.80. no 10b5-1 plan on it, meaning that wasn't autopilot, that was a decision.
folks sees a homebuilder chart nobody wants. insiders paying up into strength tells a different story. watch if that $14.80 area holds. yall know what time it is!!!
reading the $TSN news tonight and I already know how this plays out 📉 they’re shutting down two beef plants, trying to sell another, and squeezing production into three central u.s. plants
you don't do that from strength. you do it when cattle are scarce, cattle cost a fortune, and your plants are running half empty while payroll still hits
news dropped today at 3:30pm (texas time), after the bell. stock closed up about 1%, so nobody's actually voted yet
fuller plants later, severance and restructuring charges first. beef operating income and cattle harvested next earnings. that's the tell. yall know what time it is!!!
stop staring at ai charts while the bond market's holding the steering wheel
here's the next 4 trading days:
wednesday 7:30am (texas time) —> july CPI drops. same day, treasury sells $42b in 10-year notes.
thursday —> PPI, then a $25b 30-year auction.
friday —> retail sales, plus the q2 13f deadline (those holdings are from june 30, not today).
monday —> $67b of that supply settles at once
folks are trading the headline. the tape's trading one number, the 10-year yield.
above 4.60% at the close and pricey AI names feel it. future profits worth less, borrowing costs more, and boring treasuries start stealing the bid.
on flip side if core CPI 0.2% or less, both auctions eat clean, credit stays calm, 10-year closes back under 4.60% yield story's dead for two weeks. Buy the pullback, quit prayin' for the crash.
watch the close. the intraday dip lies. yall know what time it is!!!
$TLT $QQQ $PLTR $HD
a couple names lit the tape up friday and folks already stamping them breakouts.
$TTWO $246.50 close, +6% on 2.14x volume. bookings $1.39b, slight beat, fy27 guide held at $8.0–8.2b, GTA VI still november 19. pretty story til you flip the page —> bookings down 3% y/y, GAAP loss widened to $34.1m . that ain't a green light.
$247.80 with a 15 min close above it is.
lose $239.90 and the idea's dead
$FROG +7.8% on double volume. rev +29% to $163.8m, cloud +53%, NDR 121%. then it faded off $98.99 into the close. buying that gap monday is just funding somebody else's exit.
i want $84.90–$86.20 and a reclaim, not a chase.
under $82.75 there's nothing to talk about.
neither one is live yet. CPI wednesday, PPI thursday. friday drew the map. monday's gotta walk it. yall know what time it is!!!
$RBLX $U $DDOG
monday might feel loud, but that ain't the test. this week really lands on wednesday and thursday imo
wednesday —> CPI (inflation report) 7:30am (texas time), then the government sells $42b in 10-year bonds at noon.
thursday —> PPI 7:30am, then $25b in 30-year bonds at noon.
four windows. two days. that’s your whole week right there
folks still glowing off that 7% tech run and the soft jobs "fed's done hiking" story. meanwhile the 10-year yield sits at 4.65% and VIX is asleep at $14.90. that’s your trap —> if inflation runs hot, or buyers don't show up for those bond sales, long-term rates push higher. $XLK feels that first, every time
cool numbers plus strong buyers? bulls keep rolling. 📈
monday don’t write the story. yall know what time it is!!!
$QQQ $SPY $TLT