Microsoft unit economics
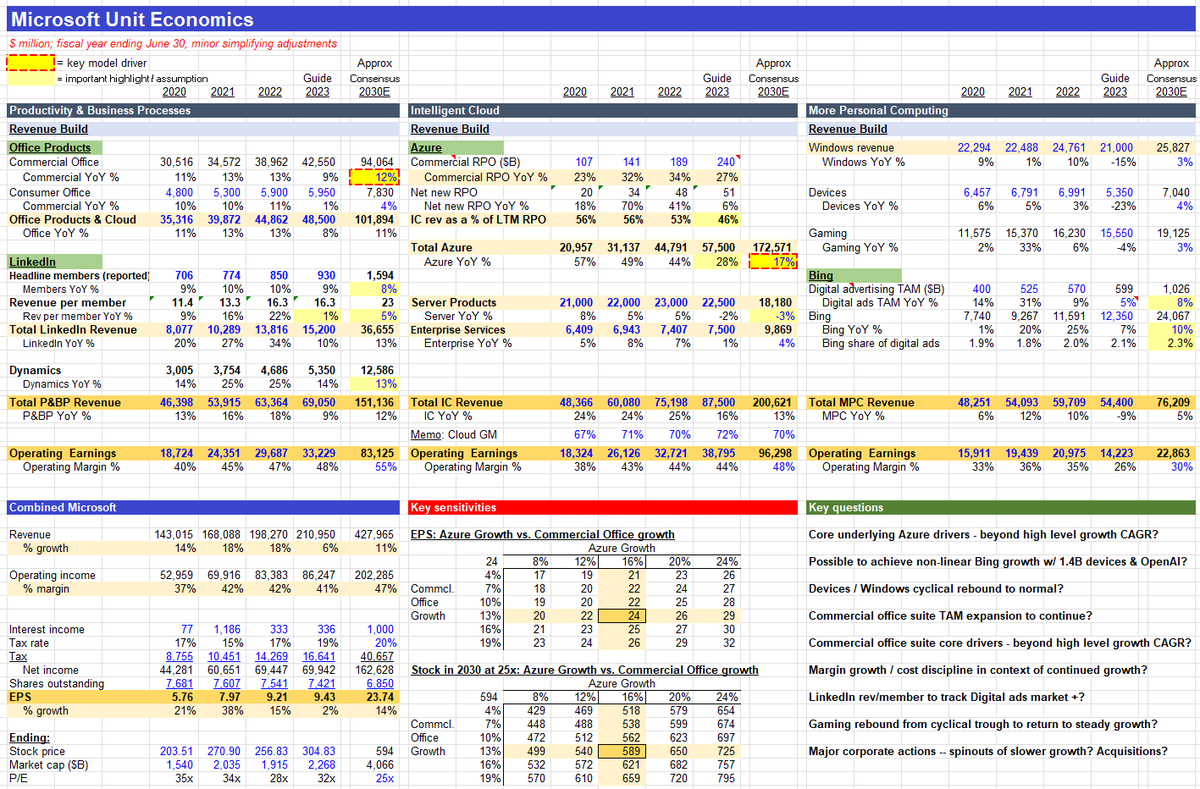
Explains enterprise tech on 1 page.
Like & comment if you want the excel
8 points:
*1) 3 segments*
Business Process: Office, LinkedIn
Intelligent Cloud: Azure
Personal Computing: Windows, Bing, Xbox
*2) Numbers*
Guided EPS this year in the $9.5/share range, on a $300 stock.
A ~32x P/E multiple.
In range of its avg multiple 25-35x.
Expectations for 2030 implies that EPS number.
Climbs to ~$25/share.
Driven primarily by:
Azure cloud growth
Commercial office seats
*3) Sensitivities*
The key sensitivities show EPS and stock price at 2030.
Varying by Azure growth,
And Commercial Office growth.
Simplifying:
A 10% delta in Azure growth rate, or
A 10% delta in Commercial Office growth,
Equals about ~$100/share of stock value each.
Everything else is much less impactful.
*4) Azure*
Microsoft's hyperscale public cloud.
Competitive to AWS, GCP, and a handful of smaller names (IBM, Alibaba, Oracle, Tencent).
Drivers are cloud adoption,
And Azure's competitive positioning vs. primarily AWS & GCP.
Something like ~1/3 of enterprise workloads are completed in the public cloud.
Which should continue to grow steadily over time.
Implying solid runway for further enterprise cloud penetration.
Shorter term.
The company saw solid deceleration of cloud growth. And underearned relative to its LTM commercial Remaining Performance Obligation (RPO).
Which has seen reacceleration, and looks to be lapping cost optimization trends.
As OpenAI exposure adds leverage to the base.
*5) Commercial Office*
Consumer is slower growth.
But commercial office continues to expand.
Both seats and price per seat.
As enterprise penetration of Office grows globally.
Expectations are for commercial office to grow steadily ~10%+
Off a very high base.
To gain more conviction, you would
Disaggregating seats vs. price.
And geographical penetration curves.
*6) LinkedIn*
Headline members continues to grow 9-10% per year.
While '23 revenue per member decelerated from mid-teens CAGR.
To ~flat this year.
Along with global digital adspend.
Over time, member growth & revenue opportunity combined,
Should solidly outpace digital ads TAM growth.
*7) Bing*
Highest ratio of potential impact
To today's actual.
~6% of revenue ($12B).
But with AI integration, 1.4 billion connected devices,
and a ~$600B digital ad TAM.
Microsoft is attacking search,
With the premise of non-linear upside.
*8) Devices & Gaming*
Devices, Windows, & Gaming have all gone through a cycle.
And appear to be rebounding/
But to overall Microsoft
Each is less impactful to the outcome.
Ultimately, the math is Azure and Commercial Office.
And then Bing, LinkedIn, and margins.
And for each, as always
The key is to break apart components,
Appreciate the nuances,
And spend focus proportionate to actual impact.
Not to yesterday’s headlines.
That's all for now.
Like & comment if you want the excel.
Q1 revenue growth:
Meta +2.6%
Google +2.6%
Netflix +3.7%
Microsoft+7.1%
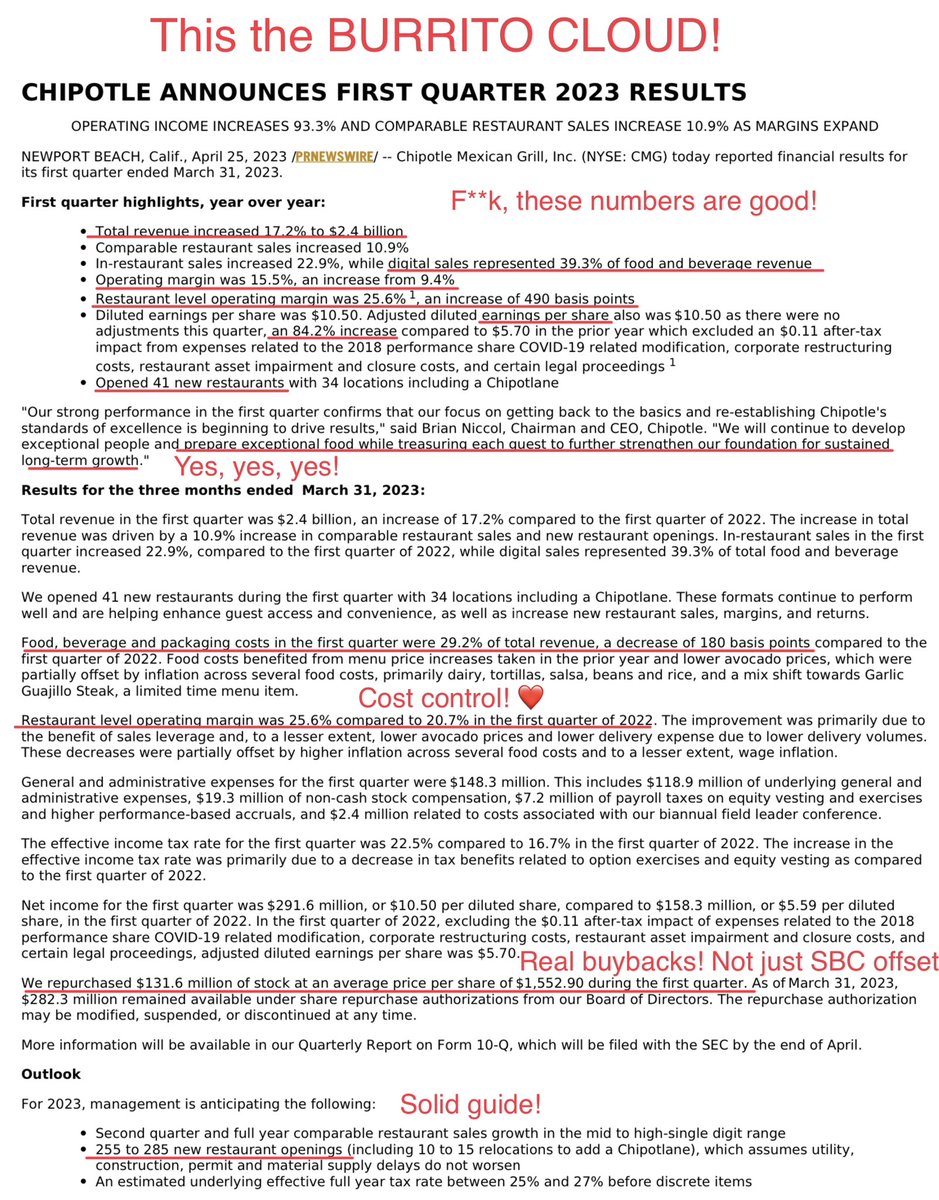
Chipotle +17.2%
Carlsberg +14.2%
PepsiCo 14.3% (organic)
McDonald’s +12.6% (comp sales)
Looks like we may need to rebrand Burritos, Beer, Doritos and Big Macs as “Food-As-A-Service”
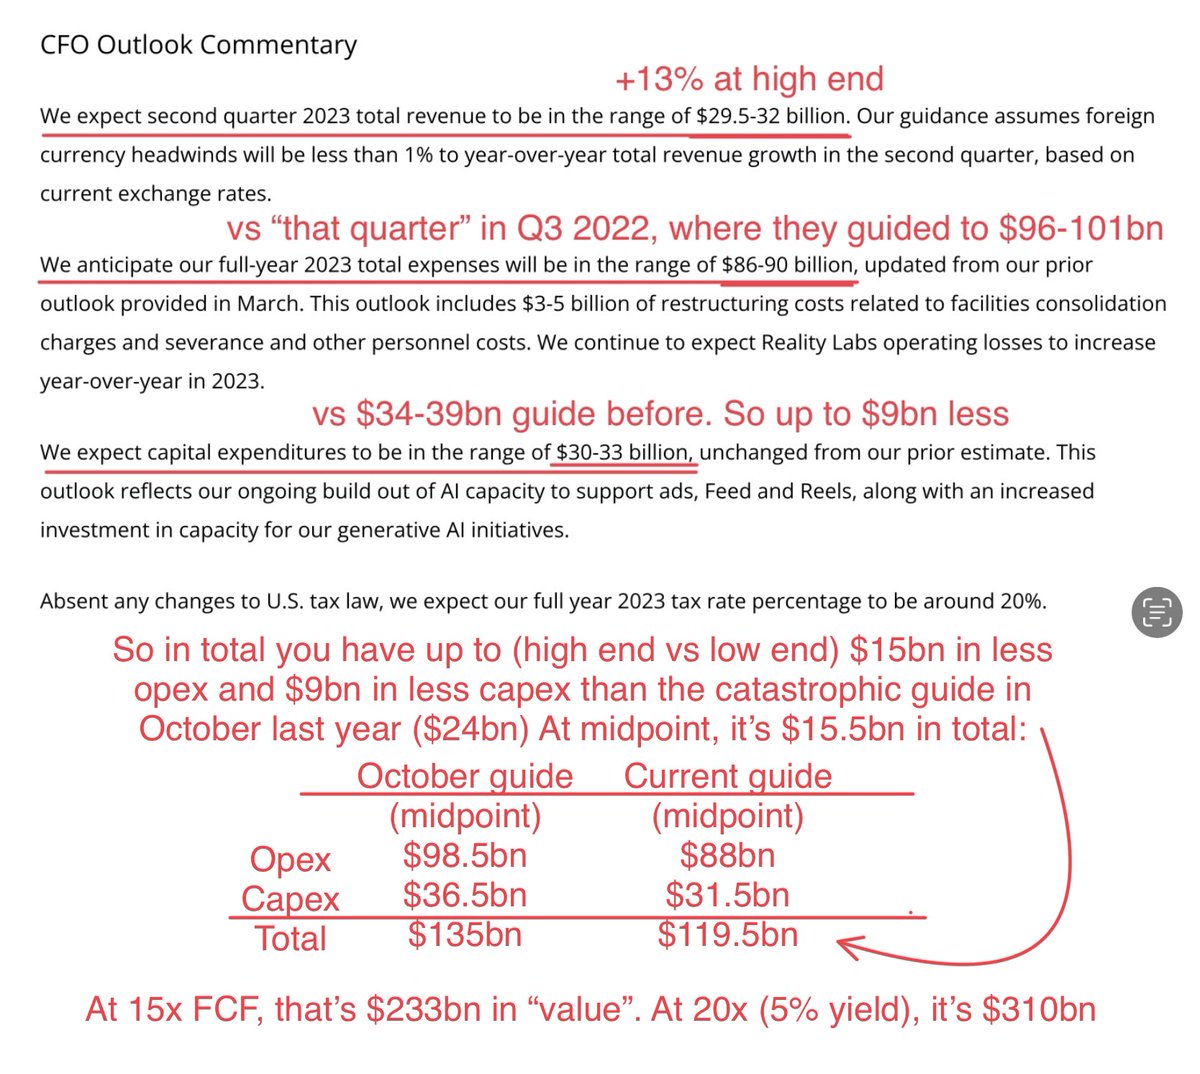
$META While results were pretty sh*t (unless +2.6% growth & -15% EBIT makes you 💦), it’s ALL in the strong guidance: +13% Q2 growth at the high end, and further dramatic cut in ‘23 opex, at $86bn (low end). In October, they guided for up to $101bn, so up to a $15bn diff! 🍌
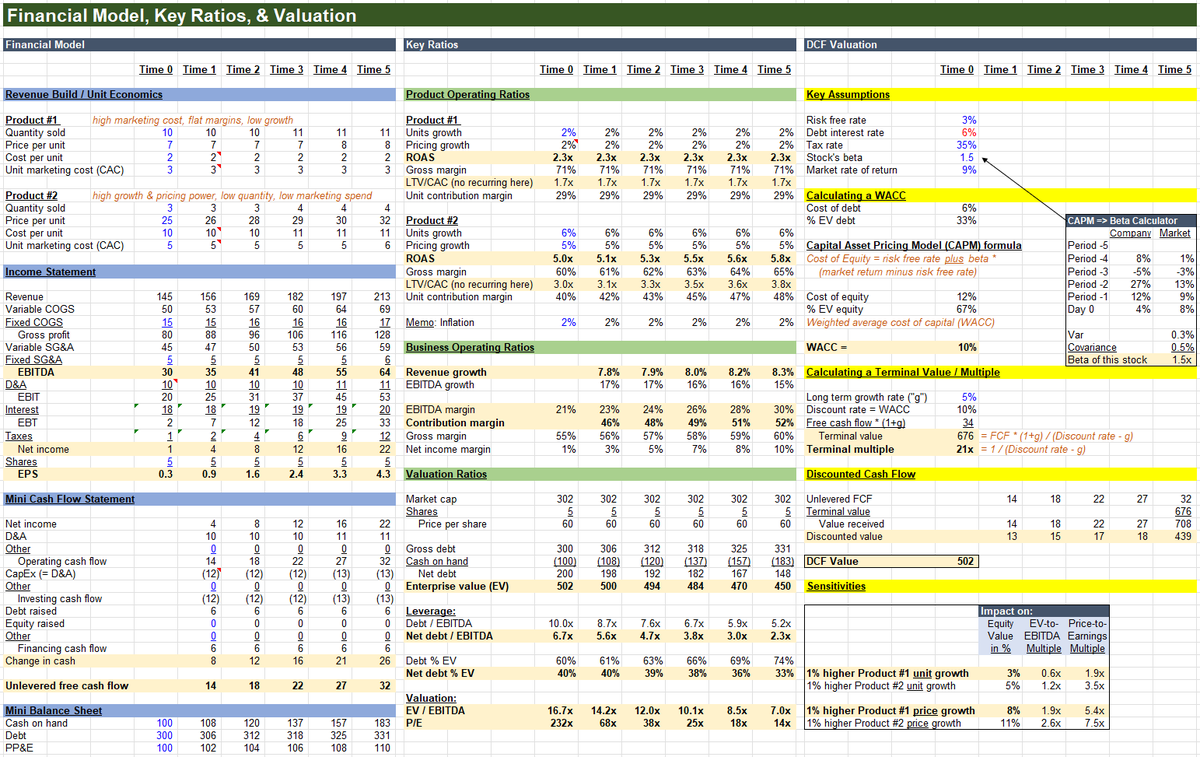
An entire MBA fits on one page.
But you better know the math cold.
Like & comment if you want the excel.
6 topics:
*1) Unit economics*
This builds from product-level unit economics to company financials.
Quantity per unit, growth in units.
Price per unit, growth in pricing.
Cost per unit, marketing spend per unit.
Get you return on ad spend (ROAS), customer acquisition cost (CAC), LTV/CAC, gross margins, unit contribution margins, and more.
This model sets up two diverging products:
A higher gross margin (GM), higher marking cost, low pricing power, low growth product.
Against a lower GM, better pricing power, better growing, lower unit market cost product.
To show how the dynamics of the two play out over time.
*2) Accounting*
Unit drivers flow into revenue, variable COGS, and variable SG&A.
Then to EBITDA, EBIT, EBT, Net income & EPS.
Simple cash flow statements & balance sheets reconcile D&A to inflation-adjusted replacement CapEx, debt levels, & GAAP PP&E.
You have to be fluent in accounting to look at public companies.
Not because accounting itself matters.
But because accounting can obscure what matters.
And your task it to translate GAAP into meaningful business logic.
*3) Operating ratios*
Unit drivers output financials, financials output overall business ratios.
Revenue growth, EBITDA growth, EBITDA margins.
Contribution margins (= change in profit over change in revenue).
Net debt-to-EBITDA, net debt % of EV.
*4) Valuation*
You can drive valuation on multiples or a DCF.
Which are equivalent:
The discount rate minus the growth rate determines the 'terminal multiple.'
Using a P/E instead of a DCF simply uses next year as the terminal value.
This model drives value from the DCF, and maps that to the multiples to show how they connect.
*5) Corporate finance & DCFs*
DCF math attached using the CAPM.
The summary is a beta from historical returns, add the cost of debt.
To get the WACC - the theoretically correct discount rate.
DCFs are extremely assumption laden - you can get out almost whatever you want.
But realistically.
Your banker (or analyst) will make the math work out to a 7-13% discount rate.
Depending on the risks, industry, markets - and what they want to achieve.
*6) Sensitivities & the hard part*
The last section sensitizes the equity value and multiples to unit and price growth.
Bringing unit drivers full circle to valuation outcomes.
Ultimately, the hard part isn't the math.
You have to be fluent in the math, its nuances and its limitations.
If not, you will lose out to those who are.
But once you are, you also have to shift focus.
To the hard part.
Which is always in filling in the numbers.
If you're investing, that means thoughtful views on unit drivers; on how, when, and why they shift.
And if you're building, it means making the numbers on the page happen.
That's all for now.
Like & comment if you want the excel.