Oil, the pricing out of risk is telling, and can lead to a very short term (3-7 day) bounce with good EV.
1-2 down days to go, trade potential: Thursday/Friday
$USO $CL
$LNG - not a mechanical setup (no new low), but the tell is interesting.
Gapped down Monday on the deal, closed back near flat on the highest volume since June 4. War premium deflates, but the Qatar rebuild floor survives the deal.
Someone's buying that structural angle...
The US-Iran framework is done - signing June 19, Hormuz reopens, blockade ends. Brent -4%, WTI to March lows.
This flips the trade from war-premium to deal-confirmation. Watching 3 energy names into the unwind.
Here's the data 🧵
$CVX - same regime, weaker hand.
Down -7.75% in 3 bars. Coin-flip day 1 (49%), only reaches 64-67% at 3wk-1.5mo. 20SMA extension tops out 66% at 1 month.
Shallower drawdown, purer crude, less cushion. If I take one major, it's XOM over CVX on the data.
Spent the weekend running my MR screen across a 9-name tech watchlist.
Goal: find the cleanest drawdown mean-reversion setups for next week. Most got cut.
Three made it. Here's the work and where I'm putting risk 🧵
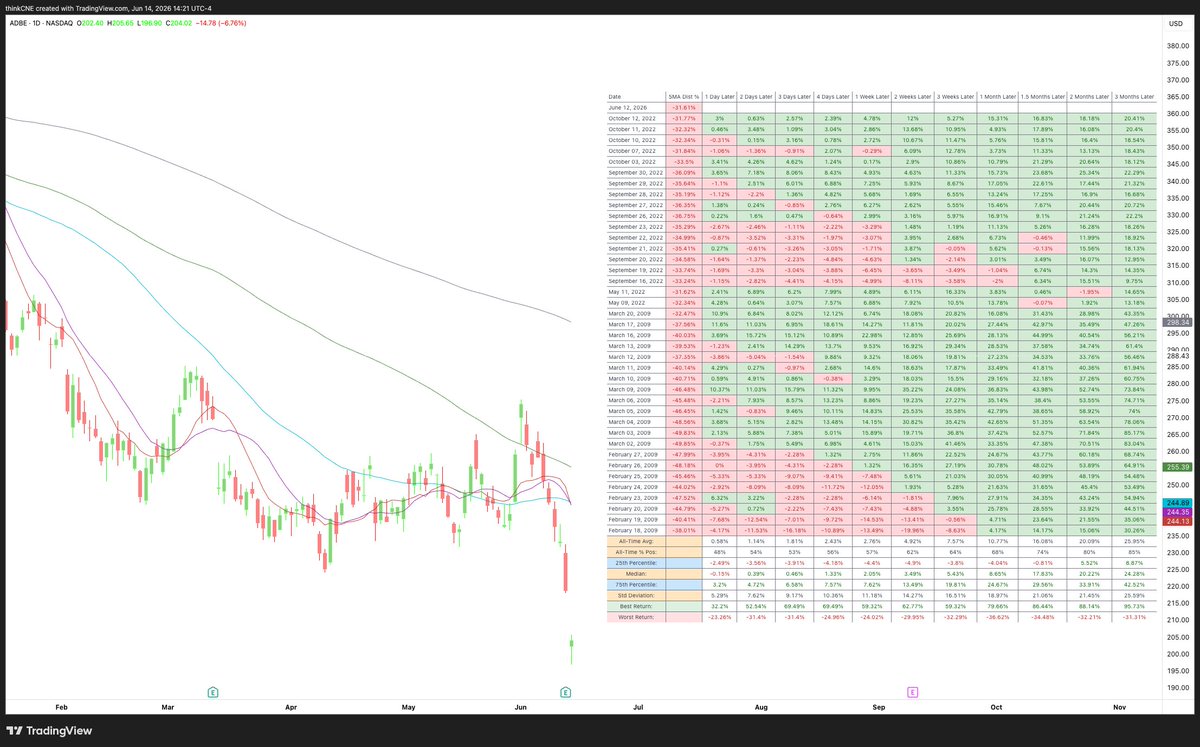
$ADBE is the interesting one. Beat-and-raise - rev +13%, AI ARR tripled past $500M - and the stock made a NEW 52w low anyway, sold purely on the CFO exit. Fundamentals accelerating into a capitulation low on a governance headline.
Finding it hard to stay active on here, will try and post once per day at a minimum with stocks im PLANNING to trade and WHY.
Will scan later today, active positions consist of $AEM (Gold), $ACN, $UBER, and $T
Thanks,
Will
Existing positions: $T and $LNG
Today, i'm looking to long $GOLD (miner exposure), $MSFT, $UBER.
Thesis will be posted across the weekend for each ticker/trade. Below is the data collected for $MSFT.
Too much volatility. We got stopped out of all our stocks today and are only holding 2 index longs: . Looking back a week from today it may easily have been capitulation today but we will see. The undercut of Friday's lows created a cascade of selling. The memory, semiconductor and optical stocks will need days or weeks to set up valid pivots. Normal bases will take 5-7 weeks.
$QQQ dropped 4.8% on Friday. Worst day in over a year.
So I pulled every 4% down day in $QQQ since inception. There were 125 instances and they occur less than 2% of the time.
Look where they cluster though. 32 in 2000. 30 in 2001. 17 in 2008.
A -4% day is mostly a bear market event.
So what does one mean inside a bull?
Trust this helps - im looking at CPI wed print to be the tell.
And FYI, all research was undertaken by use of custom data pulling indicator (Pinescript), the above was written by Claude post me integrating it with said. data.
A LOT OF TALK ON $BTC $ETH $MSTR etc.
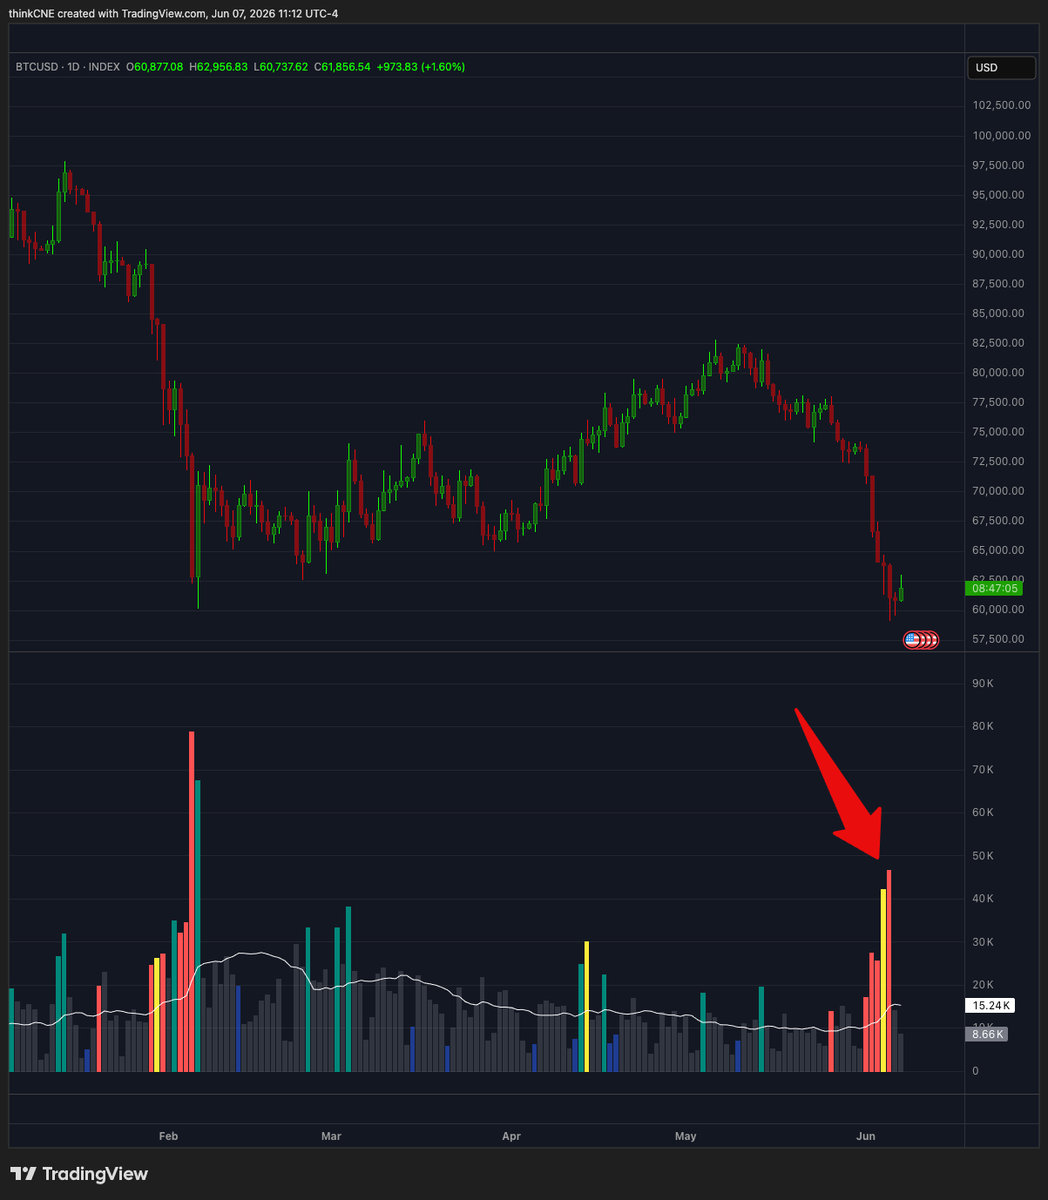
BTC -20% in 4 days.
ETH -23%.
MSTR getting tagged.
Everyone's screaming "bottom." I ran the data across all 3.
They don't bottom together. Here's the sequence nobody's pricing...
🧵
The volume tell:
BTC + ETH had RISING volume INTO the lows (June 1→5). That's cascade, not exhaustion.
Then the weekend: BTC held Fri low, volume receded, reclaimed pday high.
But it's thin weekend tape. The 13-day ETF outflow streak resumes Monday. That's the real test.