Everyone watches the Nifty. Few watch the *IPO market*
Yet, IPOs are one of the purest indicators of liquidity, sentiment, and risk appetite in the system.
A strong IPO cycle tells you everything you need to know:
* 💰 **Liquidity** is abundant
* 🚀 **Retail confidence** is rising
* 🏦 **Institutions** are eager to deploy capital
* 📈 **Risk appetite** is moving higher
When the IPO market is roaring, it’s a green light for market psychology. When it dries up, take note.
That's why I'm closely tracking the upcoming pipeline of 20+ companies preparing to hit the market, including:
* Rentomojo
* SBI Funds Management
* AGS Health
* Jindal Supreme
* PGP Glass
* Dhoot Transmission
* WOG Technologies
* Core4 Engineers
But the real signal isn't just the launch, It’s the data behind it:
* The QIB & HNI participation
* The subscription multipliers
* The listing day gains
New supply rarely rushes in when fear is high. It arrives when confidence is booming and promoters see the perfect window to monetize at attractive valuations.
The IPO market often reveals far more about actual investor psychology than daily stock prices ever will.
What message do you think this upcoming IPO wave is sending us?
#StockMarketIndia #IPOs #Nifty50 #Investing #IndianStockMarket #MarketSentiment #SpaceX #jio
Market literacy is understanding that price is just a lagging indicator of capital flows.
To navigate asymmetric risk, you have to understand the three layers of market awareness:
Layer 1: Price (Retail). Purely psychological, highly volatile, and easily manipulated.
Layer 2: Narrative (Media). The post-hoc rationalization of price action. It tells you why something happened after it already did.
Layer 3: Liquidity (Institutions). The underlying monetary plumbing. Central bank balance sheets, credit cycles, and institutional order flow.
The crowd fights over Layers 1 and 2. The smart money commands Layer 3.
#priceaction #liquidity #nifty #stockmarket
I'd rather see India optimize for more tourists than more revenue per tourist.
Every additional visitor brings forex, spends on hotels, food, transport, shopping, and creates jobs. If lower ticket prices help attract more visitors, the overall economic gain can be much larger than a higher entry fee.
Tourism is one sector where volume matters.
Be it BS6 or E20, the higher costs, lower mileage, reduced performance, and for some of us, even breakdowns.
Maybe the long-term benefits are real and for the greater good of the nation. But it's interesting how the benefits are always promised at a national level, while the costs show up immediately in our wallets and garages.
The consumer remains the easiest stakeholder to bill for every transition, and perhaps the most overlooked collateral damage.
@CryptKeeper_06 Maybe. But markets react to the headline, not the footnotes. Narratives move flows.
A strong jobs number was enough to push yields higher and rate-cut expectations lower. The debate about job quality comes after the repricing.
Why did Gold crash after the strong U.S. Jobs Report?
The market is starting to price out near-term Fed rate cuts, and some participants are even discussing the possibility of rate hikes returning to the narrative in 2026.
Higher rates = Higher bond yields = More pressure on non-yielding assets like Gold.
But there's more to the story 👇
What about India?
A higher-for-longer U.S. rate environment is generally not ideal for emerging markets as India.
• Foreign investors tend to prefer U.S. bonds when yields rise.
• FII flows into Indian equities can slow or reverse.
• INR may face depreciation pressure against the Dollar.
• Rate-sensitive sectors can see volatility.
However, India's strong domestic growth story, robust SIP flows, and improving earnings outlook continue to provide a cushion against global headwinds.
So while global liquidity may tighten, Indian markets are unlikely to move in lockstep with the U.S. The key risk is sustained high U.S. yields leading to prolonged FII outflows.
The market to watch right now isn't Gold or Nifty.
It's the U.S. 10-Year Treasury Yield.
That remains the most important price in global finance and often dictates the direction of equities, bonds, Gold, Silver, currencies, and capital flows across the world.
The latest U.S. jobs data suggests the economy remains stronger than expected, reducing the need for aggressive Fed rate cuts.
As rate-cut expectations fade, Treasury yields move higher and bonds become more attractive relative to risk assets.
This triggers a capital rotation:
• Money flows from equities and speculative assets into fixed income.
• Higher real yields increase the opportunity cost of holding Gold.
• Investors liquidate part of their precious metals exposure and shift toward yield-generating assets.
That's one of the key reasons Gold saw a sharp decline.
Gold is a non-yielding asset. Historically, rising real yields and hawkish Fed expectations have been among the biggest headwinds for the metal.
An important technical signal: Gold is now trading below its 200-DMA for the first time since 2023, a level closely watched by institutional investors.
Silver is often impacted even more than Gold because it is both a precious metal and an industrial commodity. Slower growth expectations combined with rising yields can create additional volatility in Silver.
Macro relationships worth remembering:
📈 Bond Yields ↑ → Gold & Silver ↓
📈 Real Yields ↑ → Precious Metals ↓
📉 Rate Cut Expectations ↑ → Gold ↑
📉 Bond Yields ↓ → Gold ↑
⚠️ Economic Slowdown/Recession → Bonds & Gold tend to outperform
The key metric to watch now is real yields. If they continue rising, pressure on Gold, Silver and risk assets may persist. If growth weakens and the market starts pricing rate cuts again, precious metals could quickly regain momentum.
Markets don't react to today's rates. They react to where rates are expected to go next.
2.2
THE CATALYST:
Near-term distribution in institutional cement blocks has driven severe mechanical liquidations across core large-caps. While short-term retail participants panic over immediate price breakdown channels, disciplined capital structures are focused entirely on absolute horizontal geometry where macro trends historically bottom.
THE INTERESTING PART?
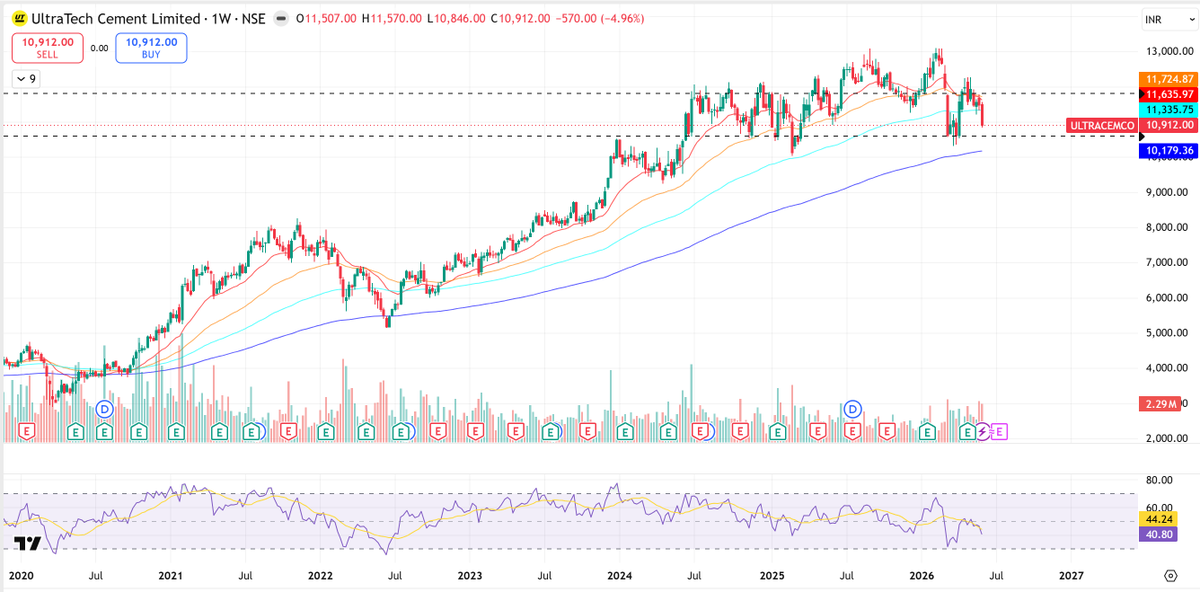
Look closely at the actual horizontal price structure across the Daily chart and Weekly chart. Instead of blindly chasing lagging momentum line indicators, focus on prior historical reversal footprints. UltraTech Cement is directly falling back into a highly critical structural confluence channel. We have a heavy horizontal demand ceiling-turned-floor stretching between ₹10,600.00 and ₹10,800.00 that has consistently validated deep institutional accumulation over the multi-year cycle. From a Risk-to-Reward (R:R) perspective, initiating exposure directly inside this horizontal pocket allows you to operate with tight invalidation parameters placed right beneath the key structural lows, offering a stellar mathematical edge back toward the major supply breakdown flips.
MEANWHILE:
• The 1-Hour chart reveals that the near-vertical capitulation is entering a state of severe tactical exhaustion, stalling out tightly right as it meets the local horizontal buffer lines.
• Dynamic overhead resistance paths are clearly mapped out at the hourly structural pivot bands starting at ₹11,012.10, before encountering heavy weekly moving average block resistance stretching from ₹11,335.75 up to ₹11,635.97.
• The 1-Hour RSI is hovering deeply compressed in oversold territory at 27.89, while the Daily RSI registers a depressed 33.49, signaling an extreme technical deviation that heavily increases the probability of a sharp technical short-squeeze bounce.
MY PLAYBOOK:
• Actively building an accumulation framework around this macro structural floor, treating late retail fear as a high-probability asymmetric window to establish long-term technical positions.
• Structuring potential long swing configurations tightly within the ₹10,600–₹10,800 support corridor, running hard trade invalidation closes directly underneath the key structural weekly marker at ₹10,150.
• A clear daily and weekly closing breakdown below the macro Weekly 100 EMA invalidates the immediate reversal setup, signaling a deeper cyclical correction down toward legacy historical baselines.
Big moves rarely begin when sentiment feels comfortable.
They lock in when major trend lines offer maximum technical clarity, transferring wealth from the emotional chasers to the patient allocators.
DYOR.
Not a recommendation.
#ULTRACEMCO #UltraTechCement #TechnicalAnalysis #PriceAction #Nifty #SwingTrading #ValueInvesting (2/2
🧵1/2
The infrastructure pack never changes. People panicked and dumped #ULTRACEMCO between late March and early April when it aggressively flushed down to test the ₹10,325 structural lows.
Now, after a sharp relief recovery completely stalled out, the crowd is panicking all over again as the price slides heavily back down to ₹10,912.00.
Same stock.
Different phases.
That's why a short-term breakdown line is exactly where things get interesting.
What's fueling the caution?
• Re-testing intermediate breakdown levels after a weak recovery
• Short-term momentum chasers trapped by the sudden structural fade
• High-volume sector rotation pressing down near-term valuations
But here's the question nobody is asking:
If the heavy institutional accumulation from the April floor proved how much smart money wants this asset, why ignore the high Risk-to-Reward (R:R) entry forming right above it?
KEY TECHNICAL LEVELS TO WATCH:
• Support Zone 1: ₹10,600.00–₹10,800.00 (Major Historical Pivot Reversal Base)
• Support Zone 2: ₹10,179.36 (Weekly 100 EMA / Generational Double-Bottom Floor)
• Current Value Zone: ₹10,912.00
• Resistance Zone 1: ₹11,335.75–₹11,635.97 (Prior Support Turned Structural Supply Range)
• Resistance Zone 2: ₹11,800.00–₹12,000+ (Macro Consolidation Breakdown Ceiling)
The short-term velocity has cleanly broken down.
The long-term structural value thesis is getting incredibly attractive.
And that's where mathematics favors the patient trader.
#UltraTechCement #StockMarketIndia #TechnicalAnalysis #Nifty50 #NIFTY #INVESTING (1/2)
2/2
THE CATALYST:
Rapid mechanical de-leveraging is causing heavy near-term damage across precious metals. While panic takes over retail portfolios, smart money is looking past the headline volatility, eyeing a massive asymmetric recovery window as prices hit major macro structural demand clusters.
THE INTERESTING PART?
Look closely at the actual horizontal price geometry on the Daily chart. Instead of blindly following lagging indicators, look at the prior reversal history. Gold is directly descending into a crucial structural confluence. We have the clear horizontal base range sitting between $4,253.08 and $4,311.93, which acts as the immediate validation zone for the bulls. Just beneath that lies the absolute panic swing low printed back on March 23 at $4,099.125. From a Risk-to-Reward (R:R) perspective, initiating exposure within this explicit structural block provides an exceptional mathematical edge, letting you run invalidation stops tightly below the structural low while targeting a primary move back to the major breakdown flip zone starting at $4,519.062.
MEANWHILE:
• The 1-Hour chart reveals that the near-vertical capitulation is finally exhausting its momentum, consolidating tightly into a localized horizontal base range.
• Dynamic overhead resistance zones are explicitly mapped out at the hourly cluster starting at $4,391.12, before encountering the massive multi-day supply barriers spanning the $4,519.062, $4,762, and $4,872 levels.
• The 1-Hour RSI is hovering heavily depressed near 25.40, flashing an extreme oversold deviation that strongly supports a sudden, explosive short-squeeze bounce.
MY PLAYBOOK:
• Actively building an accumulation mindset around this structural floor, exploiting retail fear to map out high asymmetric, long-term technical long positions.
• Structuring active trade entries strictly within the $4,253–$4,311 block, placing hard invalidation stops right underneath the March panic anchor at $4,099.
• If the bears capture complete control and trigger a sustained daily closing breakdown beyond $4,099, the immediate long configuration invalidates, opening a direct path to patiently load lines within the primary macro support block between $3,709.09 and $3,886.
Big moves rarely begin when sentiment feels comfortable.
They lock in when major trend lines offer maximum technical clarity, transferring wealth from the emotional chasers to the patient allocators.
DYOR
Not a recommendation
#XAUUSD #GoldPrice #TechnicalAnalysis #gold #PriceAction #CommoditiesTrading #SwingTrading
(2/2)
1/2
🧵 The gold market never changes.
People couldn't get enough of #Gold when it was vertical, violently breaking out past $5,250 amidst relentless global macro accumulation.
Now they are panic-selling as paper liquidations force a sharp drop straight to $4,327.88.
Same asset.
Different emotions.
That’s why buying an overextended parabolic run-up is never a strategic move.
What's fueling the liquidation?
• Sudden global macro fund unwinding
• Intraday momentum chasers getting heavily trapped
• De-leveraging across major currency safe-havens
But here's the question nobody is asking:
If long-term macro banking demand and structural economic hedges are still accelerating, why ignore the massive asymmetric opportunity forming right at major price action support zones?
KEY TECHNICAL LEVELS TO WATCH:
• Support Zone 1: $4,253.08–$4,311.93 (Immediate Horizontal Floor Channel)
• Support Zone 2: $4,099.125 (March 23 Panic Swing Low Anchor)
• Current Value Zone: $4,327.88
• Resistance Zone 1: $4,391.12–$4,519.062 (Immediate Horizontal Pivot Range)
• Resistance Zone 2: $4,762.00–$4,872.00 (Upper Macro Supply Walls)
The short-term velocity has cleanly broken down.
The long-term structural value thesis is getting incredibly attractive.
And that's where things get interesting. Part 2: The high Risk-to-Reward (R:R) setups printing right at major technical boundaries.
#GoldCrash #XAUUSD #Trading #Commodities #gold (1/2)
🧵 2/2
The Catalyst: Silver is absorbing a brutal dual-channel macro shock. A significantly stronger-than-expected US jobs print has rapidly forced interest rate hike concerns back into global asset pricing, supercharging the Dollar and dumping non-yielding safe havens. Concurrently, escalating West Asia tensions after Hezbollah rejected mediated ceasefire terms are raising global economic slowdown fears, temporarily crippling the near-term industrial demand outlook for components in green-tech manufacturing.
The interesting part?
Look closely at the Daily chart. This entire peak structure is a masterclass in trend line traps. Silver staged a massive, high-volume consolidation throughout April and May, but it has now printed a severe red structural flush that sliced straight underneath its daily 20, 50, and 100 EMA layers ($75.27–$76.53) in a single dynamic sweep. It has drifted completely below its short-term cushions to rest directly on the long-term Daily 200 EMA baseline ($68.16), leaving retail momentum buyers completely trapped up at the higher distribution block.
Meanwhile:
• Price action on the Weekly frame showcases the true scale of the cooling cycle, revealing a massive, vertical rejection tail dropping back down to test the multi-year breakout cluster.
• The 1-Hour chart confirms absolute near-term capitulation, showcasing a vertical breakdown leg that pushed prices significantly below immediate hourly averages ($70.53–$74.38).
• Daily RSI has collapsed to 35.25 while the hourly indicator is completely pinned in deep, historically oversold territory at 18.45 . This indicates massive near-term liquidation exhaustion, making the metal highly prone to a violent dead-cat bounce to retest old support turned resistance.
MY PLAYBOOK:
• Exercising strong defensive patience on long-term capital deployment, entirely avoiding the urge to prematurely catch a macro falling knife while international liquidations wind down.
• Monitoring the $64.48 intermediate horizontal buffer very closely on the Weekly frame; a weekly close holding this zone establishes a highly favorable risk-to-reward configuration for structural long-term scale-ins.
• A clean daily and weekly closing breakdown below the dynamic macro floors at $41.33–$52.56 completely invalidates the multi-year bull cycle framework, opening the path for a deeper historical reversion.
Big moves rarely begin when sentiment feels comfortable.
They extend when short-term momentum completely capitulates, dumping quality assets straight into long-term institutional value pockets.
DYOR
Not a recommendation
#XAGUSD #SilverPrice #TechnicalAnalysis #PriceAction #CommoditiesTrading #Investinh #MacroEconomics (2/2)
1/2
🧵 The commodities market never changes.
People couldn't get enough of #Silver when it was parabolic, screaming toward the $120 mark amidst hyperinflation fears and structural manufacturing deficits. Now they are panic-selling as it experiences an absolute meltdown session down to $67.75.
Same asset. Different emotions.
That’s why a vertical parabolic run-up alone is never a reason to chase.
What's fueling the liquidation?
• Blistering US non-farm payroll numbers (172K vs. 85K forecast)
• Heavy bets shifting toward a hawkish Fed interest rate hike
• Iran-backed Hezbollah rejecting ceasefire terms, supercharging the US Dollar
But here's the question nobody is asking:
If long-term solar, EV, and AI chip industrial demand is still facing a deep multi-year deficit, why are the short-term technical layers breaking down so violently?
Key international levels to watch:
• Support: $64.48
• Major Support: $41.33–$52.56
• Current Price: $67.75
• Resistance: $70.53–$74.38
• Major Resistance: $75.34–$76.53
The short-term velocity has cleanly broken down.
The multi-year structural macro trend is being pushed to its absolute limit.
And that's where things get interesting. #Silver #XAGUSD #Commodities #Trading #Investing (1/2)
Friday wasn't a stock market event.
It was a liquidity event.
Nasdaq ↓
Bitcoin ↓
Gold ↓
Silver ↓
Different assets, same message.
The crowd is focused on headlines. The market may be focused on something much bigger.
What are we missing?
#bitcoin#nasdaq#gold#silver
@Sandeep_Majj The underrated part of the Bajaj Finance story is that compounding wasn't driven by patience alone. It was driven by relentless execution. Very few people had enough patience to hold Bajajfinance through the entire journey.
(2/2)
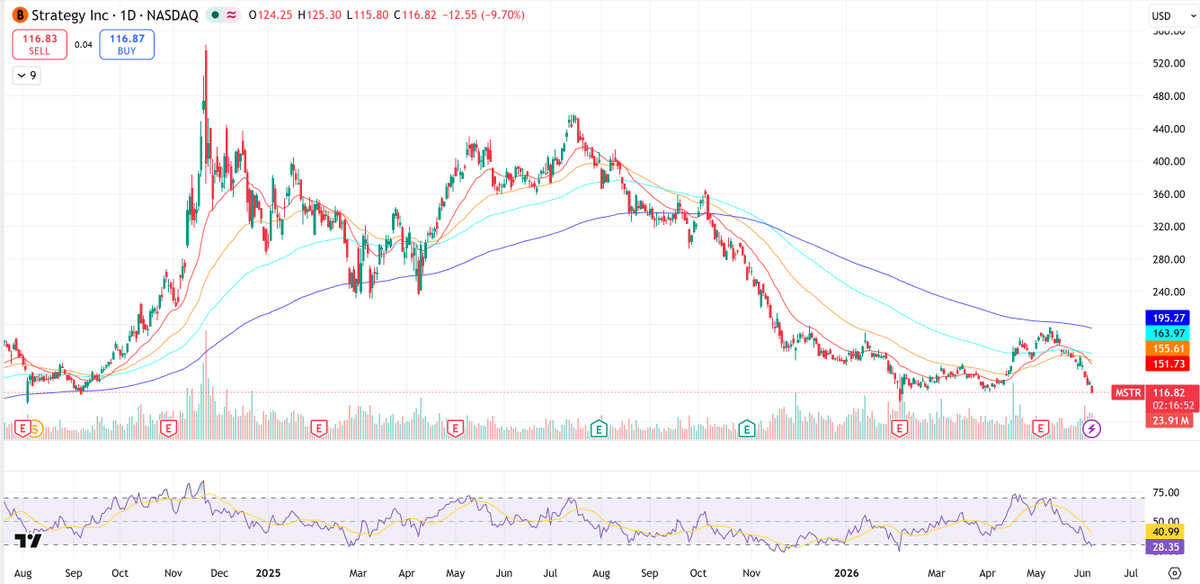
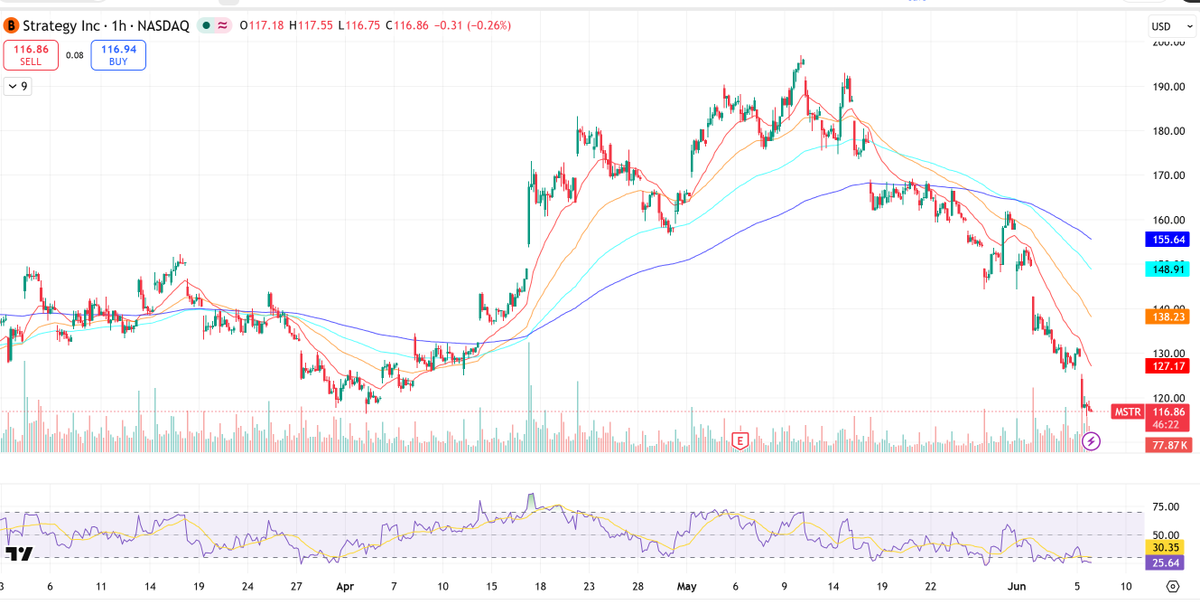
The Catalyst: As a de facto leveraged play on Bitcoin, MicroStrategy's premium structure faces acute double-whammy risk during structural crypto downturns. High corporate debt servicing demands meet a cascading underlying spot price, amplifying equity liquidations.
The interesting part?
Look closely at the macro Weekly chart. After an absolute parabolic extension into late 2024, the asset has mapped out a dominant macro rounding distribution pattern. The recent breakdown has completely violated the multi-month daily moving average clusters, shifting macro control entirely back to the bears. The Risk-to-Reward (R:R) here is highly skewed: entering long prior to structural base validation is high-risk, but a definitive breakdown past the immediate cycle low opens a massive vacancy zone to trade short extensions or clear-cut downside hedging.
Meanwhile:
• Price action on the hourly chart exhibits near-vertical cascading velocity, slicing cleanly through the hourly 200 EMA buffer to print a local low at $115.80.
• Crucial support sits explicitly at the immediate $115.80 threshold. If the bulls fail to hold this horizontal floor on a daily closing basis, it triggers a catastrophic macro breakdown straight toward the deep multi-year liquidity base between $92.00 and $100.00.
• Daily RSI is sitting heavily depressed at 28.35, matching an oversold hourly RSI of 25.64. This flags near-term tactical exhaustion, meaning sharp, algorithmic dead-cat bounces to retest overhead walls at $127.17 and $138.23 are highly probable before the macro breakdown resumes.
MY PLAYBOOK:
• Strictly treating the counter as an active defensive observation play, completely refusing to commit long-term spot capital until the weekly frame confirms structural stabilization.
• Watching for any aggressive hourly reclaims above the $127.17 short-term pivot to execute tactical, high R:R scalp-long mean reversions up to the $138 line with razor-thin stops.
• A decisive daily close below $115.80 invalidates any near-term consolidation thesis, confirming the next macro leg down to double-digit price territory.
Big moves rarely begin when sentiment feels comfortable.
They expand when structural leverage breaks down, forcing late-stage HODLers to face market reality.
DYOR
Not a recommendation
#MSTR #CryptoProxies #PriceAction #BreakdownTrading #MacroCrypto
🧵1/2
The ultimate proxy never changes.
People couldn't get enough of MicroStrategy ($MSTR) when it was soaring near $440, completely high on its leveraged Bitcoin Treasury narrative.
Now the panic is hitting hard as it slides straight to $116.82.
Same asset.
Different emotions.
That’s why trailing premium leverage alone is never a reason to chase.
What's fueling the breakdown?
• Spot Bitcoin breaking key macro supports
• Aggressive premium-to-NAV contraction
• High-beta technical unwinding across crypto proxies
But here's the question nobody is asking:
If the core treasury continues to accumulate corporate debt to buy the top, where is the floor when liquidity completely runs dry?
Key levels to watch:
• Support: $115.80
• Major Support: $92.00–$100.00
• Current Price: $116.82
• Resistance: $127.17–$138.23
• Major Resistance: $155.64–$163.97
The short-term trend has completely broken down.
The underlying crypto macro backdrop has frozen.
And that's where things get interesting
#MSTR #MicroStrategy #Bitcoin #TechnicalAnalysis #NASDAQ
@vickynvalour FII and DII accumulation are good indications for the forward order book. Price always discounts the future first. The view mentioned on near-term margins isn't to dismiss that future, it's simply to figure out low-risk entry levels if a pullback or a retest happens.
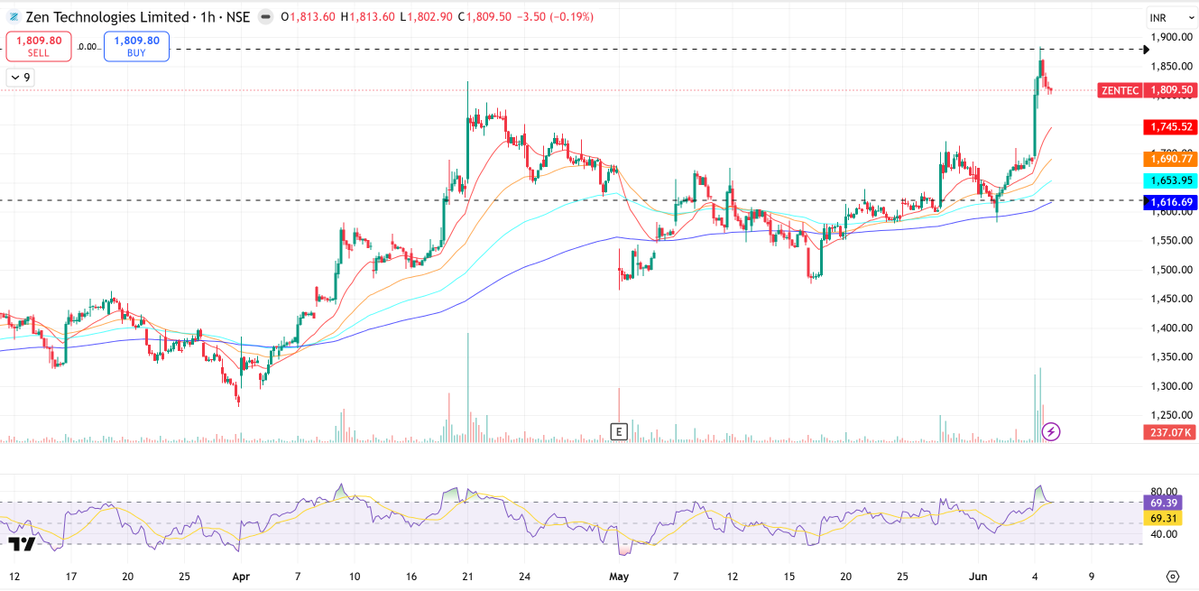
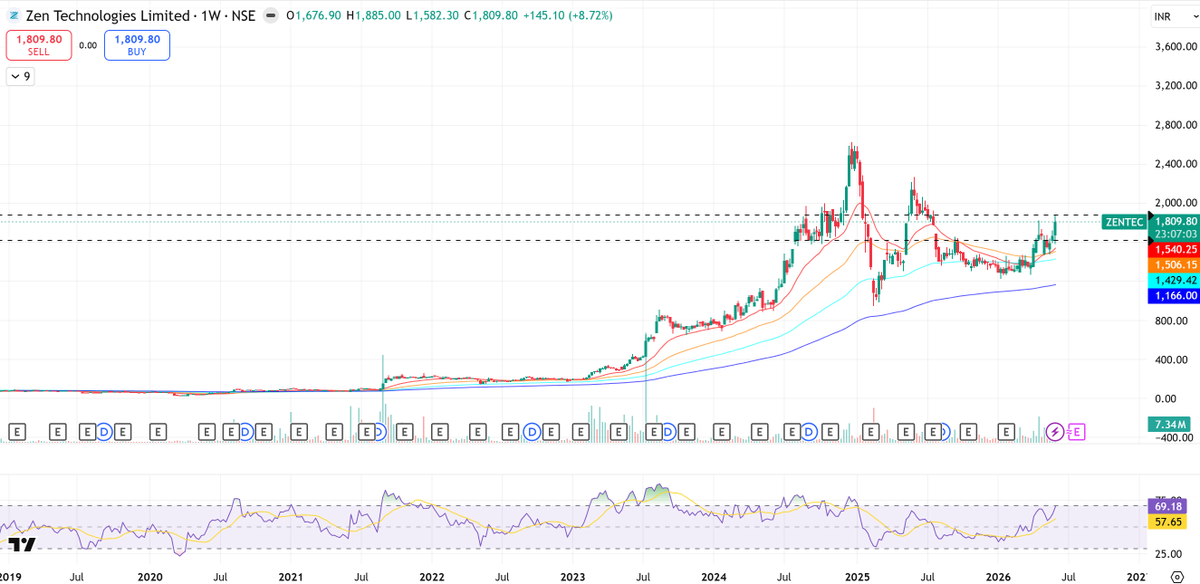
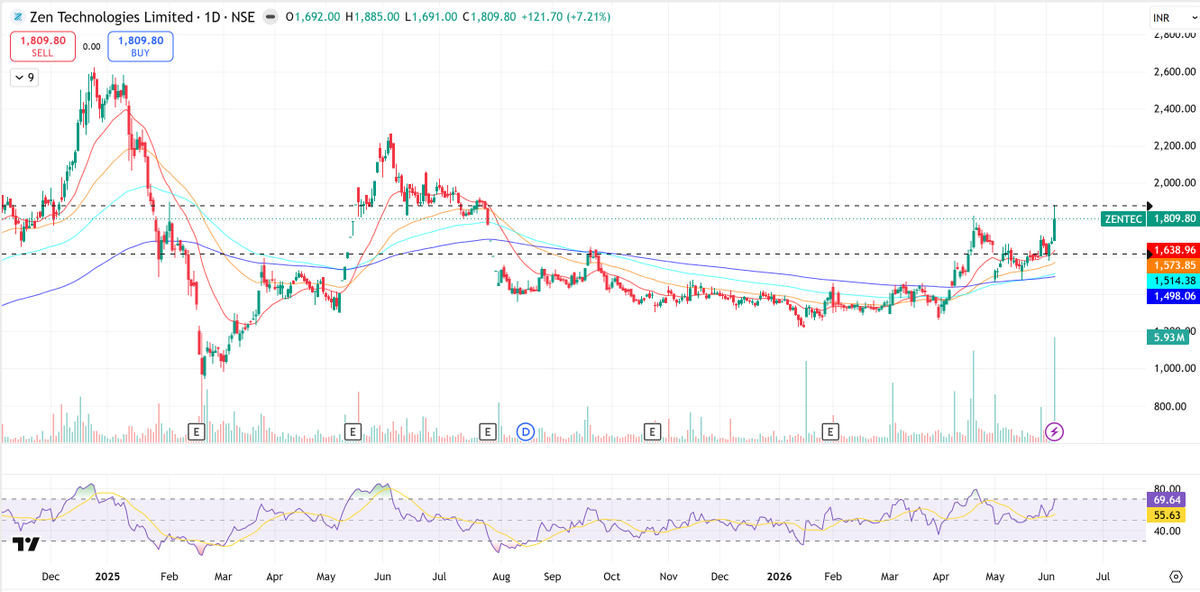
1/2
The defense sector never changes.
People dumped #ZENTEC near ₹1,400 when it was stuck in a painful correction, and fear was everywhere.
Now they are frantically rushing in at ₹1,809 after a massive +7.21% breakout session.
Same stock. Different emotions.
That's why a vertical price spike alone is never a reason to chase.
What's fueling the optimism?
• Geopolitical structural scaling cues
• Fresh localized domestic order pipeline expectations
• Heavy institutional volume piling into the tape
But here's the question nobody is asking:
If the future structural story is getting stronger, why are the current operational margins collapsing?
Key levels to watch:
• Support: ₹1,616–₹1,638
• Major Support: ₹1,498–₹1,514
• Current Price: ₹1,809.80
• Resistance: ₹1,885.00
• Major Resistance: ₹2,200–₹2,500+
The short-term trend has cleanly flipped bullish.
The core trailing financial engine hasn't.
And that's where things get interesting.
👇 Part 2: The numbers most momentum traders are completely ignoring.
#ZENTEC #ZenTechnologies #StockMarketIndia #TechnicalAnalysis #PriceAction #DefenseSector #BreakoutTrading
Spot on, price action is the ultimate lead indicator because it discounts future expectations long before they reflect in the ledger. The core point isn't to fight the momentum, but to understand the delta between what is being priced in the order book and what execution delivers. Both matter for managing risk.