Wealth Fund Analysis For Indexes, USD, Oil, BTC, ETH, Silver, Gold, 10 Year Bond
I track the real trend, not the noise.
I follow back but should be verified.
1/🚨Ending 5/29/2026, The Modified Dow Theory For US Equities Was +13.04% Above It's BUY Trigger, Signaling A Primary Uptrend. The Dow Jones US Total Market Confirmation Is +10.62%. Last Week It Was +11.48% & +9.40% respectively. (A Thread)
The Domestic US MDT was +1.56% higher this week. Last Week +1.10% higher, a difference of +0.46 from week to week.
By comparison, the International MDT which includes European and Asian Indicators is +9.68% above its buy trigger, Confirmation +6.93%. Last Week +8.77% and +6.20%.
International was +0.91% higher from last week. Last week +1.27% higher, a difference of -0.36 from week to week.
All attached charts are weekly.
Comments are always welcome. I respond as quickly as I see them.
If Bitcoin doesn't hold the 3x support (orange, red, green), there may be bigger issues than we thought. It's pretty much always held the 200ma on the weekly.
@HustleBitch_ This was known about Nicotine all the way back in the early 1950's. But we thought smoking was fine. Now we know smoking is not but the 1950's data on Nicotine was correct.
I heard about HBO's show Euphoria but thought it wasn't for me, finally watched Seasons 1 and 2 in about a week. Heard the 3rd season was coming out, waited, watched every episode. There are few shows that I've enjoyed as much. The ending, say what you will, was sad excellence.
@david_smit_333 True. They took over when they started to control the on and off ramps. Once they could do that it got rid of one of the main reasons people used it as a bank alternative.
Bitcoin vs Nasdaq.
AI Super Boom is fueling the Naz and will be for a long time.
Institutions, Banks took over Bitcoin which it was originally designed to fight against and be an alternative to.
Quantum breaking Cryptography is a real fear. Benefits Naz, cripples BTC.
So Michael Saylor‘s Strategy sold 32 Bitcoin. Been warning for a few weeks that the BTC chart was very weak. In Sunday’s weekly report pinned to my profile this is what I wrote specifically: ”Hold above 70532.70 support to avoid deeper monthly pressure”
Breaking 70532.70 is BAD. We aren’t there yet, but pretty close.
Full section of report:
Bitcoin: Monthly Temporary High
Trendlines: 4 week moving average +2.15%; 10 Week +8.76%; 20 week +0.45%; 40 week -16.82%.
Last Week: 4 week moving average +3.85%; 10 Week +9.45%; 20 week +1.92%; 40 week -15.67%.
We “can” use the 20 week moving average for buy/sell signal as it's the smoothest, but the volatility makes this very difficult to gauge. Likewise you can use the 10 week to confirm.
Chart Analysis: Short term momentum is BEARISH on the daily chart with the market in a bearish position after a significant weekly decline (closed below the previous week’s low).
Medium term remains CAUTIOUS. There is only a 2 month rally from the February low that needs to exceed the 3 month mark to confirm any developing trend.
Long term the secular bull market REMAINS ON TRACK with a dramatic 16 year rally. 2026 is a Direction Change year so watch the the July 1, 2026 turning point.
Key levels: Support 70532.70 (weekly). Resistance 75555.00 (daily) and 82814.23 (recent high).
Week-over-week: WEAKER with a sharp decline after the May 4 high.
What to watch next week: Hold above 70532.70 support to avoid deeper monthly pressure.
Comments are always welcome. I respond as quickly as I see them
1/🚨Ending 5/29/2026, The Modified Dow Theory For US Equities Was +13.04% Above It's BUY Trigger, Signaling A Primary Uptrend. The Dow Jones US Total Market Confirmation Is +10.62%. Last Week It Was +11.48% & +9.40% respectively. (A Thread)
The Domestic US MDT was +1.56% higher this week. Last Week +1.10% higher, a difference of +0.46 from week to week.
By comparison, the International MDT which includes European and Asian Indicators is +9.68% above its buy trigger, Confirmation +6.93%. Last Week +8.77% and +6.20%.
International was +0.91% higher from last week. Last week +1.27% higher, a difference of -0.36 from week to week.
All attached charts are weekly.
Comments are always welcome. I respond as quickly as I see them.
12/ Ethereum: Working On A New Monthly Pattern.
Trendlines:
4 week moving average -0.32%; 10 Week +6.45%; 20 week -5.91%; 40 week -27.45%.
Last Week: 4 week moving average +0.98%; 10 Week +7.65%; 20 week -4.72%; 40 week -26.34%.
We “can” use the 20 week moving average for buy/sell signal as it's the smoothest, but the volatility makes this very difficult to gauge. Likewise you can use the 10 week to confirm.
Chart Analysis:
Short term momentum is BEARISH on the daily chart with the market trading near support after a modest 9.303% bounce from the May 25 low.
Medium term remains CAUTIOUS. There is still only a 2 month rally from the February low that needs to exceed the 3 month mark to confirm any developing trend.
Long term is NEUTRAL TO CAUTIOUSLY BULLISH within a longer corrective pattern, with the secular uptrend since 2020 potentially intact into 2028.
Key levels: Support 2015.85 (monthly low area). Resistance 2052.00 (daily).
Week over week: MIXED with a modest bounce after recent weakness but made a new monthly low at 1964.01.
What to watch next week: Hold above 2015.85 support and monitor the June turning point for any reversal signals.
Comments are always welcome. I respond as quickly as I see them.
Disclaimer: This thread is for informational and educational purposes only and reflects general market observations and historical patterns. It is not investment advice, a recommendation to buy or sell securities, or a guarantee of future results. Markets involve risk, and past performance does not predict future outcomes.
Peace, Love, Espresso. ☮️💕☕️
May we all grow exponentially. 📈
The Cap 🫡
The Modified Dow Theory (tm) is a proprietary long term trend following system developed in the late 1970's by the author who began charting at a young age after reading books on the fundamentals of investing, the original Dow Theory, technical analysis, and the Great Depression all while being raised in the NYC area.
During this time he was also involved in the music industry where he met many who went onto become big names. He remains closely tied to the industry and many in the arts field.
After majoring and graduating in Communications and Business at University, and then starting a small business and selling it, all while in his early 20's, his next stepping stone was being hired and trained by the Wall Street Investment Banking Firm Shearson Lehman Brothers, where he acquired his Series 7, Series 63, and Series 3 licensure in NYC at the World Trade Center, working as an Investment Broker and Financial Consultant. He no longer holds those licenses after expiration, and all commentary and analysis he now provides is free of charge.
While in College and now back in NYC, he was involved in many charitable endeavors including projects to help end world hunger, and organizations donating anonymously to worldwide disaster relief and children's hospitals. One of his humblest moments was helping organize a satellite video conference (in its infancy during the early 1980's) which for the first time brought international doctors from around world to discuss the AIDS epidemic, needed medical research, and funding as well as outreach to those stricken in Manhattan.
During his tenure at the Twin Towers, he started another business selling various collectibles including art, diamonds, stamps, rare numismatic coins. He later sold this enterprise before moving onto the casino Industry in Las Vegas, just as the Strip was being reimagined. There he watched the fear and greed cycle up close as a casino gaming dealer and pit boss at various high level casinos.
He has been on Twitter/X since 2013 and started when he was looking for like minds involved in Bitcoin, offering his opinion on buy and sell targets at the time. He was on the original forum boards when Satoshi presented his white paper.
He currently lives in a small Rockies Mountain town.
Modified Dow Theory:
The MDT is calculated as follows: Dow, S&P 500, Nasdaq, and Russell 2000 are equal weighted as a share price (ex. 100 shares each) then averaged together and multiplied by X (usually in the 100,000-200,000 range) then calculated against a 40 Week Moving Average. Occasionally, it is adjusted and equal weighted again every few years or so as the charts demand (which is why the 100k-200k multiple can change. It doesn't alter the result, just makes it easier to calculate.) It is then confirmed using a total market index with a 40 week moving average. This used to be the Wilshire 5000, but we use the Dow Jones Total Market now.
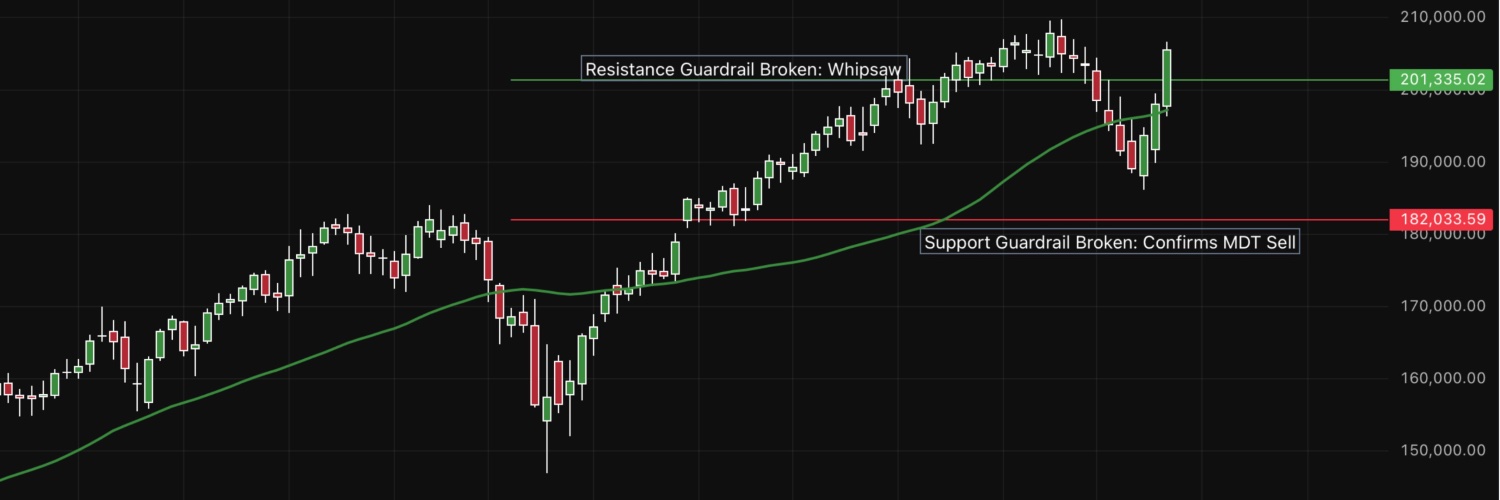
With any new buy or sell signal, we place a 5% stationary horizontal support and resistance line below and above the closing price. These are the whipsaw, false signal and final confirmation lines. A new original first step buy signal can reverse, so if it moves back below support, we know the trend was not sustainable and wait for a new buy signal, rinse and repeat.
If the 5% is broken to the upside resistance, then we know the trend is fully confirmed with a high level of accuracy.
In both cases we always wait for that double confirmation.
When either of these 5% are broken, we remove them and revert back to the original rules.
The system is not perfect. No system is. But over the long haul it has produced gains at approximately 18-20% for the indexes per annum averaged over a 5 year period. Sometimes more, sometimes less, but as an average WITH each buy and sell compounding upon the others, essentially doubling an account approximately every 5 years.
We just want that consistent piece in the middle while sidestepping large recession downturns, crashes and events the institutions know about before the retail investor as they move capital before big events happen. The Modified Dow Theory is perfect for tax free accounts as there aren't any capital gains while using them. Taxable accounts may want to use the MDT as simply a trend indicator, or be prepared for taxes.
Always consult with professionals before making any trades and/or for tax advice.
I'm posting this in case I drop this mortal coil and move onto bigger and better things. I assure you that at 66 years of age I'm not going anywhere anytime soon and am in extremely good health and will always be here on X until the inevitable. (Basically, I am the Elder or Grandpa of the MDT formula and passing it on.)
If you made it this far, the MDT formula is my gift to you. (Not everyone reads everything I write, so there you go.)
Comments are always welcome. I respond as quickly as I see them.
1/🚨Ending 5/29/2026, The Modified Dow Theory For US Equities Was +13.04% Above It's BUY Trigger, Signaling A Primary Uptrend. The Dow Jones US Total Market Confirmation Is +10.62%. Last Week It Was +11.48% & +9.40% respectively. (A Thread)
The Domestic US MDT was +1.56% higher this week. Last Week +1.10% higher, a difference of +0.46 from week to week.
By comparison, the International MDT which includes European and Asian Indicators is +9.68% above its buy trigger, Confirmation +6.93%. Last Week +8.77% and +6.20%.
International was +0.91% higher from last week. Last week +1.27% higher, a difference of -0.36 from week to week.
All attached charts are weekly.
Comments are always welcome. I respond as quickly as I see them.
11/ Bitcoin: Monthly Temporary High
Trendlines:
4 week moving average +2.15%; 10 Week +8.76%; 20 week +0.45%; 40 week -16.82%.
Last Week: 4 week moving average +3.85%; 10 Week +9.45%; 20 week +1.92%; 40 week -15.67%.
We “can” use the 20 week moving average for buy/sell signal as it's the smoothest, but the volatility makes this very difficult to gauge. Likewise you can use the 10 week to confirm.
Chart Analysis:
Short term momentum is BEARISH on the daily chart with the market in a bearish position after a significant weekly decline (closed below the previous week’s low).
Medium term remains CAUTIOUS. There is only a 2 month rally from the February low that needs to exceed the 3 month mark to confirm any developing trend.
Long term the secular bull market REMAINS ON TRACK with a dramatic 16 year rally. 2026 is a Direction Change year so watch the the July 1, 2026 turning point.
Key levels: Support 70532.70 (weekly). Resistance 75555.00 (daily)and 82814.23 (recent high).
Week-over-week: WEAKER with a sharp decline after the May 4 high.
What to watch next week: Hold above 70532.70 support to avoid deeper monthly pressure.
Comments are always welcome. I respond as quickly as I see them.