Heyy guys.. thoda attention yaha bhi dedo
Ladkiyon ke tweet ko RT kar lete ho.. I'm not saying mere hi tweet ko Rt kro
Dm me .. ye pic duga.. khud tweet kro.. dosto ko tag kro
Sirf RT nhi.. tag kro jitne kar pao..
Share kro .. binod kr liye bohot ab thoda serious kaam bhi ❤️🙏
@E8Markets@E8Futures@E8Crypto $216k payout with no cap is insane I'm a new trader since 2024 learning the craft. E8 One's control over DD & profit share is next level. If I win this $50k Signature account, it can change my life. Big respect to @E8Markets for supporting us 6
Trade with rules that actually make sense.
At Goat Funded Trader, everything is built to be clear, fair, and trader-focused.
✔ No time limits
✔ Balance-based drawdown
✔ News trading allowed
✔ Tight spreads & low commissions
🌐 https://t.co/t15rnKVjMq
2,000+ products. More choice for traders, more potential for sellers
🚀 With 2,000+ products now live in cTrader Store, traders have more tools to explore and use, while sellers have more opportunities to reach the right audience and grow.
Today, cTrader Store features:
816 Algos
1,136 Indicators
54 Plugins
For traders, this means more ways to customise their trading experience.
For sellers, it means more visibility, growing demand and more room to scale.
🤝 Thank you to every developer, creator and trader contributing to cTrader Store. This milestone reflects the value you bring to the platform every day.
And we’re only getting started.
👉 Explore cTrader Store - https://t.co/yOpdDqcMSe
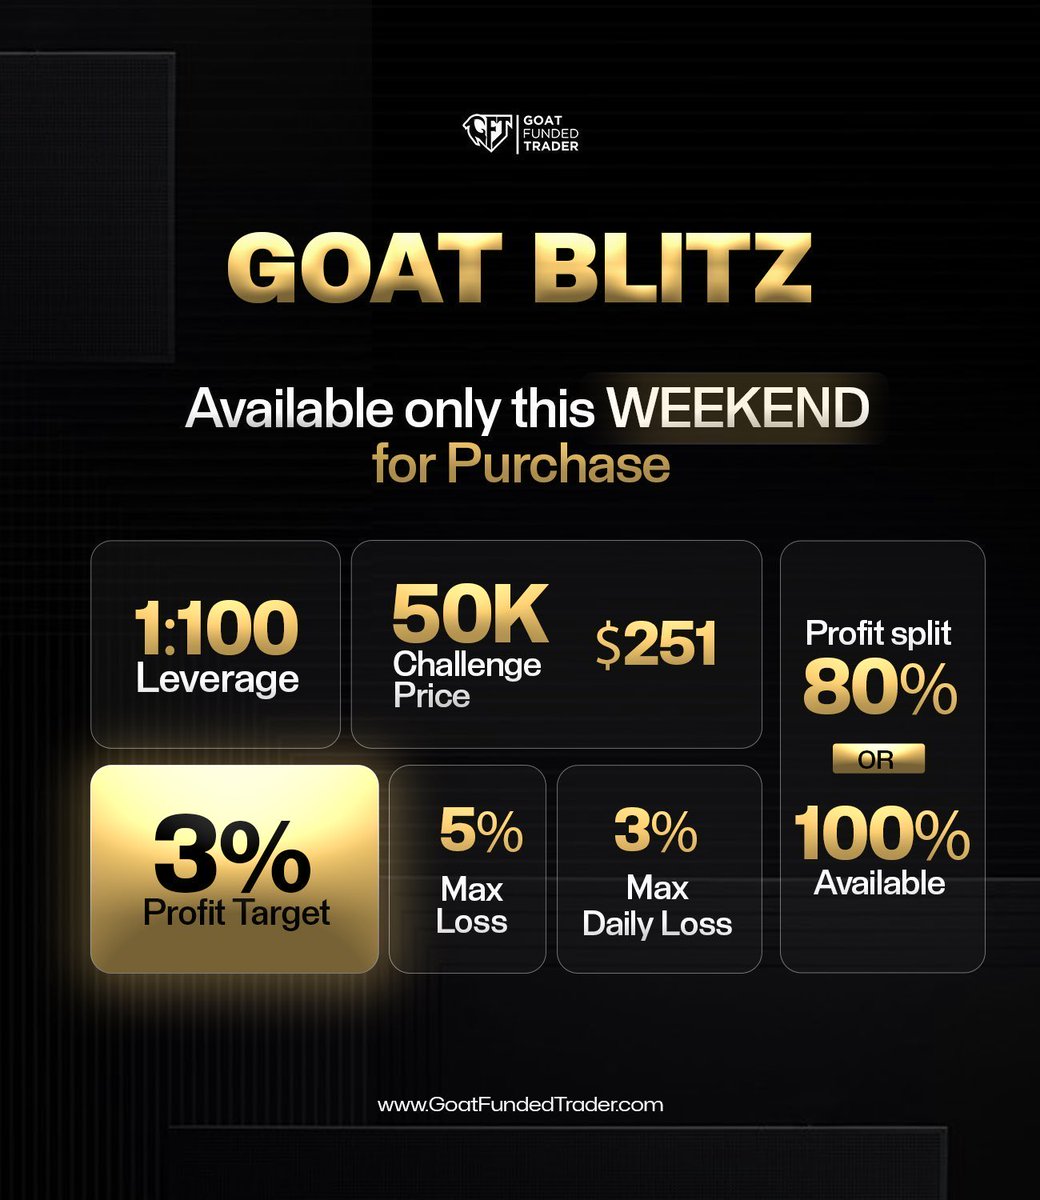
🚨 THE GOAT BLITZ CHALLENGE IS BACK!
Available for 48H ✅
this weekend only!
Don’t miss out:
💥 1:100 Leverage
💥 Only 3% Profit Target
💥 Up to 100% Profit Split
💥 5% Max Loss
💥 3% Daily Loss
💥 $50K Account for JUST $251
https://t.co/t15rnKULWS
🎥 Keltner Channels in cTrader
In this video, we explore Keltner Channels in cTrader - a volatility-based indicator that uses a central moving average with upper and lower bands derived from the Average True Range (ATR). It helps traders analyse trend direction, spot strong bullish or bearish conditions, and identify potential breakouts and reversals.
You’ll learn where to find Keltner Channels in cTrader, how the indicator is structured, and how its default settings relate to the moving average and ATR periods. The video also shows how traders use the direction of the channels, sustained price movement near the upper or lower band, crosses of the middle band, and breaks beyond the bands to interpret market conditions.
📍 Timecodes:
00:09 - Introduction: what are Keltner Channels
00:48 - Where to find Keltner Channels in cTrader and how the indicator is structured
01:26- Using channel direction and price position to analyse market conditions
02:22 - Spotting potential reversals with the middle band cross
03:53 - Using band breakouts to identify bullish and bearish moves
- Learn more about the Keltner Channels - https://t.co/atH5XCJS6A
- Join Discord - https://t.co/N23Rt86kcx
Don’t forget to like and share your thoughts in the comments!
_____________________________________
👉 Start Trading with cTrader - https://t.co/chQIER1Ve3
🎥 Historical Volatility (HV) in cTrader - how it works and how to use it
In this video, we explore Historical Volatility (HV) in cTrader - an indicator that measures past price fluctuations over a specific period, helping traders understand market variability and risk.
You’ll learn where to find the Historical Volatility indicator in cTrader, how it is calculated using logarithmic price returns, standard deviation and annualisation, and how to customise settings such as standard deviation and bar history.
We also look at how traders use HV to:
• Identify rising volatility and expanding market swings
• Recognise falling volatility and quieter market conditions
• Confirm breakout conditions and trend continuation
• Adjust protection and stop-loss placement based on market volatility
• Combine HV with indicators such as ADX or moving averages
• Use HV in cBots
📍 Timecodes
00:09 – Introduction: what is Historical Volatility (HV)
01:14 – Where to find Historical Volatility and how to customise its settings
01:34 – How Historical Volatility helps identify changing market conditions
02:29 – Using HV to confirm breakouts and trend continuation
03:39 – Using volatility to adjust protection and stop-loss placement
05:08 – Combining HV with other indicators and using it in cBots
- Learn more about the Historical Volatility - https://t.co/ZR04tiGk4N
- Join Discord - https://t.co/N23Rt86kcx
Don’t forget to like and share your thoughts in the comments!
_____________________________________
👉 Start Trading with cTrader - https://t.co/chQIER1Ve3 👈