Unlocking Web3 Data Like an oil refinery for blockchain, we turn raw data into valuable, data-driven insights, helping users thrive in the Web3 economy
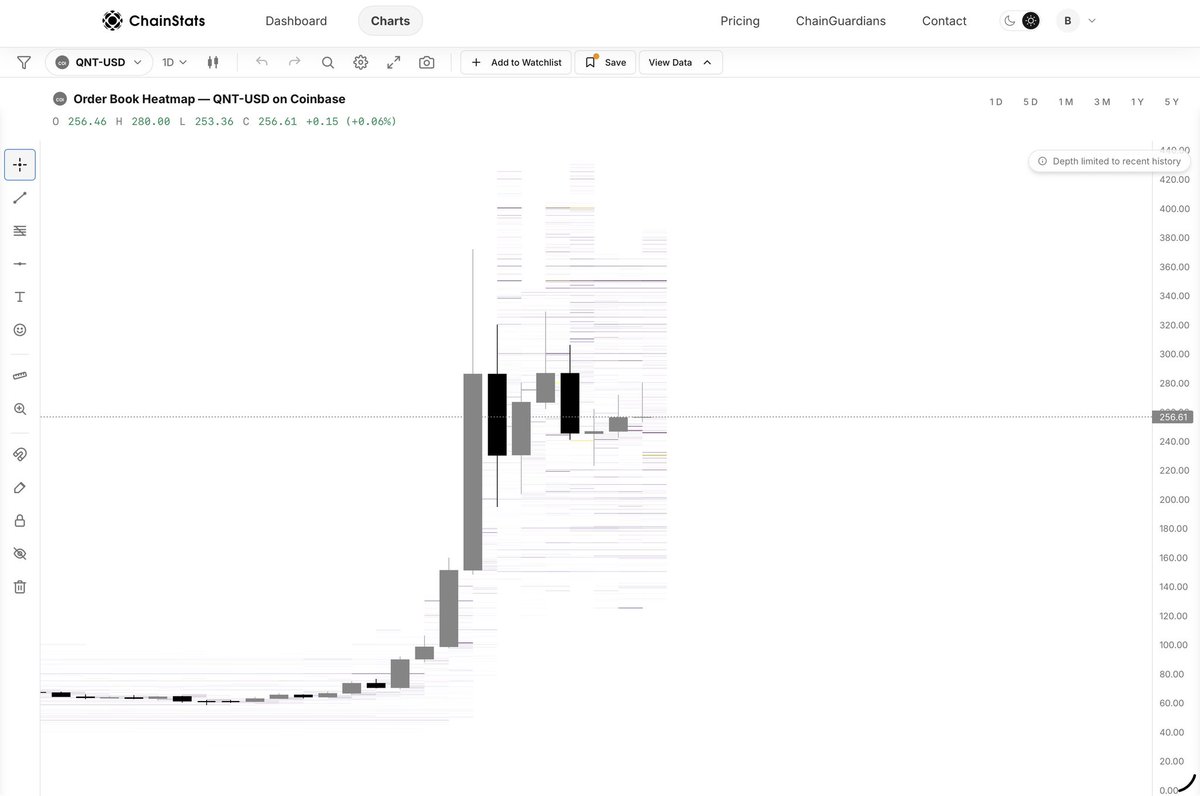
$QNT is consolidating around $256 after an expansion move higher.
Buyers are supporting the mid $240s, while sell side liquidity sits around $280–$320. If buyers keep absorbing supply, that upper liquidity becomes the next area to watch.
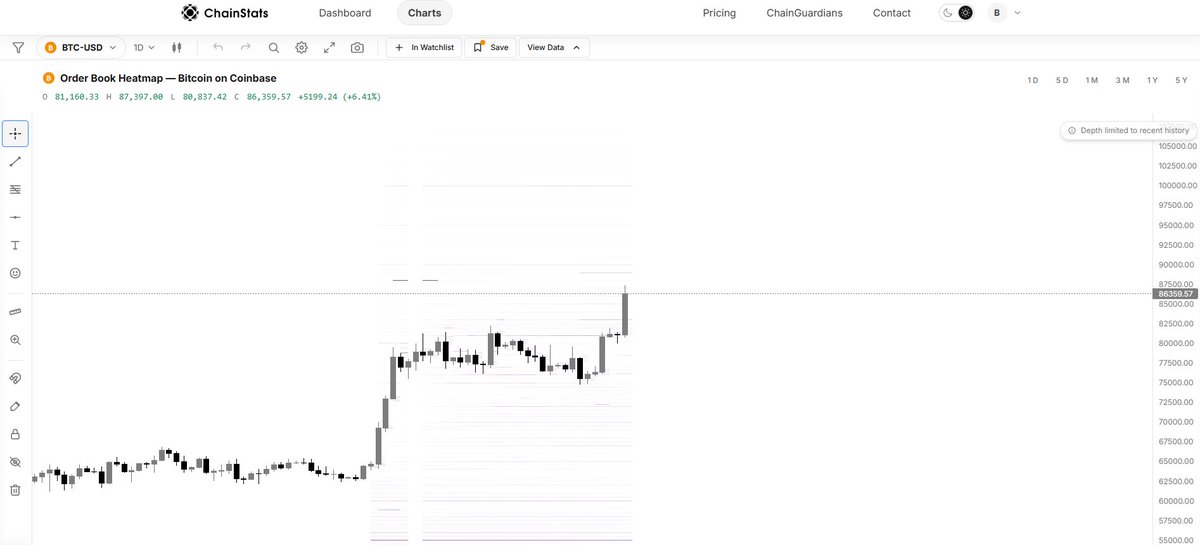
$BTC buyers keep chipping away at the sell wall. Seller confidence is starting to fade as distribution gets pulled.
Next significant liquidity sits around $85K and $90K.
Upgrade your strategy with ChainStats.
$BTC is on the move.
While some are buying, liquidity is telling a different story.
Don’t get caught guessing through the volatility. Use ChainStats Order Flow Liquidity Maps to see where liquidity is building, where it’s being pulled, and where the market may react next.
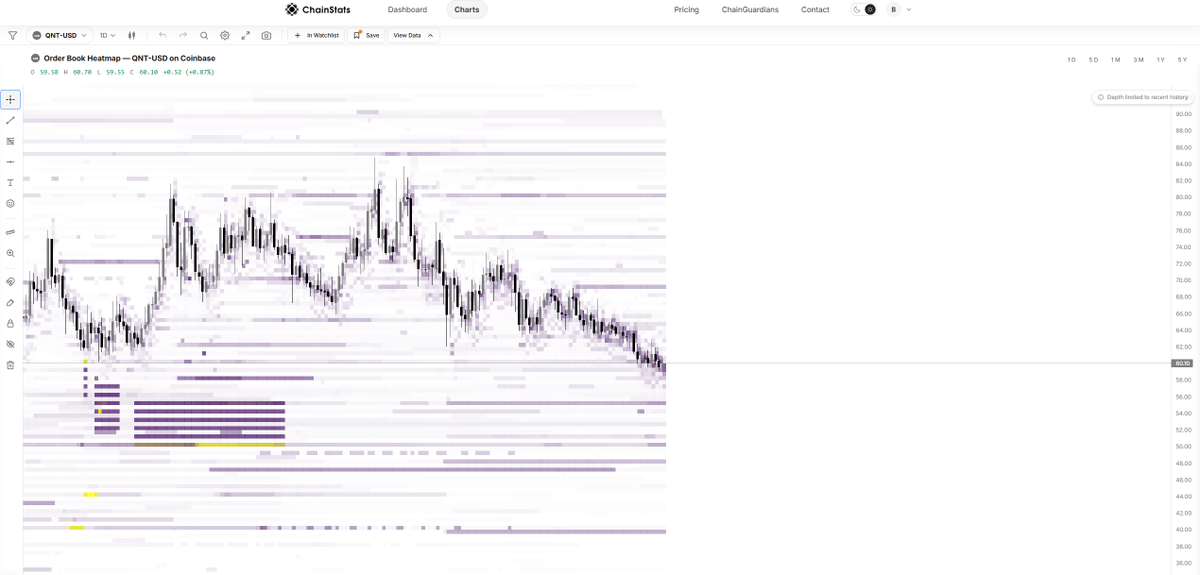
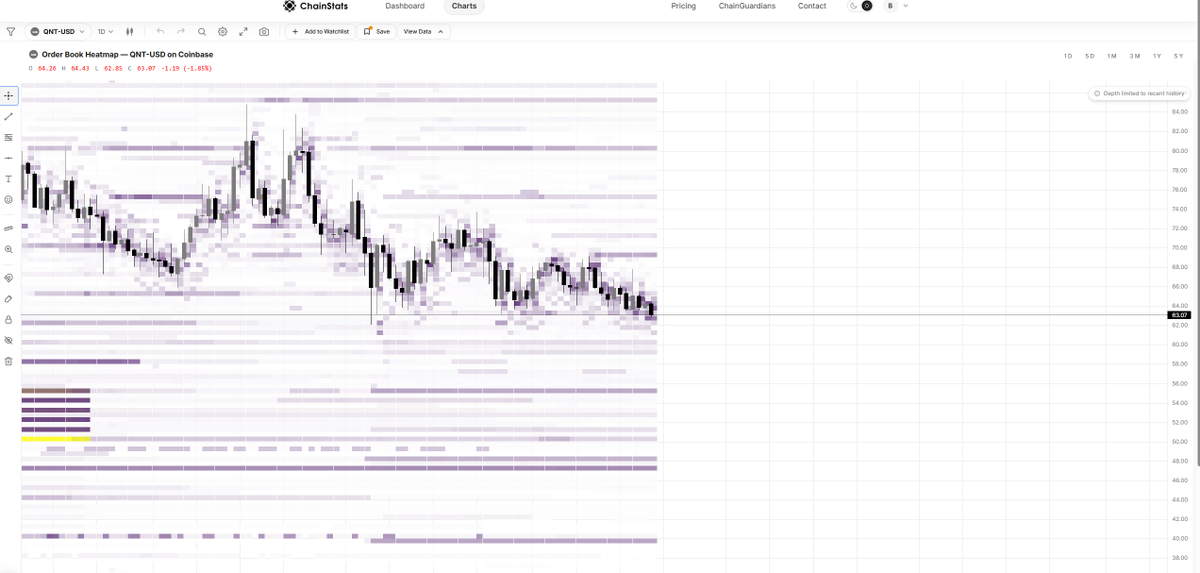
$QNT is trading near $60, with the strongest visible bid liquidity stacked below around $50–$56.
Orderflow reveals where buyers are positioned before price makes its next move.
Follow the liquidity. Track the orderbook live on ChainStats.
$QNT is pressing the lower end of its range while the orderbook shows liquidity building beneath price and thinner depth overhead.
That’s why orderflow matters: it shows where participants are positioned, not just where price has been.
Signal over noise.
Zoom out and follow the liquidity.
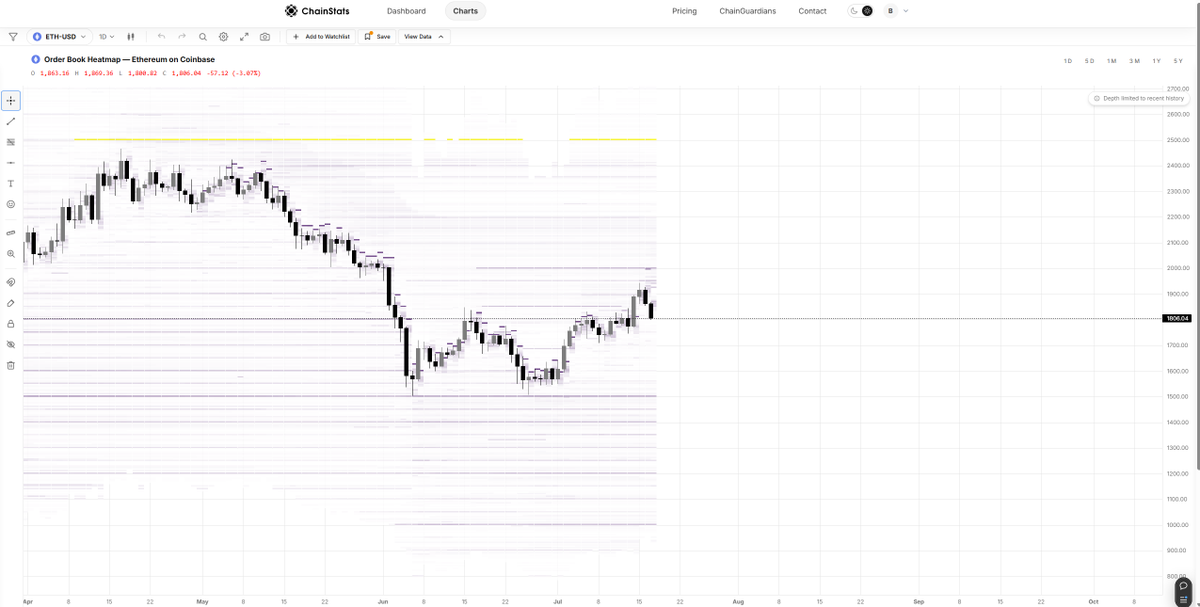
Our 3D $BTC order book heatmap shows where bids and asks are building around price, helping traders spot potential support, resistance, and liquidity zones before they become obvious.
See the market differently with ChainStats.
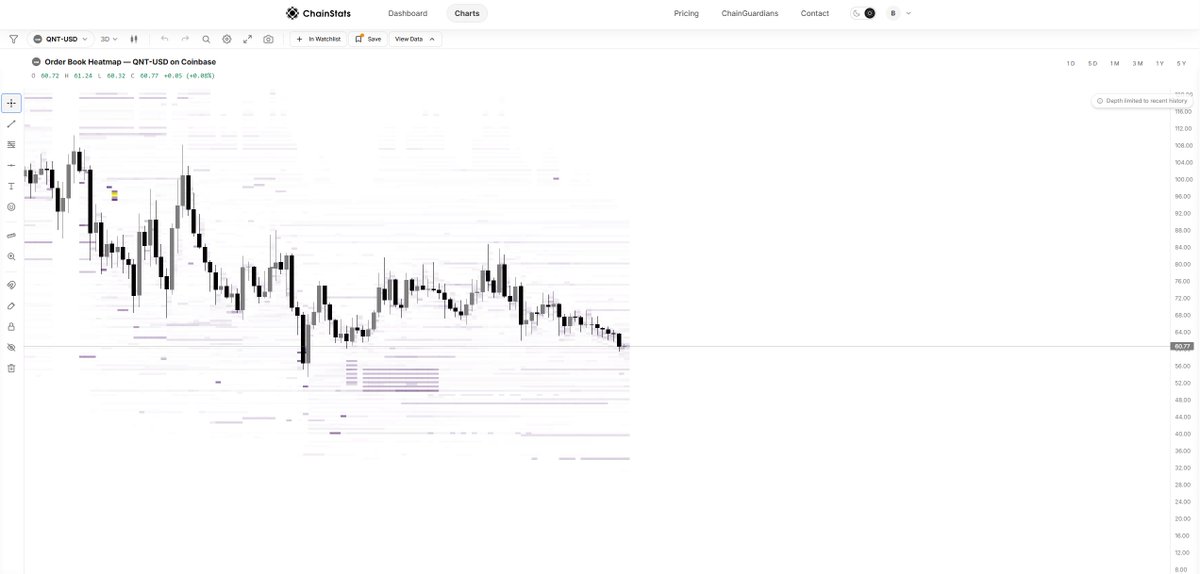
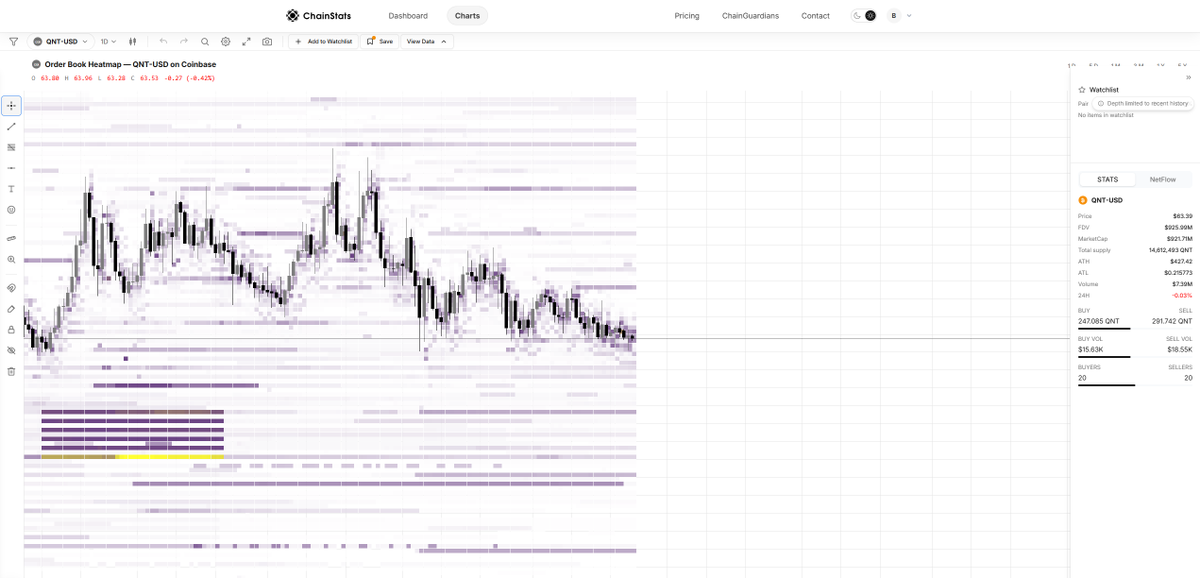
$QNT is trading near $63.50, but the orderbook shows where the real battle is forming.
Heavy bid liquidity is stacked between $55–$50, while the nearest meaningful overhead liquidity sits around $68–$72.
Orderflow shows the structure behind it.
Powered by #stats
Orderflow reveals why price grinds higher, where resistance is building, and how market participants are positioning bids and asks. Explore ChainStats and unlock a deeper level of market analytics.
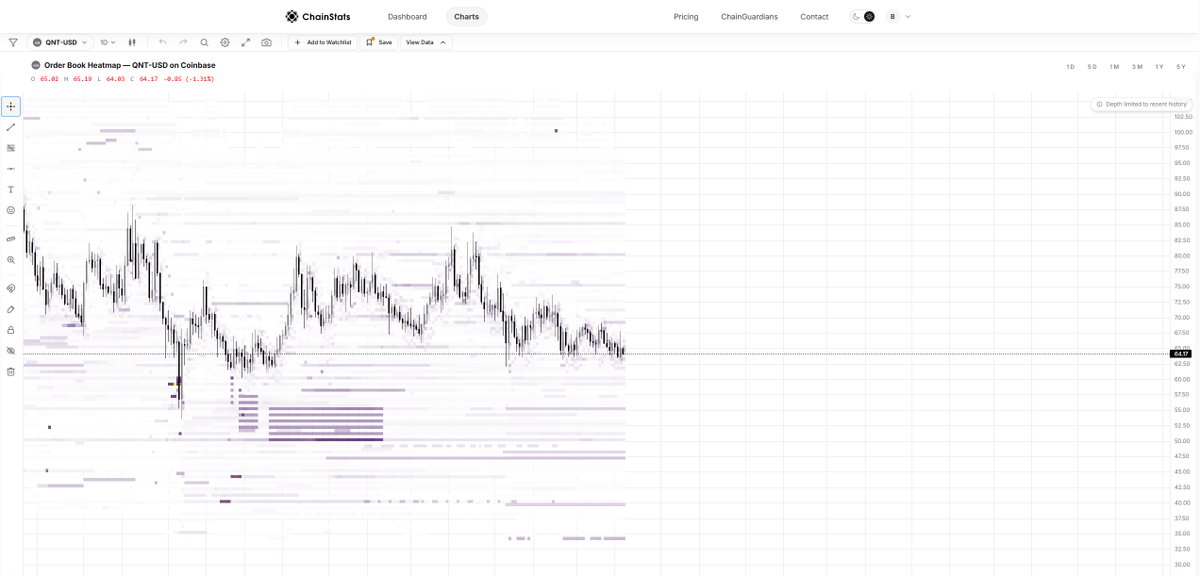
How to read this $QNT orderflow chart:
Candles show price. The orderbook shows where liquidity is stacked.
Darker bands = larger orders. Liquidity above can act as resistance while liquidity below can act as support or a price magnet.
Watch what stays, gets pulled or absorbed.
Want to know where the potential liquidity zones are for $QNT?
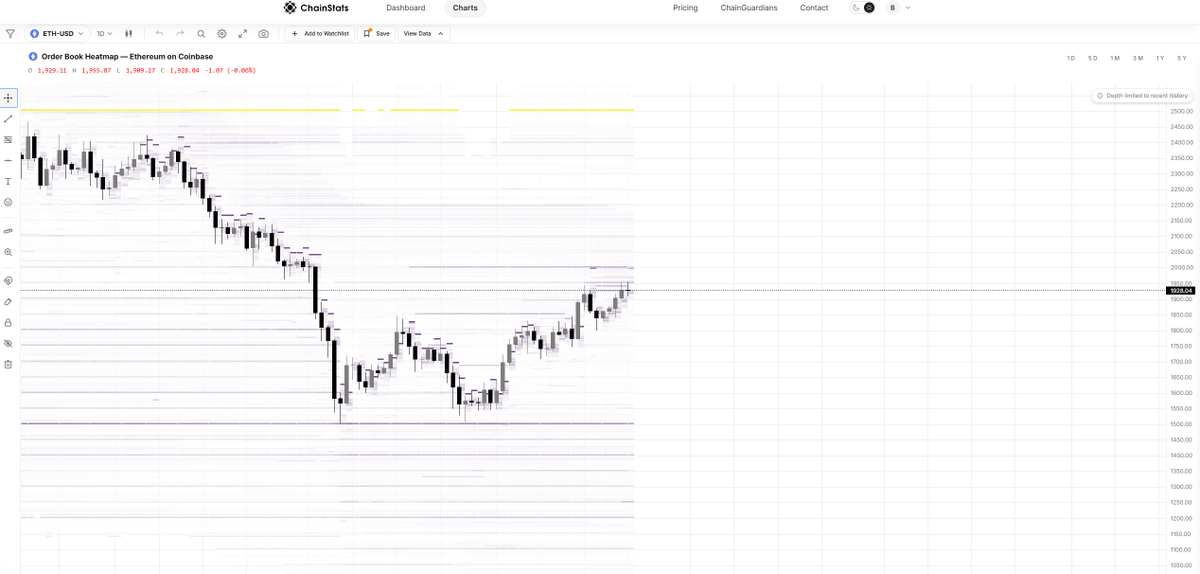
Our order book heatmaps turn complex order flow into a clear visual, making it easier to identify where liquidity may be building above and below price.
Want a quick snapshot of what the market looks like?
Our dashboard surfaces forward looking indicators like #btc and stablecoin netflows. Since #BTC often acts as the index for the broader crypto market, its flow activity can offer valuable context before the day unfolds.
ChainStats V1 is officially live.
A faster, cleaner, and more powerful way to analyze on chain markets.
Signal over noise. Built for what comes next.
Welcome to the new ChainStats.
https://t.co/1RW1KTwAHq
The wait is almost over.
ChainStats V1 launches soon.
A complete overhaul of the platform you've come to know.
Faster.
Cleaner.
More powerful.
The next chapter starts now. ⚡
#stats#onchain#crypto
We listened. We rebuilt.
A major ChainStats update is on the way.
Faster workflows. Cleaner data. Better insights.
This is only the beginning. 👀
#STATS#Crypto#OnChainAnalytics
Cloud costs are killing web3 projects.
We found a better way.
@ChainStatsPro x @RealityNetw0rk are going live.
We're breaking down how ChainStats optimized infrastructure, ditched heavy AWS bills, and integrated Chain-Guardians nodes for flawless data verification.
Want to know the blueprint. Set your reminder 🔔
$STATS @ChainStatsPro aims to be the accessible "Bloomberg Terminal for Web3," leveraging blockchain data for transaction analysis and providing real-time on-chain insights
Full video drops tomorrow