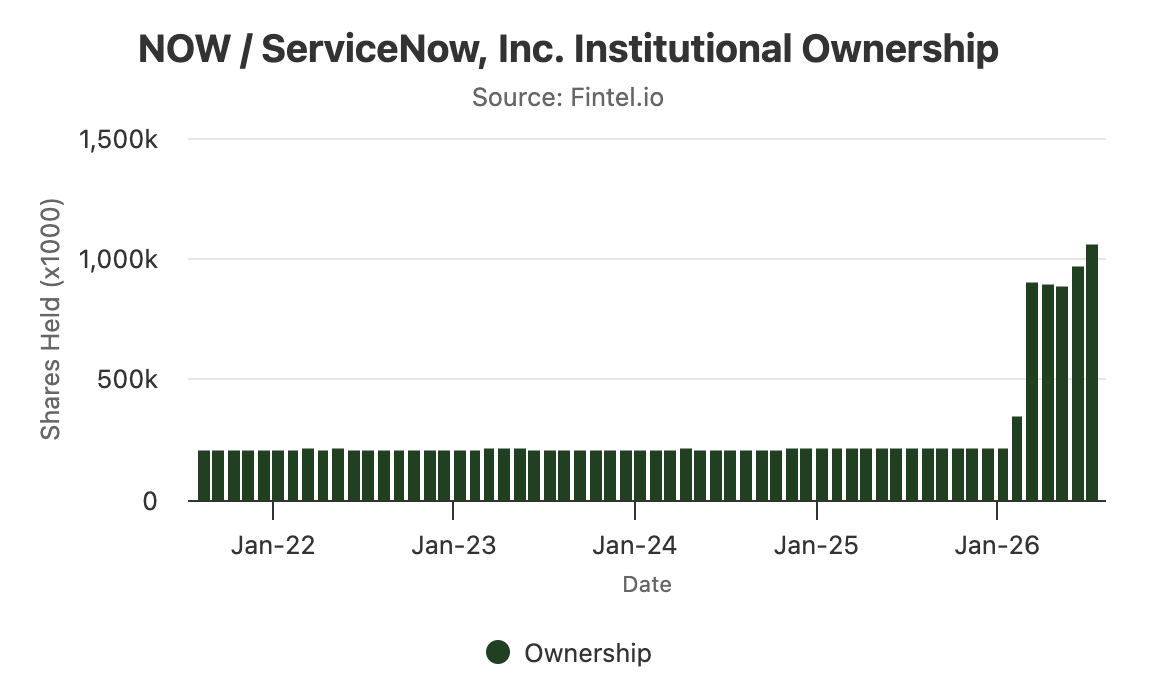
A decent sized $NOW position, still accumulating slowly.
- I think it's a generational opportunity.
- An essential S&P 500 company that other 499 companies use.
- Multiple analyst upgrades and a strong buy.
- Heavy insider buying.
Don't buy because someone else bought it, always do your own research and buy if you like it.
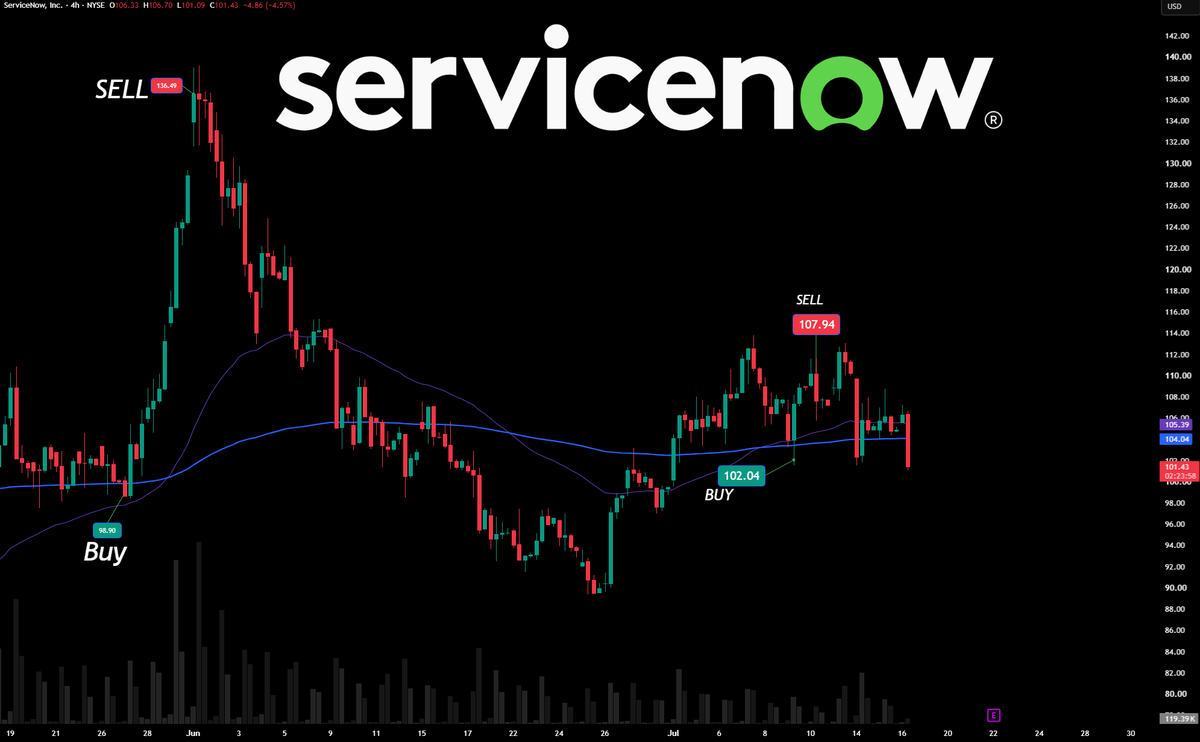
$NOW THANK YOU for offering me these new entry.
Now I wonder if we cant get the $97 retest or maybe even lower?
Losing this ema200 isn't ideal for holder ngl.
The weakness of it seems bad while SaaS were doing great.
Waiting before bidding here.
$NOW
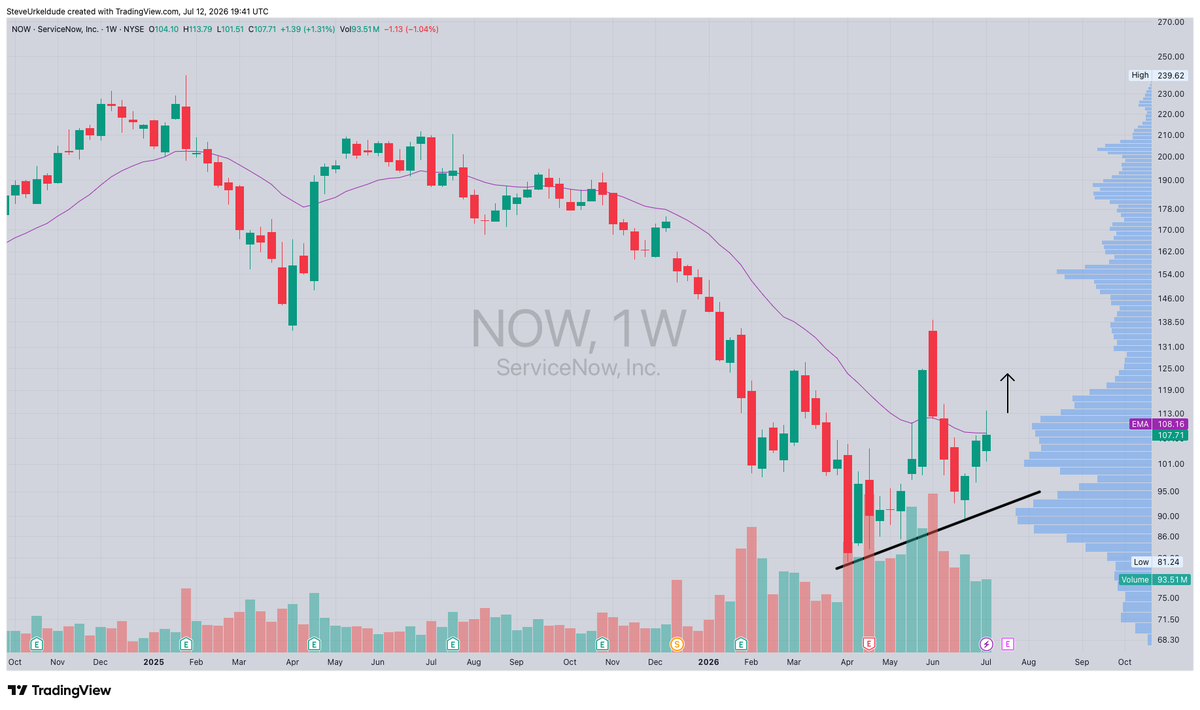
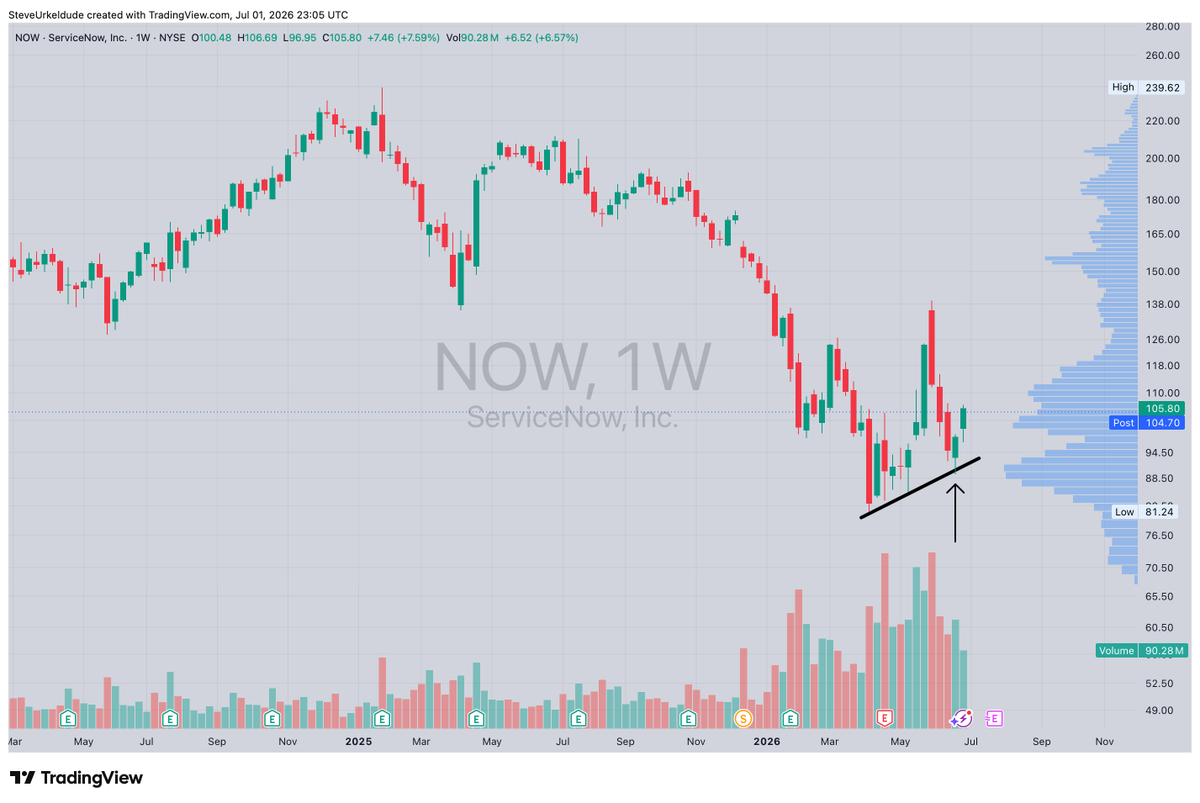
One of the best Inverse Head and Shoulders setups out there 👀
First stop 🎯 $120
Then 🎯 $135
This is the chart that you will look back on when it goes to all time highs 🤯
💜🍌🍌🍌
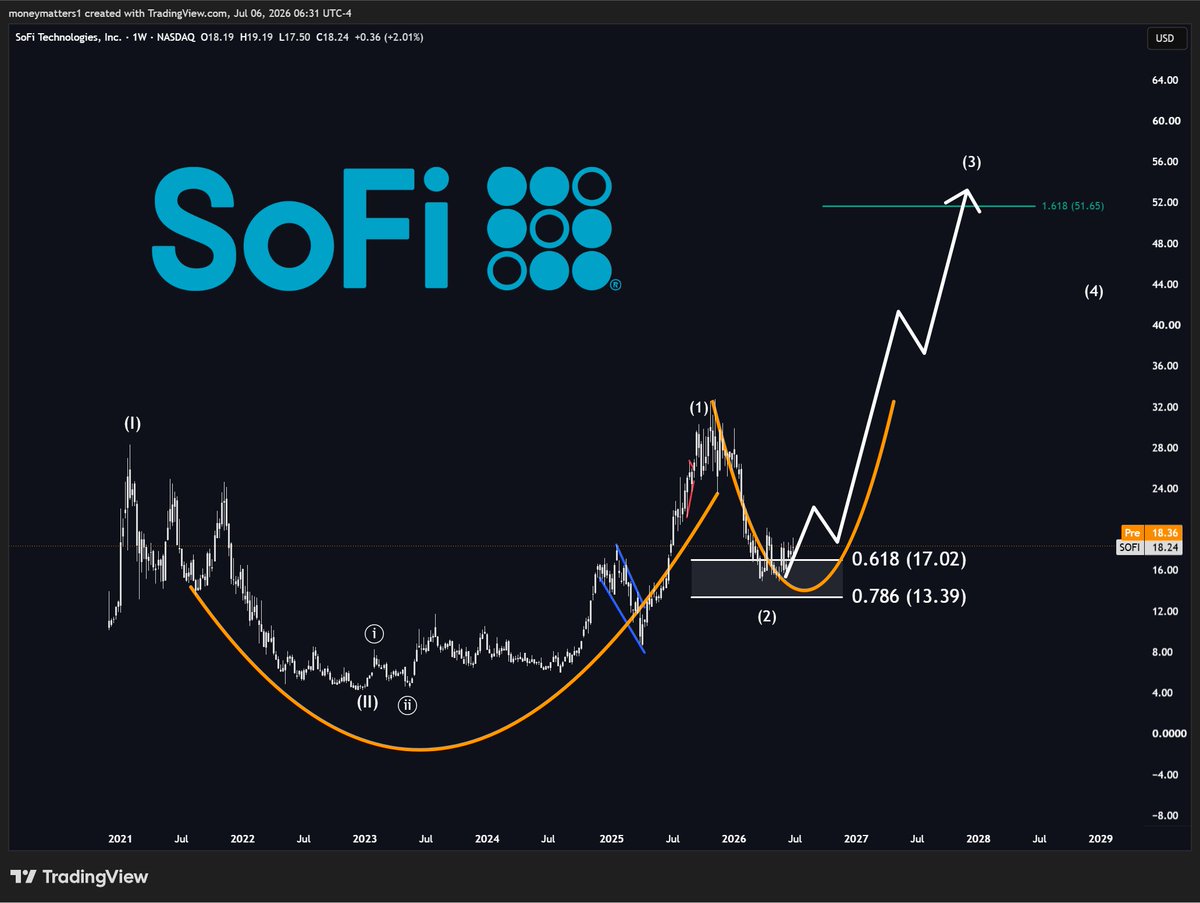
$SOFI Long-term projection
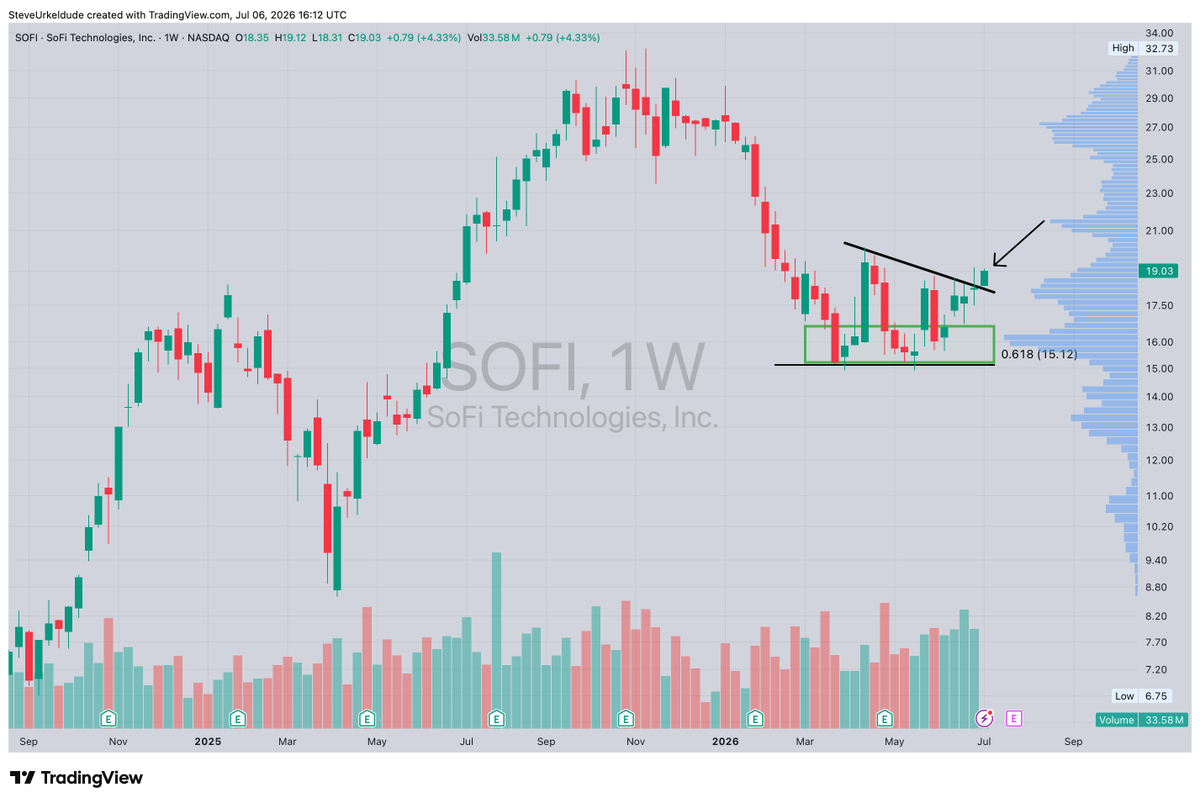
The setup looks genuinely incredible here.
Strong signs of a bottom are flooding in, while the CEO is buying millions in shares.
The fundamentals are continuosly improving, strenghtening the bullish thesis over the long-term
I'm heavily invested here, and have no doubt that we will see $SOFI at $50 before end of 2027.
On setups like these, patience is key.
Sometimes you accumulate for months while nothing happens, just to double your money in a single week.
$SOFI is one of these stocks.
$NOW
NOW - weekly chart analysis 💜
Current price $98
First target 🎯 $115
2nd target 🎯 $125
As shown in this link below I have been tracking this inverse head and shoulders setup for quite sometime
Let me also take a quick moment to teach all of you something. When good companies are under this much technical damage and downtrend, they need something meaningful to make sure that without a doubt a major bullish to bearish reversal has occurred and that institutional investors that support the reversal pattern and theme know that the broader community will come in and support the structure they helped create over the top of them
The way to do this is very long term Inverse Head and Shoulders especially on weekly and monthly time frames. I believe that ServiceNow $NOW has paid for it’s time in purgatory and we are witnessing the long term Weekly chart Inverse Head & Shoulders pattern that will not only setup the short term target I forecasted, and the intermediate term target I forecasted, but the long term is gonna be an All Time High and we will look back at this period on the chart as the entire bottom structure for that move 👀 🤯
The SAAS apocalypse that was the theme that these “Per Seat” revenue software businesses had their terminal value questioned as everyone was just going to “vibe code” these companies away
I believe the table that I have been pounding for months and months is starting to resonate across the investment and wallstreet community which is certain AI native companies like $NOW $SNOW $PLTR and several others are not being disintermediated by AI but in fact are being enhanced by AI
I have written essays on this subject so as quick recenter note I was the first human being to coin the phrase several months ago that would change the “Per Seat” model to an “Outcome Based” model. Since then, several subscribers and followers have told me that they remember hearing that from me first and that several pundits are now using it on financial media like CNBC and Bloomberg 😘
The CEO Ana’s dine a lot of insider buying, the company has boosted its buyback program significantly, the technical structure as discussed is setting up one of the best setups in the stock market game, all the CEO needs to do is come out with a great quarter and say that they’re benefiting from AI in a big way as it’s driving customer experience and revenues and that AI for their own company is helping them produce just as much or more outcome with not much greater cost, that would be a great elixir to change the whole narrative of this company and its stock!
Not financial advice!
Much love! 💜🍌🍌🍌
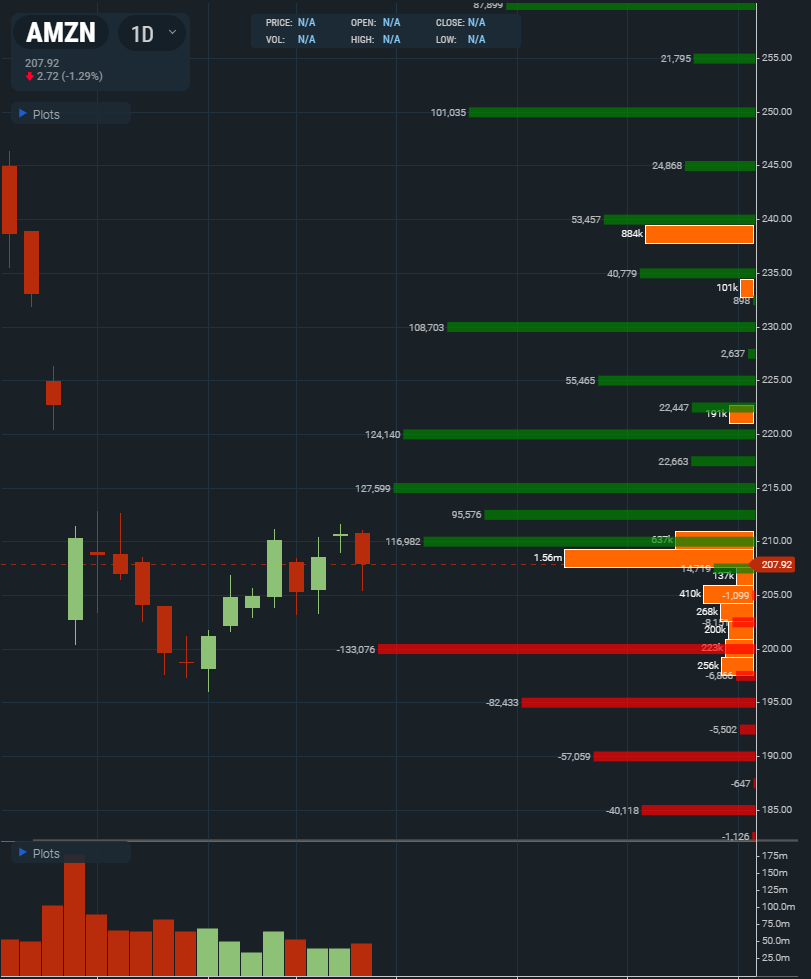
$AMZN
AMZN - weekly chart analysis 💛
The stock has held the Weekly 100SMA for 2 years as highlighted by the white circles ⚪️
First target 🎯 $217 which is the weekly 50SMA on holding support from the 100SMA
A close above the weekly 50SMA around $217 would be a bullish signal and the next area to test supply would then be the weekly 21SMA and weekly 13EMA respectively around $225 - $227
Not financial advice!
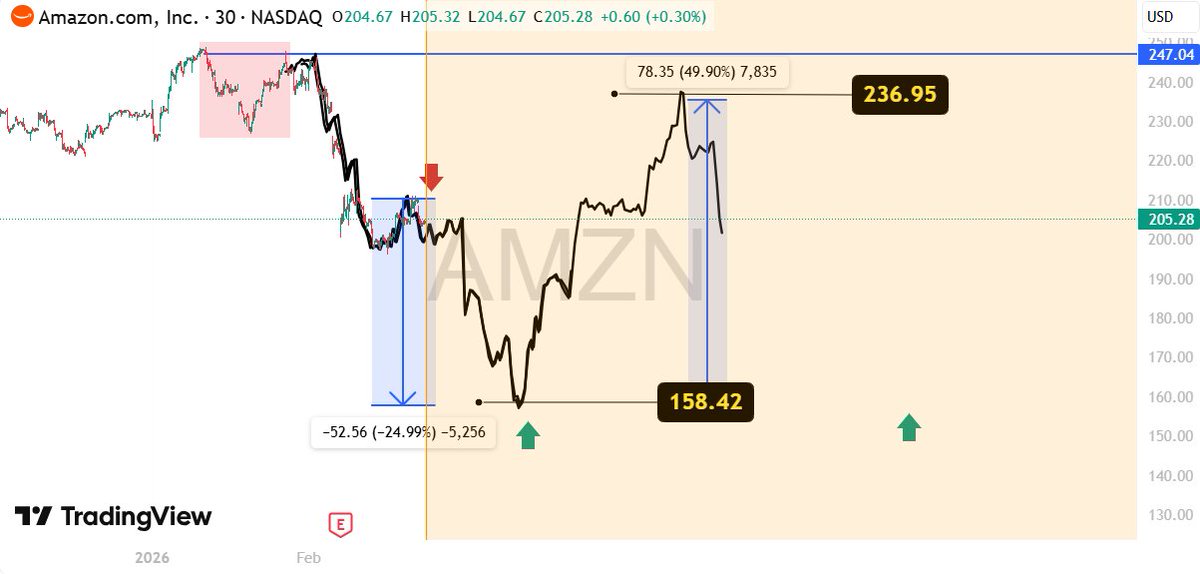
$AMZN:
I’m open to a pullback into the 150–156 zone before any real upside attempt. If buyers defend that area, continuation toward 240–244 comes into play.
I won’t front-run it—waiting for price to confirm at support.
$NVDA $SOFI $ORCL $PLUG