Tracking the spread of assets and quantitative strategies. Generating income + gains of real purchasing power. Storage of value. amateur of PPP + diamonds
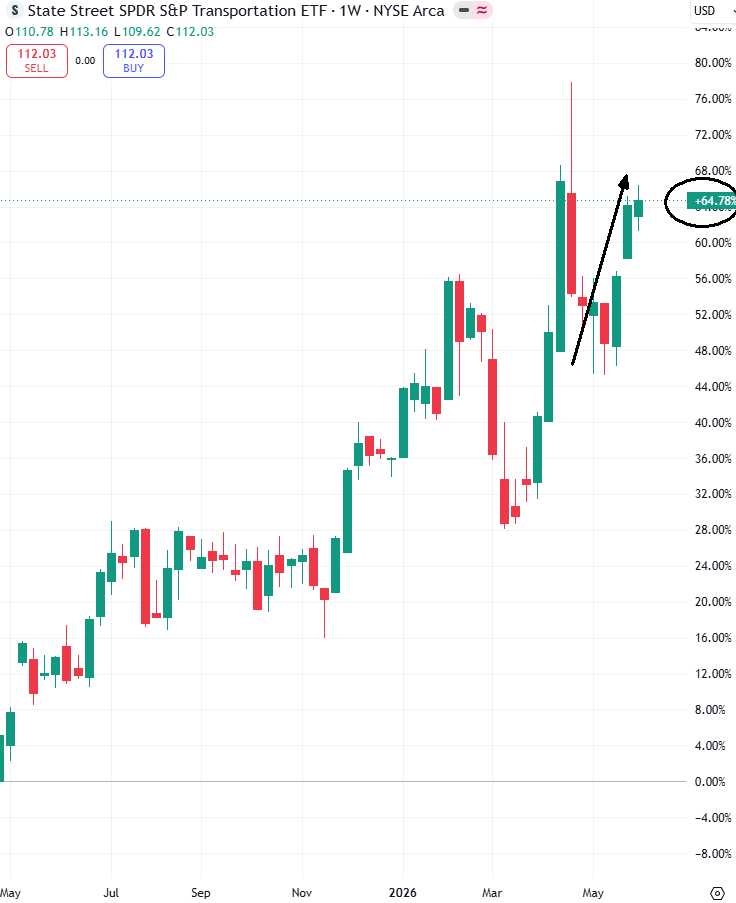
One of the fastest-growing sectors in the US is transportation.
Up 64% since May 2025, or in just 13 months.
And most notably, the XTN ETF climbed during last Friday's sharp decline, demonstrating a surprising decoupling.
Hotel stocks, such as Marriott and Hilton International, are also showing a strong upward trend.
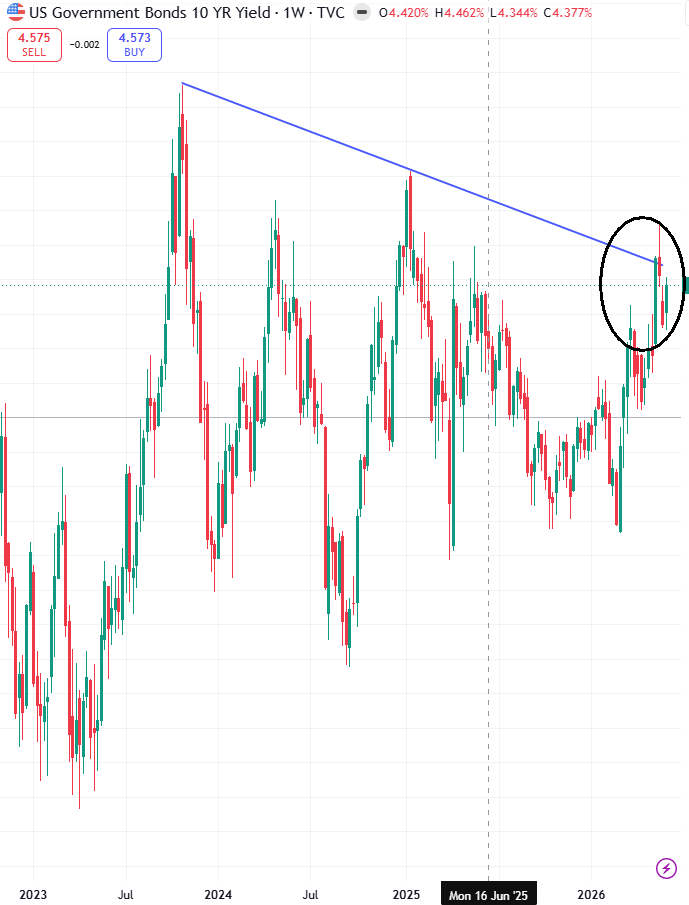
For three weeks now, Trump has been creating confusion in the media about Iran to control the surge in the 10-year bond.
The weekly breakout chart pattern shows that he is currently managing to contain it.
Negative polls don't really interest many people because the opinions of the slaves haven't mattered in the West for a long time.
But if the 10-year bond were to climb to 4.75% and the 30-year bond were to yield 5.5%, then the opinions of the bankers would become clear, and these are the kinds of opinions that impact more than 100 million voters...
I don't know how the Iranian story will end, but the longer oil prices remain at $100, the higher the CPIs will climb, beyond the critical 4% threshold that sends stocks plummeting for at least two quarters.
Many incompetent people judge American stocks without using numbers.
One of the silly narratives circulating is that the AI bubble isn't really a bubble because it's concentrated in a few stocks whose profits are rising sharply, which is supposedly normal...
Very well.
Okay, let's take revenue, forget about future profits and accounting tricks, and assess what it's worth right now.
EV/SALES
More than 40% of the S&P 500 stocks are up 10x, something unseen in 45 years.
Elementary school level math:
500 x 40% = 200
200 stocks
10x is already extremely expensive, and 200 stocks isn't just a few dozen related to AI. We're in the midst of a widespread mania that will take five years to digest.
But there's worse.
Soon, 15% of stocks, or 75, will have an EV/sales ratio greater than 20x. That guarantees a major crash in the coming quarters. This only happened once before, in 2000.
Future growth cannot support such expectations. Financially, disappointment is guaranteed.
So, it's no longer the time to buy the dip and wait for a rebound.
If you're stuck, you'll have to relearn how to cut your losses, because we're entering a zigzag cycle, not a chain reaction of new all-time highs.
Entire generations of stock market enthusiasts disappear when mean reversion stops working.
A little vigilance is needed. We are in the second-largest bubble in 150 years of history.
This time, it's no different than the other times.
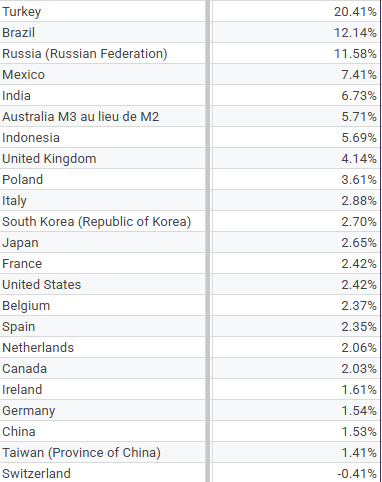
Where can I find a net return after inflation over a 10-year horizon?
My data isn't up-to-date for April, but for March 2026.
Turkey? I'll pass.
But a basket of stocks including Brazil, Russia, Mexico, and India, with a return of around 9.5%, why not?
With such significant differences compared to the dollar's return, exchange rates are stable, allowing interest to be collected without any exchange rate losses.
Want to sell puts on the S&P 500?
Some figures
20 DTE
36% negative periods
22% periods < -2%
8.9% periods < -5%
There is a 91% probability of collecting a premium without being executed on a 20 DTE.
It's possible to improve by introducing a 200-day moving average as a filter.
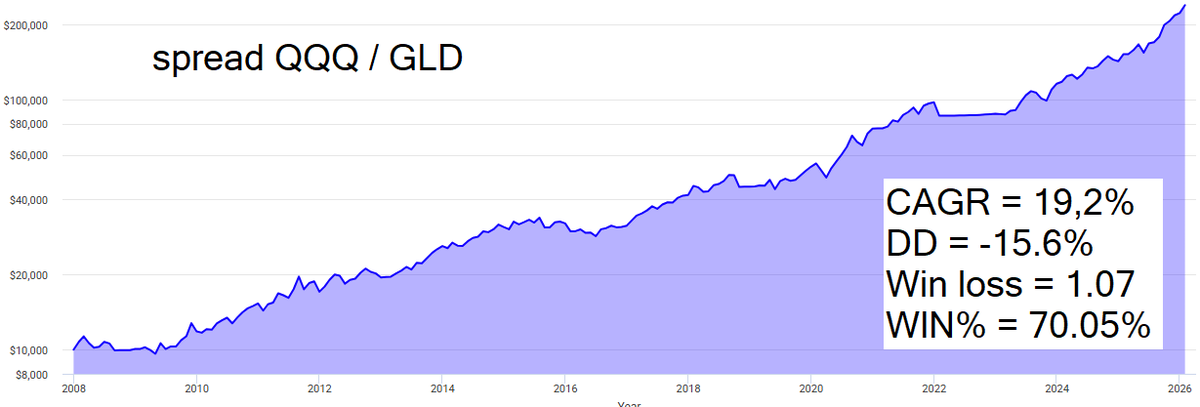
But the Rolls Royce of strategies is to use the 10-year trend, which clearly indicates WHEN YOU SHOULD NEVER SELL A PUT.
If we look at the last 30 years, value creation on the S&P 500 has been very strong. But it's impossible to forget the 13 years in the middle without a new all-time high. 13 years stuck because a put sale at -5% strike price on a 20 DTE went south... The 10-year trend is a key tool that multiplies the probability of a decline greater than 5% by 5.5 times under certain conditions.
make your research about industrial production before and after EURO. you can study germany and netherland against france italy and spain or greece. Take 10 years before 2001 for all the datas and you will understand the drama of europe. Euro destroyed the place because when you cant adjust with the currency the difference of productivity, it is industrial production and wages which are doing the dirty job
EURO is killing Paris stock market, years after years
25 years after its implementation, the sentence is here, undeniable
Economies with abilities to export like NETHERLAND has benefited from the euro
... and economies with inabilities to export like FRANCE have been crushed
Blue color for NETHERLAND
BAR CHART for FRANCE
Spread below in green color
How much excess #liquidity central banks from G25 (90% world GDP) have injected since 5 years to get our lovely #inflation ?
I spent 1 month to get all the datas and figure out a way to evaluate
The tricky part was to put everything together in USD, from the injection of LCU M2 minus the LCU #GDP growth and inflation
I scrap some data LCU from #IMF. Thanks to them
It is not perfect but I decided to average the #USD month by month to have a yearly price and then a 5 years price. There is surely a better way to do but in the end, but not big difference
In the last 12 months central banks from G25 injected in excess 4.15T$... hum hum... very very bad girls... are the poors addicted to lower their spending power or are they just monkeys just good to hope the futur will be better than the past when the opposite can be witness every months ?
In the last 5 years, the excess injection were 11.47T$... 11 Trillions dollars and truth is it will be more in the future because of the after covid and consequences like deflation of M2 for many countries unable to repeat
These numbers are very important because they are highly correlated at 6 months with the trend of SP500
I spent 7 years to study how monetarist inflation spread into risky assets
The guy who masters the trend of inflation, masters the trend of the markets
I failed thousand times to find the adequate ratios of assets... until this year 2025. I got a rotation of 3 assets which match perfectly for decade with the inflation trend
Funny is the official fight for a stable inflation... when in reality, 90% of world #economy get a shot of 4 trillions this year only of fresh new and useless money...
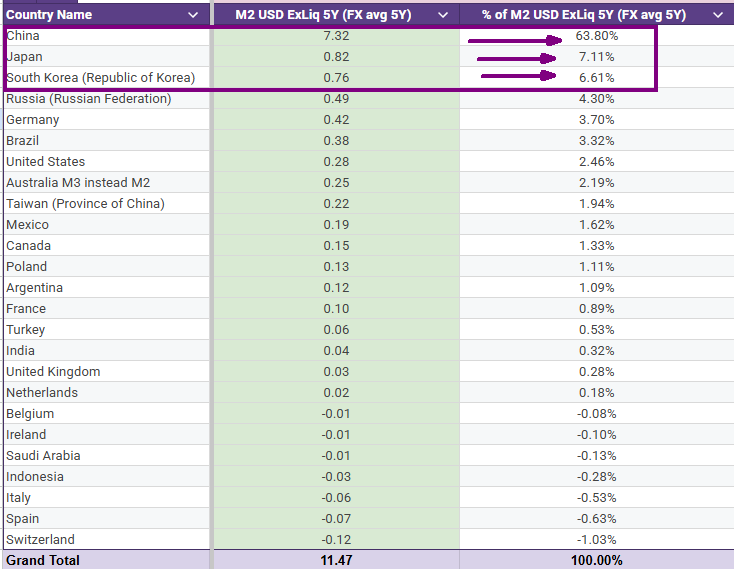
Everybody knows China is around to mess with the world using proxies with genius to get their revenge of queen victoria
But who knows that South Korea is messing badly with 6.6% of the world excess liquidity when their GDP is only 1.6%...
China, Japan and Korea are responsible for 76% of the bad M2 growth in the last 5 years... only 3 countries cheating 7 billions humans. Thank you guys... the world could be nicer if you were not here... but thank you to be here to help me to make my money with your fake inflation
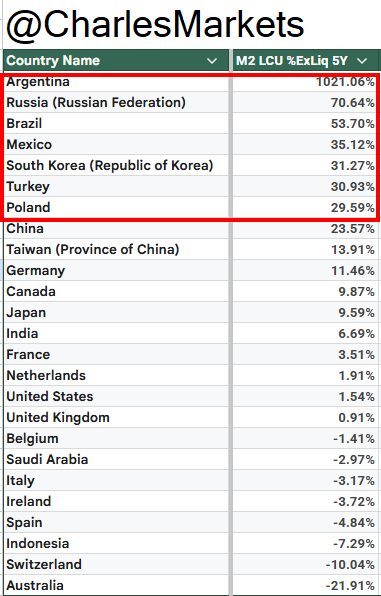
How much excess #Liquidity a central bank need to inflate a country ?
I used the data LCU, local #Currency unit to evaluate all the 25 countries ranking by #GDP for a total of 90% world GDP
I strongly believe 1Y rate of change means nothing in comparaison with the 5Y numbers
I calculated excess liquidity by using the #M2 and the IMF GDP LCU 2025
Below, i got a clear link between an excess liquidity higher than 30% and the #inflation rate
The list of countries implicated by the central bank and their hidden goal of inflation is now available with my ranking
How to use these data ?
First im going to update every month so everybody can get access to the ending game of central banks
And second, we know inflation is the ennemy of a currency. It needs high #InterestRates to compensate high inflation. Each time these countries lower their rate, the currency is weak and at risk
My idea is to spread CHF, with low excess liquidity and local deflation against weak currency of the top list in red color. i m very fond of spread rate 2Y between these countries. I dont see how currencies with high inflation / high excess liquidity could resist against a negative divergence of rates
Let me know how you could use these data
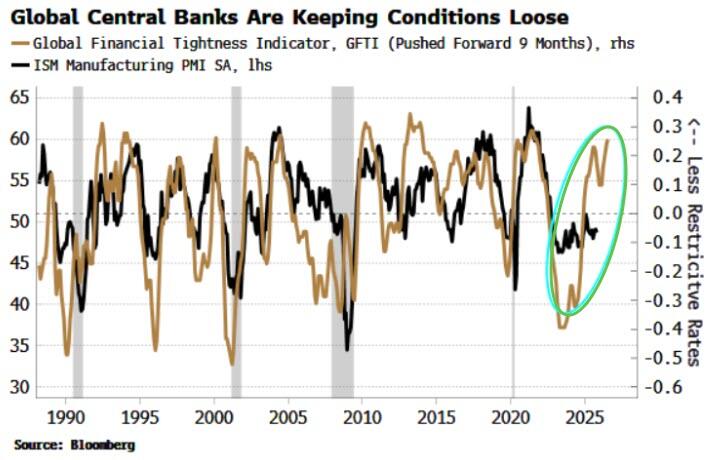
#ISM PMI is blocked since 3 years below 50
#GFTI a pretty good precursor of ISM is diverging deeply since 2025, betting for more growth
The big question is the exact amount of cut rate by the fed to push up ISM or the exact amount of QE is necessary
It is hard to buy risky assets non profitable or #cyclical industrial stocks when nobody seems to be convinced by a new cycle of #GDP growth coming soon...
Today is the end of #QT by the #Fed
Covid Area with all its excess is done
Goldmand sachs Research projections are a modest rise in 2026
It looks like we will witness a big shift from MBS assets to T-Bills in the balance sheet of the Fed
These type of QE are link to #inflation rise most of the time in the past
It should have been positive for risky #assets but...
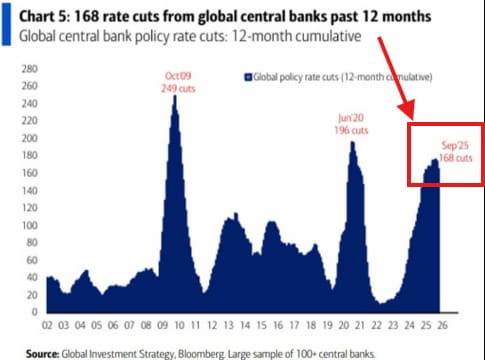
China didnt cut anything this year, only one time in may with 0.1%
And USA cut 2 times with total of 0.50%
And Japan did rate hike 1 time
USA + China + Japan #GDP = 54T$
All these 168 cuts concern only half the world economy even if it is called global #centralbank policy
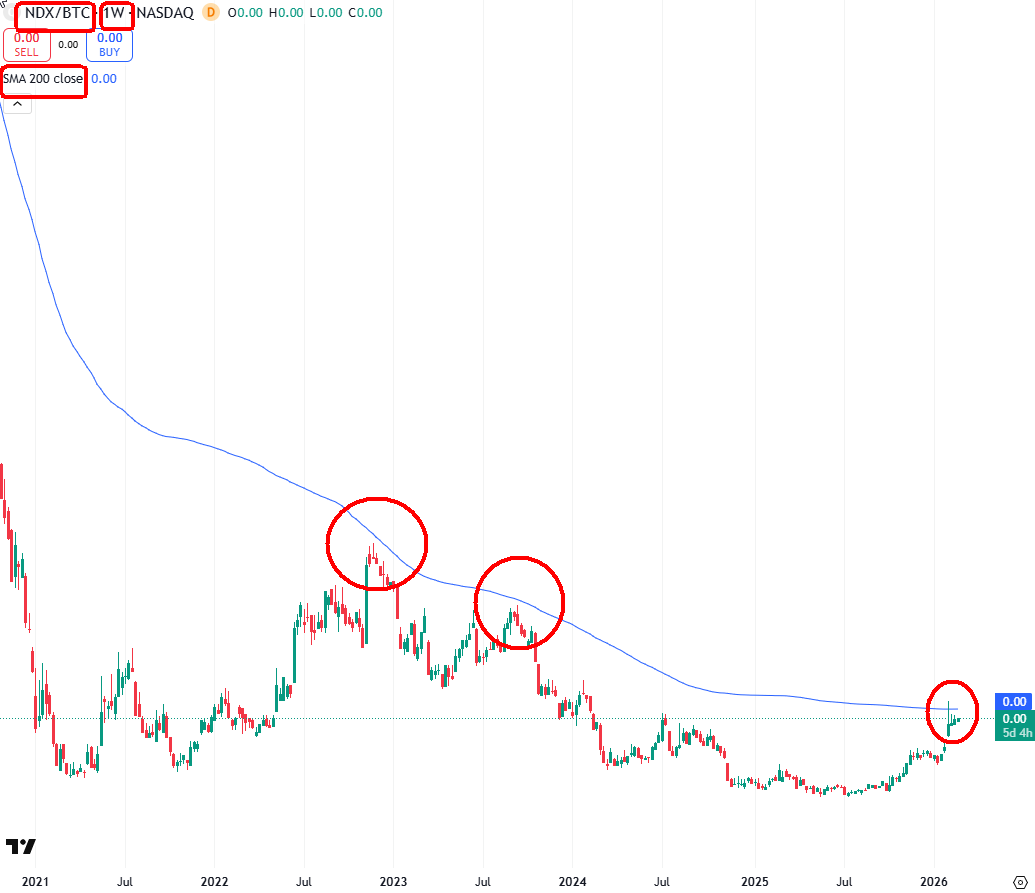
About the storage of #value
January 2020 : correlation between #btc and #qqq was -40%... it was the last time BTC was doing his btc job... since then, correlation is positive with nasdaq at 80% for a few weeks
BTC should be renamed high vol non profitable tech stock, instead of his abused title "savor of the humanity and the poors"... against #BIS and its 50 central banks
Because in 2025, hard fact and truth tell us a different story than the legend : correlation of BTC is north 50% with the GS index non profitable tech in 2025... should be negative... oupsss
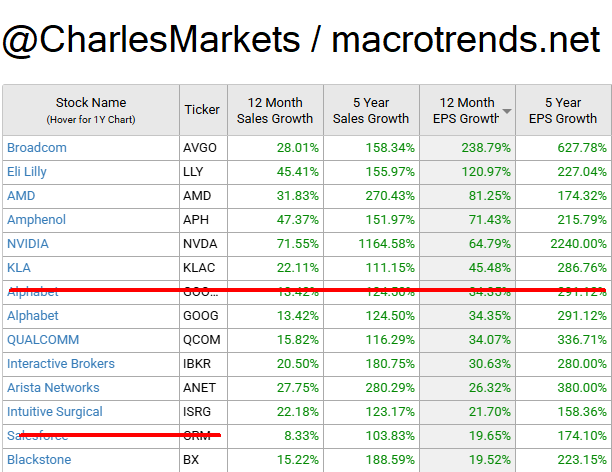
Lets create a basket of high achievers
1 - more than 100B market cap #nyse and #nasdaq
2 - 12 month sales growth > 10%
3 - 5 year sales growth > 100%
4 - 12 month EPS growth >15%
5 - 5 year EPS growth > 150%
And lets compare #gold, BTC and performance of theses 12 companies in one month. Who really will do the job of storage for investors ?
GOLD 4269
BTC 90.500
#AVGO 402.96
#LLY 1075.47
#AMD 217.53
#APH 169.8
#NVDA 177
#KLAC 1159.07
#GOOG 320.12
#QCOM 168.09
#IBKR 65.02
#ANET 130.68
#ISRG 573.48
#BX 144.92