I don't net short with leverage. Nothing against people who do it well, and there are some that do and are very talented. It's just not my strength and not my style. If I'm bearish I go to cash, or hedge spot a little bit. You will see me disappear during those times bc I'm just not trading.
The math is why. Longs can go to infinity, they are uncapped on upside where as shorts are capped. Essentially best case it goes to 0 and you make a 2x.
SNDK did 60x or so in the past year. 50% fall pays you 50% whether you nailed a parabolic top or shorted something like ETH which has already been cut in half if it fell in half now. The short doesn't care how extended the move was. People who've been trying to call tops with levered shorts, well, it's typically an ego thing. More often than not. it's better to short the thing that has been performing like crap anyways. idk what the obsession is with shorting strength repeatedly
Then in equities you have other things that go against you. It's carry. Shorts bleed, you pay the borrow, pay the dividend, fighting stock buybacks, inflation, etc. The timing has to be pretty precise. And then there are naked shorts, where you end up shorting something and end up losing 3-4x the amount you invested. Short MU at $250, it goes to 1k. It happens all the time.
It is so much better to just have a few good plays, and then every once in awhile you find a high conviction bet to really just push to the max. Even for me, most trades I take are pretty consistent, and once a year I hit a trade that makes up like 70% of my years gains bc I knew it was the one. But that's just my style.
Market Wizard Linda Raschke's 12 Technical Trading Rules
1. Buy the first pullback after a new high. Sell the first rally after a new low.
2. Afternoon strength or weakness should have follow‑through the next day.
3. The best trading reversals occur in the morning, not the afternoon.
4. The larger the market gaps, the greater the odds of continuation and a trend.
5. The way the market trades around the previous day’s high or low is a good indicator of the market’s technical strength or weakness.
6. The previous day’s high and low are two very important “pivot” points, for this was the definitive point where buyers or sellers came in the day before. Look for the market to either test and reverse off these points, or push through and show signs of continuation.
7. The last hour often tells the truth about how strong a trend truly is. “Smart money” shows their hand in the last hour, continuing to mark positions in their favor. As long as a market is having consecutive strong closes, look for the up‑trend to continue. The up‑trend is most likely to end when there is a morning rally first, followed by a weak close.
8. High volume on the close implies continuity the next morning in the direction of the last half‑hour. In a strongly trending market, look for resumption of the trend in the last hour.
9. The first hour’s range establishes the framework for the rest of the trading day.
10. A greater percentage of the day’s range occurs in the first hour than was the case in the past, and thus it has become increasingly important to trade aggressively if there are early signs of a strong trend for the day.
11. There are four basic principles of price behavior which have held up over time. Confidence that a type of price action is a true principle is what allows a trader to develop a systematic approach.
The following four principles can be modeled and quantified and hold true for all time frames, all markets. The majority of patterns or systems that have a demonstrable edge are based on one of these four enduring principles of price behavior. Charles Dow was one of the first to touch on them in his writings.
Principle One: A Trend Has a Higher Probability of Continuation than Reversal
Principle Two: Momentum Precedes Price
Principle Three: Trends End in a Climax
Principle Four: The Market Alternates between Range Expansion and Range Contraction
In the world of money, which is a world shaped by human behavior, nobody has the foggiest notion of what will happen in the future. Mark that word – Nobody! Thus the successful trader does not base moves on what supposedly will happen but reacts instead to what does happen.
You are bored because you are not doing side quests.
Life is not just work and lying in bed doing nothing.
Here are 50 side quests every man should complete:
Você alavanca 10x achando que vai ficar rico mais rápido.
Matematicamente, está fazendo o oposto.
Em 1956, um engenheiro da Bell Labs chamado John Kelly Jr. resolveu um problema que ninguém tinha formalizado: qual é o tamanho ÓTIMO de uma aposta?
A resposta mudou cassinos, hedge funds e mercados de previsão. 🧵
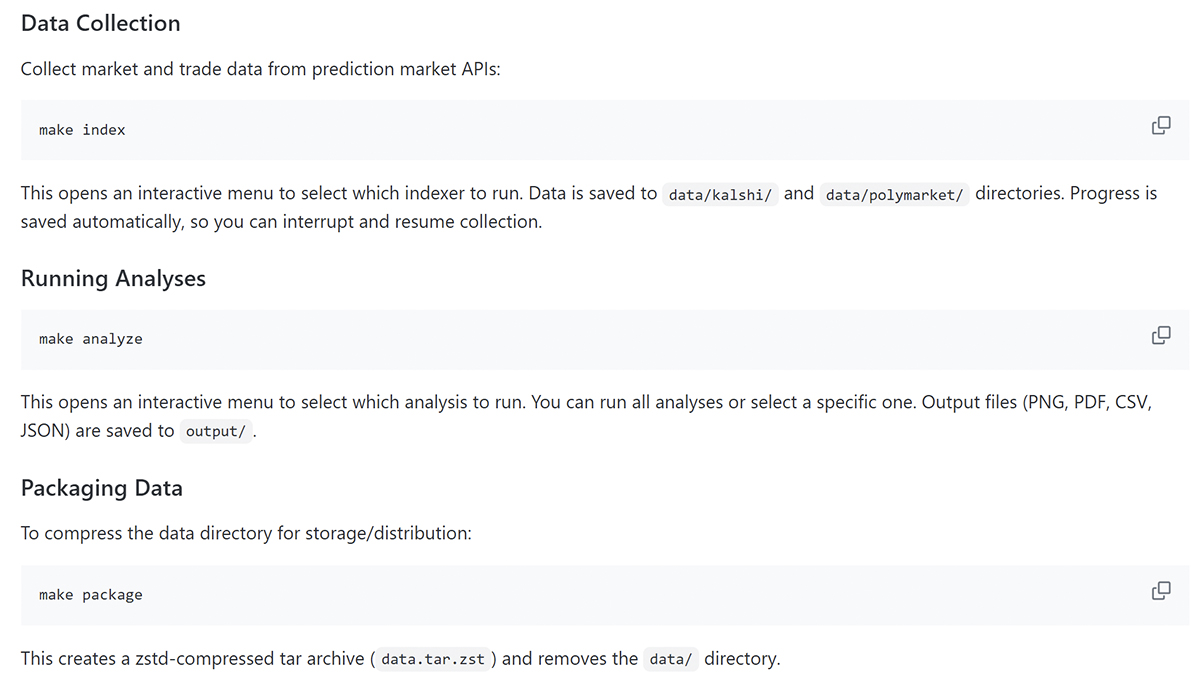
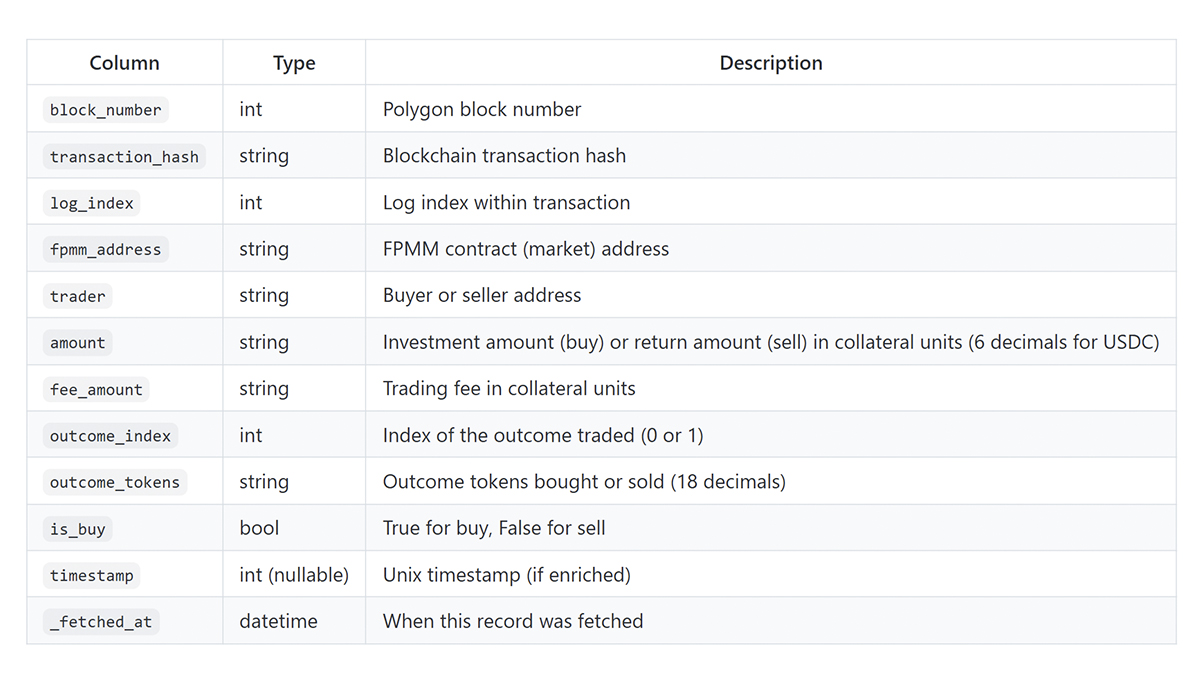
I found the best GitHub dataset for trading on Polymarket
36GB of real trade history from Polymarket and Kalshi - open source and free to use
If you want to build strategies on real data rather than guessing, this is where to start
Jon-Becker/prediction-market-analysis
The largest public dataset of Polymarket and Kalshi trade history. Researchers are already publishing papers on top of it - and you can use the same data to build your own strategies
Repository: https://t.co/HWHDPQwZtF
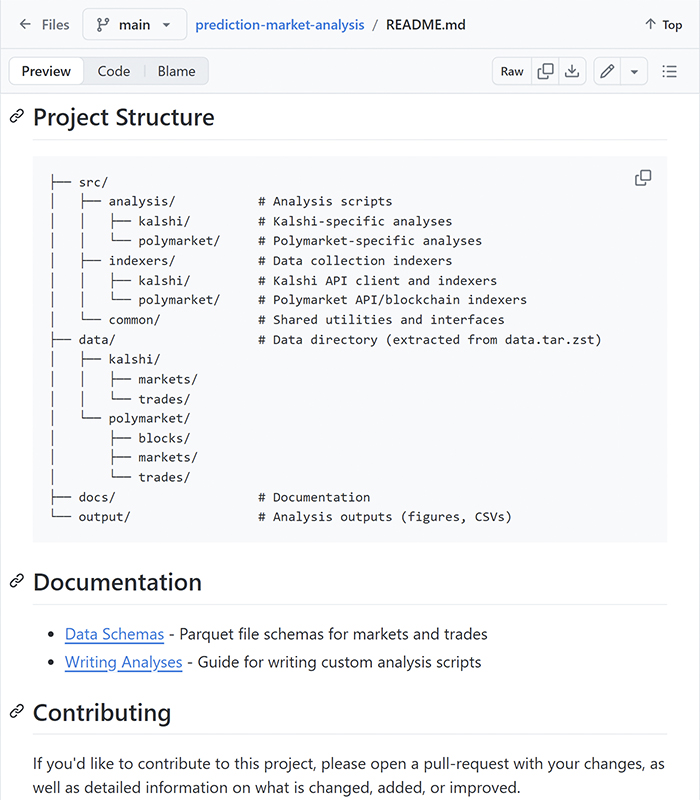
What's inside
> Full trade history from Polymarket and Kalshi
> Market metadata across all markets
> Tools for collecting fresh data via API and blockchain
>Framework for running custom analysis scripts
How to get started
> make setup - downloads and extracts the dataset
> make index - collects fresh data from the API
> make analyze - runs analytics, results saved to output/
Output includes PNG, PDF, CSV and JSON files - ready to use for strategy building
Não consigo entender por que tanta gente ainda não usa o ChatGPT para procurar emprego.
Em apenas 7 dias, consegui 6 contactos para entrevistas, usando o ChatGPT como meu aliado estratégico no recrutamento.
Aqui estão 8 prompts que transformam a busca por trabalho numa estratégia inteligente e estruturada :
5 Stocks I would buy now and hold for the next years.
1. $AMZN
Amazon remains a global powerhouse across cloud infrastructure, logistics, e-commerce, and digital advertising, and is well-positioned to maintain leadership into the next decade.
AWS holds more than 30% of the global cloud market and remains the largest cloud provider in the world. By 2035, AWS is expected to retain this position as generative AI demand explodes.
Generative AI demand is now a multibillion-dollar business, growing at triple-digit YoY rates, with demand outpacing supply. Trainium2 & Trainium3 chips delivered 30–40% better price-performance than Nvidia GPUs.
Amazon’s grocery expansion now covers 1,000+ U.S. cities, targeting 2,300 by year-end. Same-day grocery shoppers show 2× higher repeat frequency, strengthening Prime retention and boosting LTV.
With 250M+ Prime members, Amazon enjoys unmatched customer loyalty. By 2032, Prime memberships could double, supported by global expansion and bundled services.
Amazon’s advertising business has surpassed a $70B annual run rate, rivaling YouTube in scale, but with higher ROI due to its closed-loop commerce data. By 2035, ads may rival AWS as a core cash flow driver.
With one million robots deployed globally, Amazon has evolved from traditional logistics efficiency to AI-driven commerce orchestration, giving it one of the most advanced operational infrastructures in the world.
Amazon is expected to become the first company ever to surpass $1 trillion in annual revenue by 2029, powered by a diversified ecosystem of cloud, ads, logistics, grocery, and AI.
O Epicentro Silencioso da Fractura Global 🫣
( digam lá que o título não é catita) 😂🤣
A yield a japonesa a 30 anos acaba de ultrapassar os 3,146% — o nível mais elevado alguma vez registado.
Mas isto vai muito além da política monetária japonesa. É um sinal claro de que algo estrutural está a ceder no sistema financeiro global.
Não, não estou a falar de um movimento marginal de mercado, é algo mais profundo e tentarei explicar…
1. Não é apenas sobre o Japão — é sobre o que vem depois ( efeito dominó)
Durante décadas, o Japão foi o garante do “mundo velho” da deflação e dos juros ultra-baixos ( penso que já disse isto mais de um cento de vezes, o dinheiro grátis acabou,pelo menos da forma que o conhecemos )
O BoJ manteve sob controlo a parte longa da curva de rendimentos através do Yield Curve Control (YCC).
Essa política tornou-se um alicerce silencioso da arquitectura financeira global — um funding barato e previsível que alimentava o risco global via o carry trade ( já expliquei o que era)
Esse alicerce está agora a ruir. A subida das yields japonesas não é um acaso técnico. É um reflexo de que o BoJ está a perder — ou a abandonar — o controlo do extremo longo da curva, para já não sabemos qual será a próxima jogada.
2. O carry trade global está a desfazer-se silenciosamente
O Japão sempre foi o “banco central do risco global”. Emitia liquidez barata em ienes, que era reciclada em activos de maior risco noutras “jurisdições”
Essa arbitragem — a base do carry trade — está a colapsar.
Basta olhar para os números:
• JGB a 40 anos: 3,62%
• Retornos ajustados ao câmbio das Treasuries estão a tornar-se negativos
• A liquidez está a ser drenada em todos os centros financeiros — de Tóquio a Frankfurt e Wall Street
Estamos a assistir a um redesenho das fundações dos mercados globais.
3. Os EUA já estão a sentir o efeito dominó
Nos Estados Unidos, a curva de rendimentos começa a empinar:
• 2Y (4,02%) — o mercado ainda acredita em cortes da Fed
• 10Y em alta (4,577%)
• 30Y acima dos 5%
Este empinamento não é sinal de crescimento. É escassez.
Faltam compradores de duration.
Os grandes compradores tradicionais — Japão, China, fundos de pensões europeus — estão ausentes ( estão líquidos)
A Fed, consciente do risco sistémico, está a intervir discretamente:
• Linhas de swap
• Programas de recompra
• QE disfarçado
Tudo para evitar o colapso dos leilões do Tesouro.
4. Esta não é uma rotação de ciclo. É uma transição de sistema.
O que se passa com o Japão é apenas o primeiro acto de uma reprecificação estrutural da dívida soberana global.
• O Japão quebra primeiro — o elo mais vulnerável, pela rigidez prolongada da sua política monetária
• A Europa segue — spreads entre obrigações core (Alemanha) e periféricas (França, Itália) voltam a abrir, até a Euribor já deu sinais a maturidades mais curtas ( 3/6 e 12 meses)
• Os “ Estates” serão os últimos — mas não os menos afectados, dado o seu grau de dependência do financiamento externo
Cada ponto base adicional nas yields japonesas actua como multiplicador de volatilidade global: em FX, crédito, derivados de taxas.
A arquitectura que sustentava os mercados desde 2008 está a ceder — não no epicentro, mas nas margens. E isso é ainda mais perigoso, porque é “ silencioso “ e inaudível “ para a maior parte dos analistas…
Conclusão
A bolha da dívida soberana não está a rebentar com estrondo — está a desfazer-se silenciosamente, pelas franjas do sistema.
O Japão é o barómetro. A sua incapacidade (ou desinteresse) em continuar a comprimir os juros longos revela o limite funcional da política monetária moderna.
Se o Japão já não consegue controlar a sua curva, quem conseguirá?
Vamos aguardar..
Tenho andado ausente, mas achei pertinente partilhar estes dados . 😘
First 22 minutes are a speedrun on premiums, funding rates, open interest, and all that stuff.
Explanation + framework for trade ideas.
Pinned comment is a more detailed article.
GM.
https://t.co/X3JKw7jHcA
Como o mercado anda na senda de analisar problemas, do lado de lá do Atlântico, hoje trago mais um e tentarei explicarei e sustentar a minha analise...
O post é grande, quem quiser lê, se não scroll é sempre um bom aliado nestes momentos... 😅😂🤣
Liquidez ( ou a falta dela) no Mercado de Títulos dos Estates, está em niveis recorde, quem irá comprar?!? E porquê?
1. Crescimento da Dívida
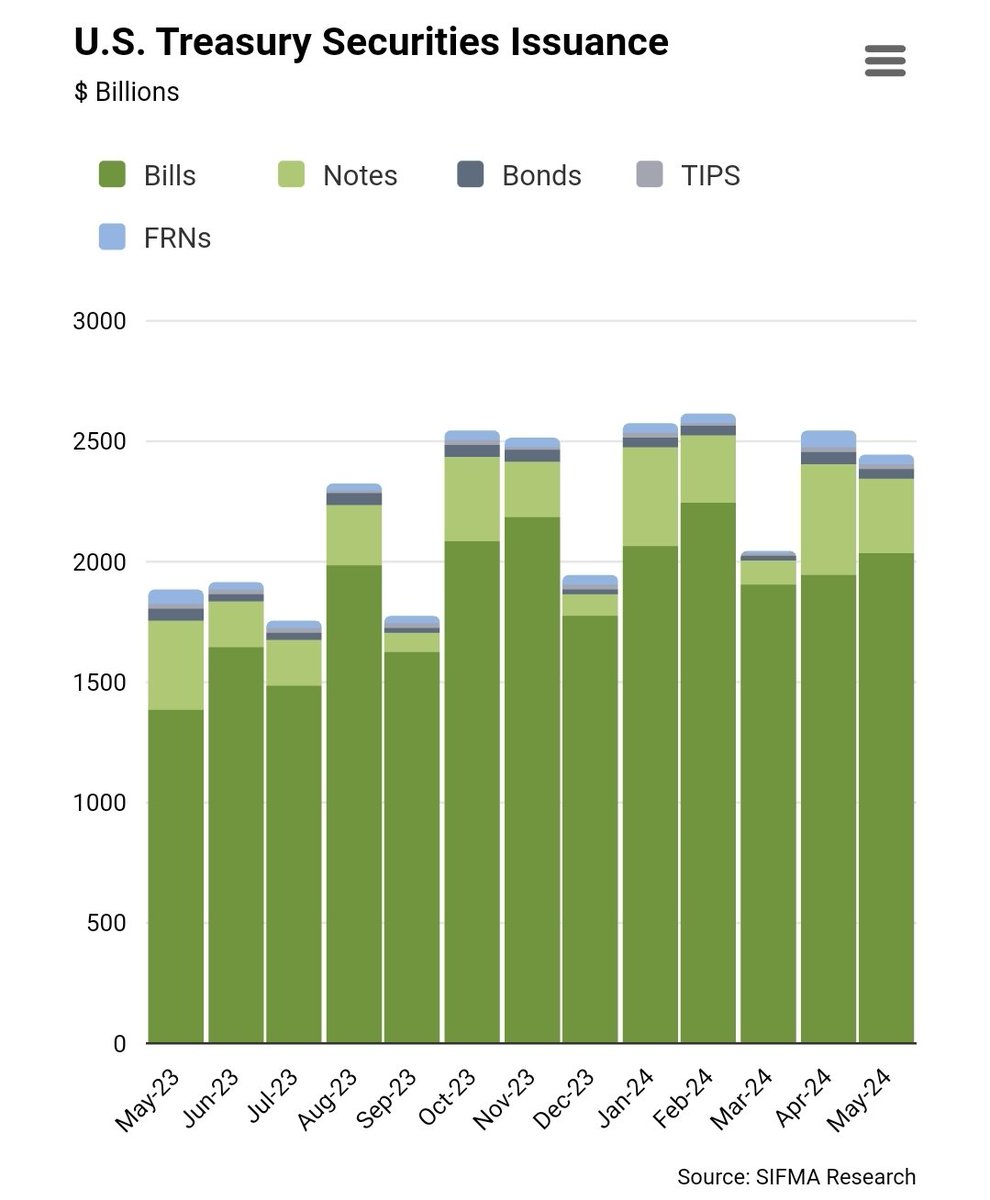
O Tesouro continua a emitir grandes quantidades de dívida para financiar despesas deficitárias, aumentando significativamente o tamanho do mercado de títulos, basta analisar o primeiro grafico... Os títulos do Tesouro em circulação são de 27T, acima dos 12 T de apenas uma década atrás. A emissão está em níveis recorde e a dívida em circulação deverá atingir 48T até 2034, de acordo com o Congressional Budget Office.
2. Deterioração da Liquidez
A capacidade de negociar títulos sem grandes alterações de preço tem vindo a piorar. A volatilidade aumentou desde que a Reserva Federal começou a elevar as taxas de juro para controlar a inflação, como se diz na gíria, a manta não estica, ou tapas os pés ou a cabeça..
3. Capacidade de Intermediação Limitada
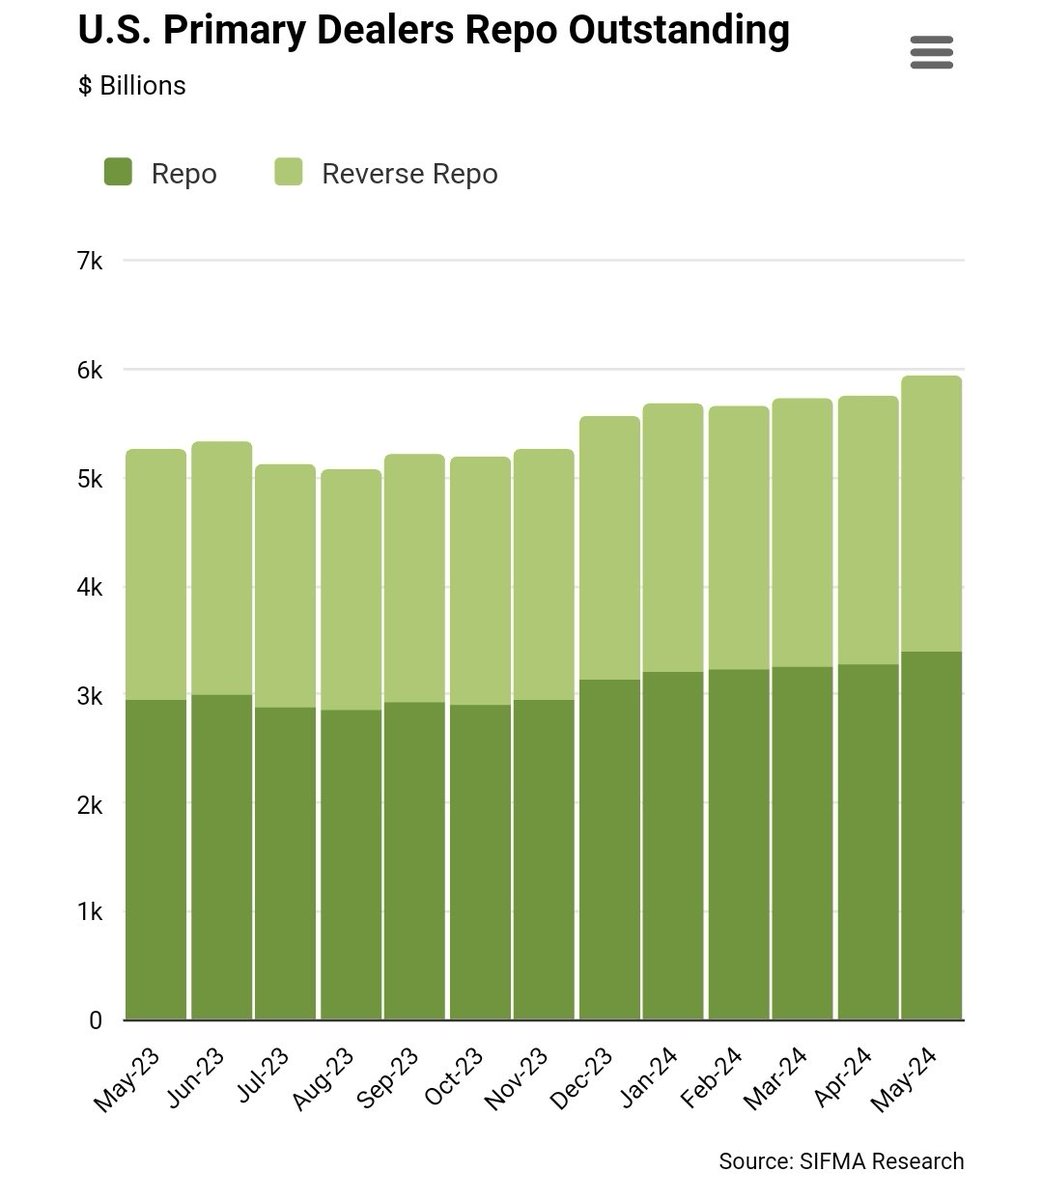
Os corretores enfrentam dificuldades em acompanhar o aumento da emissão de títulos devido aos maiores requisitos de capital, que desencorajam a manutenção de grandes posições e por periodos longos, o que obrigou o FED a alterar as politicas de recompra e compensação de caixa que deve entrar em vigor até o final de 2025, e a compensação de recompra deve entrar em vigor até 30 de junho de 2026.
4. Curva de Rendimentos Invertida
A dívida de curto prazo tem rendido mais do que a de longo prazo, desincentivando os bancos a manterem títulos com maior duração, e por menos tempo..
5. Vulnerabilidades
Há preocupação de que vulnerabilidades anteriores, como as observadas em março de 2020, possam reaparecer em momentos de alta volatilidade.
6. Impacto da Volatilidade
Estudos indicam que a volatilidade dos rendimentos dos títulos é a principal causa da variação na liquidez, exigindo um maior uso dos balanços dos negociadores para intermediar os mercados e para isso basta analisar os fechos dos trimestres dos primcipais bancos, já coloquei diversas vezes esse gráfico.
7. Risco de Falta de Procura
Existe o receio de que, se a procura por novos leilões de títulos do Tesouro diminuir, a liquidez possa deteriorar-se drasticamente, levando a problemas significativos no mercado.
Estas preocupações destacam a importância de reformas e medidas para melhorar a liquidez e prevenir interrupções no mercado de títulos dos EUA, isto se não querem ter problemas a curto prazo...
Talvez seja uma análise precoce, mas fica a nota, digna de registo na minha opinião
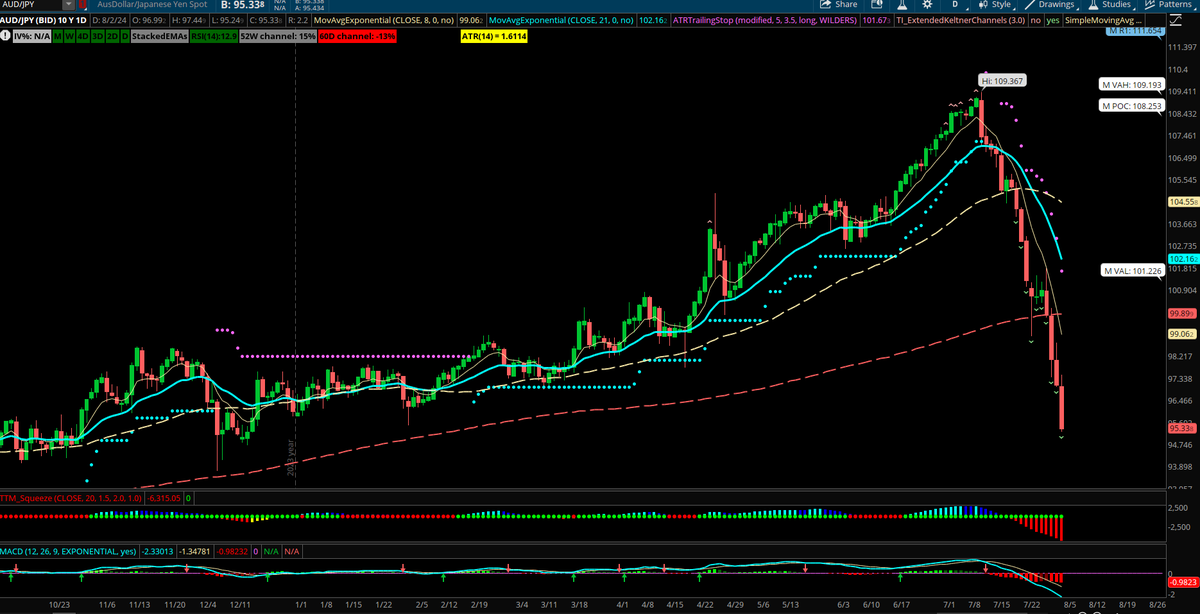
Alot of people asking what caused the stock market selloff.. here's the answer.
Its never just one reason with this type of move, more of a domino effect that has been brewing. But you can point to the Yen 'carry trade' as the culprit.
Just look at the Aussie/Yen pair.. gave up the whole years gain.
Explanation in thread below👇 🧵
Youtube algo recommended me a video on a failed trader this morning. I watched a man cry talking about the money he's borrowed from family, loans he took out, all the debt he now has, his trading addiction, and much more.
I had multiple people reach out to me this week and tell me they were taking a break from or quitting trading. My ref links (which once were 'decent') are now mostly dead. I had friends who made 100K~ during the COVID bubble and are now at zero.
All these traders, wiped out. And we say traders, but behind every trader is a person, their family, their struggles, promises they made to others, and much much more.
Trading isn't a game nor is it something to be taken lightly. Profits shouldn't be taken for granted, they should be transferred to your bank. As much as it can creep in, there's no place for emotion such as euphoria or fear. It's just you, your level of interest, your stop loss, and your take profit. It sounds generic, but it's so easy to deviate from your plans on any given day.
I predicted 62K-> 67.5K, but I got front ran by $130 on my entry.
I predicted 63.2K -> 70K~, but I got front ran by $250 on my entry.
I predicted these moves on $BTC, but didn't make any money. That must have been extremely frustrating, don't you think? Shit like this makes you vulnerable to mistakes and you have to recognize that.
Most respect the transparency, but some press the issue even further and clown me. "No coiner" they say, "we're going to leave you behind", they taunt me. At this point, weaker minds would succumb to the overall negative situation (slight front runs, missing out on good money, taunted by peers, etc). Undisciplined traders will FOMO into shitty positions, they will deviate from their plan and winning strategies, rack up losses, lose confidence, and the list goes on. I know all this because I've been there before, only years of experience has helped me overcome demons like these.
With all that piled on me over the past week, I stayed patient, and captured +1.5R in a couple minutes yesterday on the Trump speech liquidity trade. I stayed true to my strategies and did what I do best. I didn't allow the market (or the trolls to a lesser degree) to impact my decision making.
I know some people probably view me or how I respond to some questions as pompous.. like I'm above the trades people ask me about or I'm not willing to give them the time of day to talk about current prices. I'll respond with lines like "I post trades when I have them" or "I don't care what price is doing atm, I just wait for my levels". Hopefully you're beginning to understand why I respond in that nature. It's to protect me from deviating from my own plans.. it's to maintain the steel trap. I can't entertain you because I can only entertain trade ideas I develop myself. They have to be formed from scratch. And I truly don't care where price currently is, I only care when a setup presents itself and at what prices I seek to do business.
The point of this novel is that trading is hard. Proper technicals are hard, the discipline required is hard, patience required is through the roof, everything about it is difficult. It isn't something you should take lightly or play around with. CT makes it look easy.. a highlight reel of successful traders (or larps), hindsight screenshots galore, million dollar PnL's, but the reality is at the start of this tweet. Most struggle, fail, or win for a short amount of time (showing you the wins), and then lose it all (disappearing without a word). The illusion of everyone succeeding is just that, an illusion.
I come from a middle class (or slightly lower-middle class) family, never really had money. I started with a $2500 loan from a friend and family. I didn't have any Bitcoin from old poker sites or any shit like that. Pretty sure I started with like 0.2 BTC or something. And I won't pretend all my gains were trading.. there were ICOs, ref links, groups, etc., but I've proven enough over the years that I can remain disciplined and provide profitable setups amidst an endless stream of euphoria, headlines, and people flashing +2 mil PnL trades around me.
This tweet isn't about patting myself on the back though. It's about showing you guys the mindset you must have to succeed. You HAVE to stick to your setups, you HAVE to take profits when they're available, you HAVE to cash out and change you and your family's lives for the better when you have the chance to.
Remove the stresses from your life and you will trade so much better! If you're constantly "ALL IN", you will end up with zero. You always see me pushing for profit taking and cashing out and I don't give a flying fuck if price goes up without me or whatever stupid shit some crypto maxis reply in the comment section. I'll take a better life for my family over a Bitcoin every single day of the week. I maybe recognize one or two reply guys that have stuck with me for years (they aren't rude enough to block, but love to chirp me on occasion). All the others disappeared over time (likely failing to become successful traders).
They say trading is PvP, but it's more like you versus you. If you can TRULY block out the noise, employ a mostly winning strategy, and take profits rather than be greedy, you can be successful. Best of luck.
I take more than 40 supplements a day.
At 41, my biological age is just 27.
If this picture makes you cringe, you need to understand the science behind why it works.
A thread 🧵
Stretching has a calming effect on our bodies and minds.
Do this routine to unwind your muscles this weekend:
- Six stretches in a row.
- 3-4 sets.
- Rest 10-30 seconds between stretches.
Saturday:
1 - Hip Flexor Stretch [ Hold 30-120s] (0:06)
- Start: One foot is placed on an elevated surface behind you (couch, bench, chair) or pressed against the wall, the other is in front of you.
- Straighten your torso and hold.
2- Cobra Stretch [Hold for 30-120s] (0:15)
- Start: Lying on your stomach, hands flat in front of you, arms bent like a push-up.
- Use your hands to straighten your arms and push your torso off the floor, bringing your head as high as possible.
- Look up and hold.
3- Dynamic 90-90 Rotations [10 reps /side] (0:24)
- Start: Sitting on the floor, knees bent in front of you with feet flat on the floor.
- Rotate your legs to have them both touch the floor.
Rotate to the other side.
- This stretch is dynamic - Repeat 10-20x.
4- Open Book Stretch [10 reps/arm] (0:32)
- Start: Lying on your side, arms in front of you, knees together.
- Rotate your arms to touch the floor on the other side and hold (Open book.)
- Rotate back to the starting position (Close book.)
- Ensure your knees stay together and on the ground while rotating.
- This stretch is dynamic - Repeat 10-20x.
5 - Kneeling Back Rotations [10x/side] (0:39)
- Start: Knees and one hand on the floor.
- Rotate your arm to point toward the ceiling or, as close as possible to that position, hold it at the top.
6- Seated Toe Pointing [20 reps] (0:45)
- Start: Sit on the floor with your legs straight ahead.
- Point your toes forward and hold for 2 seconds
- Pull toward you and hold for 2 seconds.
Sunday:
1- Kneeling Neck Stretch [30-120s] (0:55)
- Start: Hands and knees on the floor.
- Lift your chin as high as possible.
- Do not force it any higher than you can reach.
2- Lying Prone Around The World [10-20 reps] (1:03)
- Start: Lying face down on the floor, arms straight by your sides, palms facing sideways.
- Rotate your arms to have them ahead of you with your palms facing the floor.
- Return to starting position.
- Repeat 10x
3- Butterfly Pose [30-120s] (1:11)
- Start: Sit looking ahead while holding both feet flat together.
- Push your legs apart with your elbows and lean forward.
- Hold at the bottom.
4- Sliding Lat Stretch [30-120s] (1:19)
- Start: Hands and knees on the floor.
- Slide one hand as far forward as possible with your palms facing the ceiling.
- Hold and repeat on the other side.
- Straight arm = greater stretch.
5- Pigeon Stretch [30-120s/leg] (1:28)
- Start: Hands and knees on the floor.
- Straighten one leg toward the back and cross the other in front of you.
- Slide as far forward as possible.
- Hold.
6- Dynamic Sliding Chest Stretch [10-20 reps] (1:36)
- Start: Sit on the floor with your hands behind you, arms straight.
- Lift your hips off the floor and slide as far forward as possible while keeping your hands on the floor.
- Slide back to the starting position.
This stretch is dynamic - Repeat 10-20x.
//
Let the stress dissolve out of your muscles with these stretches. You'll feel much calmer by Sunday evening.
If you want to follow a guided stretching plan to calm your body and mind, check out the 28-day routine at The Online School of Exercise.
Decidir entre comprar e alugar uma casa é uma das decisões financeiras mais importantes que alguém poderá enfrentar.🏡💵, então vou tentar ajudar na tomada de decisão...
As duas opções têm vantagens e desvantagens significativas, e a escolha certa depende de vários fatores pessoais e financeiros , irei apenas focar nos financeiros.
Cada caso é um caso e apenas quero demonstrar como podem fazer as contas, é relativamente simples e não ciência aeroespacial ..
As métricas que usei são ilustrativas, e apenas usei as que penso que sejam mais adequadas, quero apenas com este post "despertar" para compreensão dos cálculos e como podem tomar as decisões com informações adequadas a cada caso .
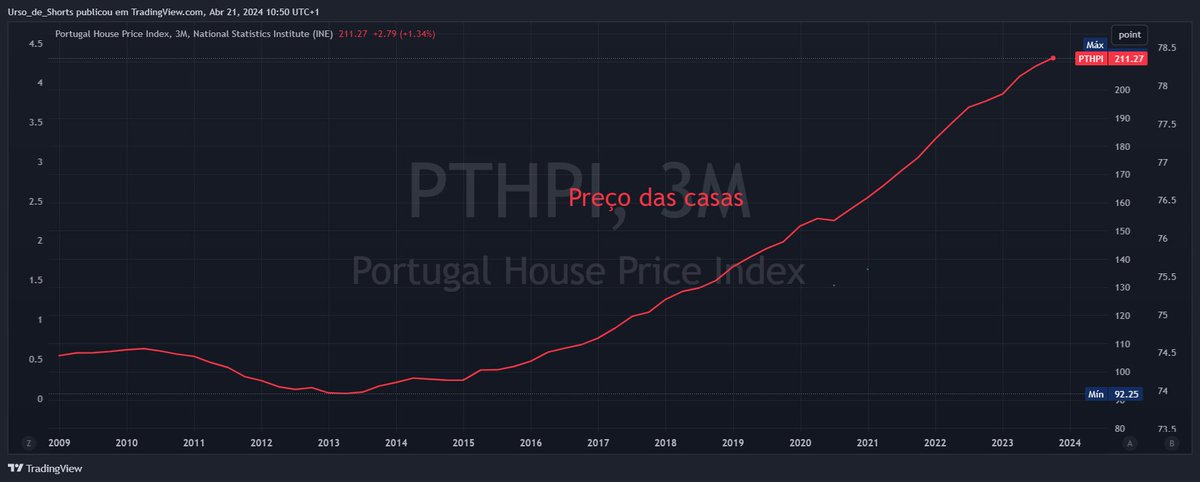
Um dos principais indicadores usados para ajudar nessa decisão é o rácio preço/arrendamento. Este rácio compara o custo de comprar uma casa com o custo de alugá-la, utilizando índices de preços.
Em Portugal, por exemplo, este rácio é calculado dividindo o índice nominal de preços da habitação pelo índice de preços das rendas habitacionais.
Um rácio mais baixo favorece a compra, enquanto um rácio mais alto favorece o aluguer ( ignorando o factor taxas de juro)
Analisem este gráfico com 3 variáveis, % casa própria, taxa de juro e rácio compra/aluguer
Conclusões
As taxas de juro desempenham um papel crucial na determinação do rácio preço/arrendamento. Se as taxas de juro estiverem baixas, os custos de financiamento para a compra de uma casa serão menores, o que pode tornar a compra mais atraente em comparação com o aluguer. Por outro lado, se as taxas de juro estiverem altas, os custos de financiamento serão mais elevados, o que pode tornar o aluguer uma opção mais favorável.
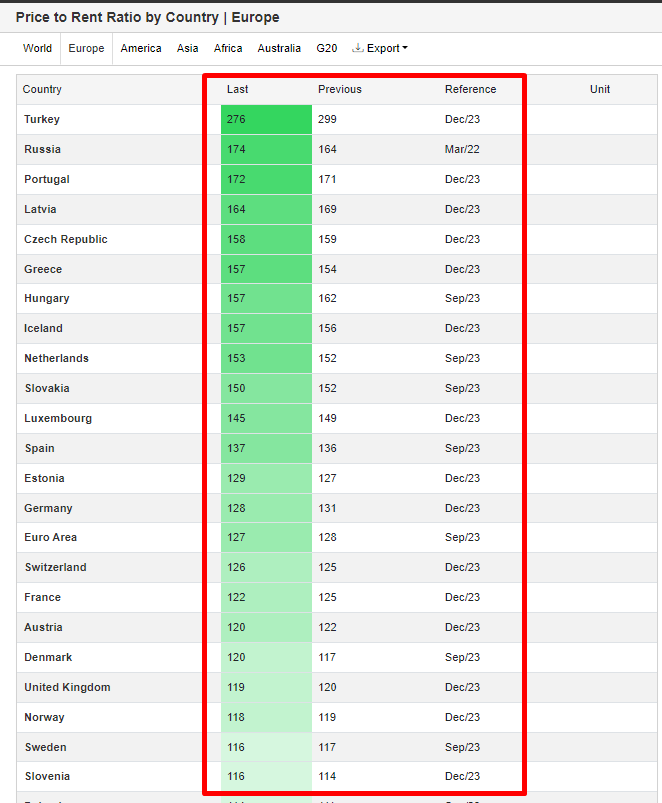
A titulo de curiosidade deixo o valor dos Rácio Preço/Aluguer em alguns países
Por exemplo, vamos considerar um cenário com taxas de juro baixas .
Se o rácio preço/arrendamento for de 150 e o custo mensal do aluguer for de 1000€, enquanto o custo mensal da hipoteca para uma casa comparável seria de 1500€, incluindo impostos, seguros e manutenção, isso resultaria em um rácio aluguer/compra de 0.67 (1000€ / 1500€).
Agora vamos calcular a diferença entre os 2 cenários
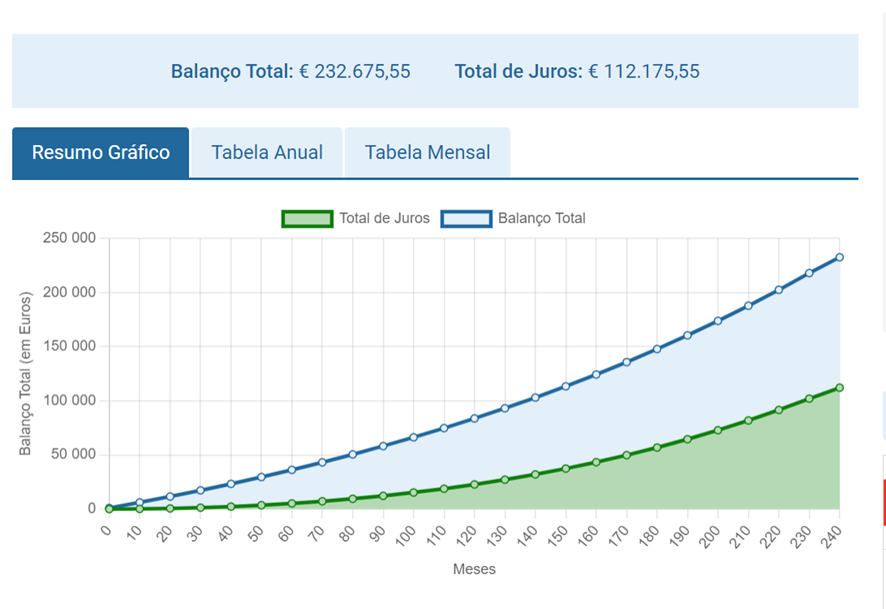
Se investirmos a diferença mensal entre o custo de aluguer e o custo de compra, que é de 500€ (1500€ - 1000€), a uma taxa de retorno anual de 6%, ao longo de 20 anos, essa diferença mensal investida resulta num valor acumulado de aproximadamente 232.675€( juros compostos )
Agora vamos fazer o mesmo exercício para compra
Também é relevante considerar a valorização do imóvel ao longo do tempo, o que pode afetar positivamente ( em principio) o retorno sobre o investimento na compra de uma casa.
VF = VP * (1 + i)^n
FV é o valor futuro da casa após 20 anos.
PV é o valor presente da casa (200.000€ neste caso).
r é a taxa de valorização anual (0,03 neste caso, ou 3%).
n é o número de anos (20 neste caso).
Portanto, após 20 anos, o valor da casa seria aproximadamente 361.222€, considerando uma taxa de valorização anual média de 3%. Isso significa que o investimento inicial de 200.000€ teria se valorizado para cerca de 361.222€ ao longo do período de 20 anos.
Portanto, neste exemplo, as taxas de juro baixas tornam a compra mais atraente financeiramente, especialmente quando combinadas com um rácio preço/arrendamento que favorece a compra se as taxas foram altas o rácio tenderá a diminuir
A resposta em comprar e/ou alugar é sempre difícil de dar e devemos ter em conta os seguintes fatores:
Taxa de Juros ( variáveis/ fixas)
Investimento do diferencial e rentabilidade associada
Valorização do imóvel
Existem mais fatores "pessoais" e que não são quantificáveis , aí entra a vossa analise pessoal
Como a literacia financeira é baixa em Portugal, muitas vezes essa diferença não é investida , o que não rentabiliza o excedente ( prestação- aluguer) , pelo que a decisão de comprar poderá ser a melhor opção e nos últimos 20 anos foi a mais rentável ( Portugal)
Bom domingo 😙