Launch day is here! 🚀 Meet Ada, the world's first AI data analyst.
It turns messy data into professional reports in minutes.
Built for anyone who works with data:
✅Upload data from any source
✅Generate polished reports instantly
✅Run predictive scenarios automatically
✅Adapt to all industries
▶Watch how Ada solves your data headaches, then get started at https://t.co/bZjZ58Wgw1
#AI #DataAnalytics #LaunchEvent #Agents
Everyone is talking about AI Agents.
But an agent without data is just another chatbot.
The real breakthrough happens when AI can:
→ Understand your data
→ Generate charts automatically
→ Find insights
→ Recommend actions
That's when AI becomes a teammate.
#AIAgents#AI #DataAnalytics #BusinessIntelligence #FutureOfWork #ChartGenAI
Stop spending hours polishing charts by hand.
The future of presentations is simple: type your data, get the deck.
Built with https://t.co/6faZS6Ih5R.
#ChartGenAI#AIProductivity#PowerPoint
Your data shouldn’t look like homework.
https://t.co/6faZS6HJgj turns messy numbers into clean charts and presentation-ready slides, so your ideas look as sharp as they are.
Messy Data → Ready Slides.
#ChartGenAI#AIProductivity#PowerPoint#DataVisualization#AIDesign
2020: "We need to hire."
2026: "We need better AI."
The new startup stack:
1 human + AI agents = an entire team.
The leverage gap has never been larger.
#AI#Startup#AIAgents#BuildInPublic
The biggest AI upgrade of 2026 isn't a new model.
It's memory.
Imagine uploading data and not having to explain:
• your preferred chart styles
• your reporting standards
• your workflow
AI is evolving from a chatbot into a long-term collaborator.
👇https://t.co/0HqWiKA99v
#AI #ChatGPT #Claude #Gemini #AIAgents #FutureOfWork #Productivity
The best AI tools don’t look magical.
They just remove the work nobody wanted to do.
ChartGen AI turns messy data into client-ready slides before the meeting starts.
#ChartGenAI#AITools#PowerPoint#DataViz
Everyone talks about AI generating content.
With AI, they can be created together—from raw data to executive-ready insights in minutes.
That's what we're building at ChartGen AI.
📊 Generate charts
📑 Create reports
🎯 Build presentations
🤖 Powered by AI
Stop formatting. Start understanding.
#AI #AIAgent #DataAnalytics #BusinessIntelligence #DataVisualization #GenerativeAI #Productivity #ChartGenAI
The next AI war is not model vs model.
It is wallet vs search box.
OpenAI is moving toward financial data.
Google is moving deeper into search, email, docs, and video.
I used ChartGen AI to turn the trend into a visual PPT breakdown.
Trends move fast. Charts move faster.
#AI #ChatGPT #GoogleAI #gemini_ti #ChartGenAI #AIPPT
Stop spending hours polishing charts by hand.
The future of presentations is simple:type your data, get the deck.
Built with ChartGen AI.
#ChartGenAI#AIProductivity#PowerPoint
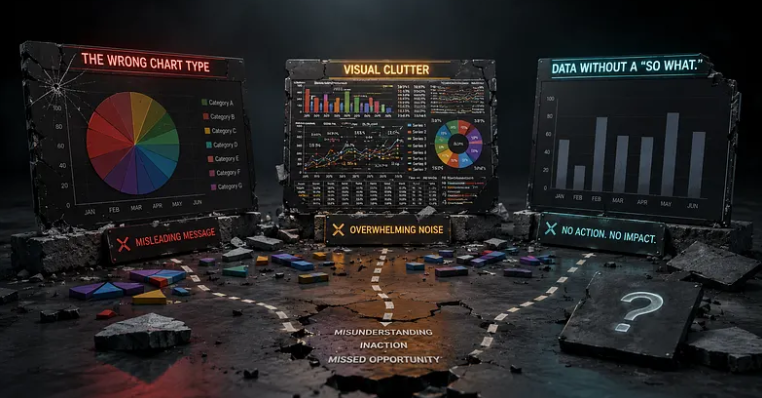
Bad charts don’t just confuse people.
They manipulate decisions.
Most dashboards look “professional” while quietly telling the wrong story.
If your chart choice changes the conclusion, your data isn’t objective anymore.
Read the full blog: https://t.co/R9JHy1PFbV
Charts in the blog are made by https://t.co/gm8P7H5KOb
#DataViz #Analytics #AI #BusinessIntelligence #ChartGenAI
@aaliya_va Exactly. The shift is from “using AI” to actually collaborating with it.
When agents can handle context, coordinate tasks, and proactively assist, they stop feeling like software and start functioning more like digital teammates.
AI Agents are evolving from assistants into real digital teammates. 🤖⚡
Less time managing workflows. More time making decisions.
From raw data → insights → presentation-ready reports in minutes. 📊
#AIAgents#AI#GenerativeAI#FutureOfWork#Automation#DataAnalytics #Productivity #LLM #ChartGenAI
I stopped building charts manually.
No more fixing colors.
No more adjusting layouts.
No more staring at messy spreadsheets.
AI agent turns raw data into clear charts in seconds.
Try it: https://t.co/6faZS6Ih5R
#AI#DataVisualization#Productivity#Analytics
@fabiolauria92 Totally agree.
A dashboard is only valuable when it shortens the distance between “seeing” and “deciding.” Raw metrics are easy to generate — actionable context is the hard part.
Most dashboards don’t fail because of bad data.
They fail because insight never reaches action.
That’s the real “last mile problem” in analytics:
• Reports get ignored
• Stakeholders still ask for explanations
• Teams spend more time presenting than deciding
The best data workflows don’t just visualize numbers.
They make the takeaway instantly obvious.
That’s exactly where AI-native reporting is headed.
Read the article👇
https://t.co/N5F8x3yube
#AI #DataAnalytics #BusinessIntelligence #DataVisualization #Analytics #ChartGenAI
Dashboards shouldn’t feel like messy spreadsheets.
So we upgraded ChartGen AI.
Now you get:
✅ Cleaner dashboard layout
✅ Smarter color schemes based on your query
✅ Key insights highlighted automatically
✅ Thematic tabs for better project organization
✅ AI Edit for any historical version, not just the latest one
Try ChartGen AI: https://t.co/gm8P7H5KOb
#aigenerated #agent #Automation #productivity #analyticss #FutureOfWork
@SaniAiTech Yeah — the shift is subtle but important.
People used to ask AI for answers.
Now they're starting to build processes around collaborating with it.
AI agents are no longer just chatbots.
They’re becoming digital coworkers: researching, analyzing, reporting, and turning work into action.
The next productivity shift won’t be “ask AI.”
It’ll be “work with AI.”
https://t.co/gm8P7H5KOb helps turn that work into charts, insights, and slides.
#AI #Productivity #Analytics #FutureOfWork #ChartGenAI