Follow me for a unique perspective on #crypto#TechnicalAnalysis. I specialize in repetitive chart structures and fractals. Not Financial/Investment Advice.
https://t.co/Mvr4X9Ane7
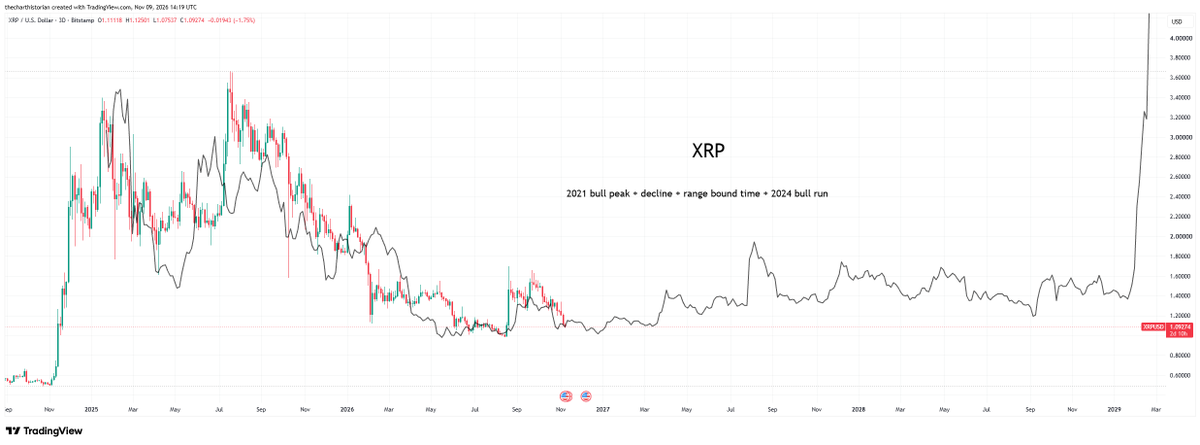
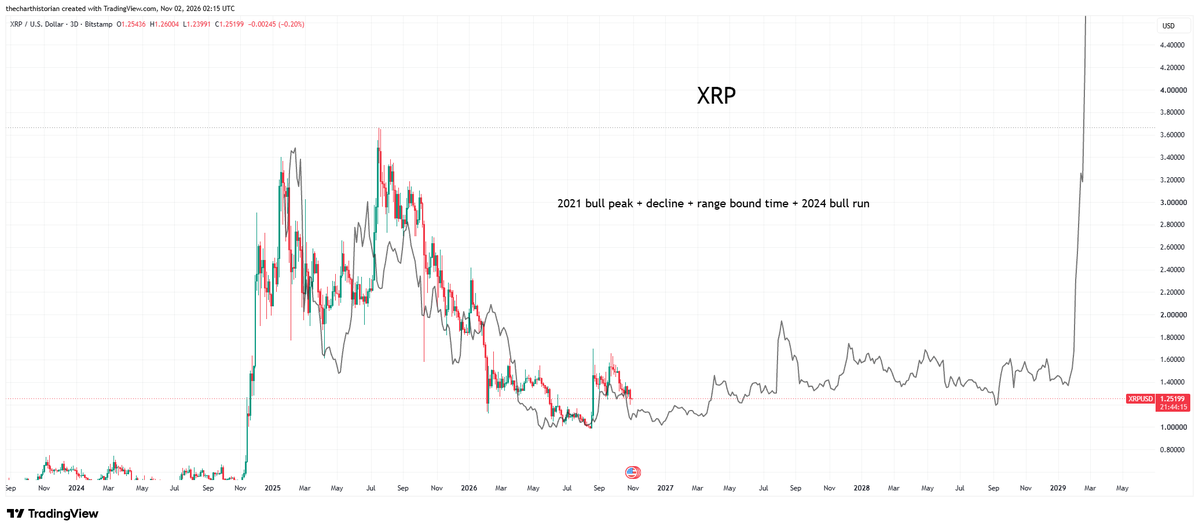
Is the latest ripple:native drop a breakdown or just noise? In Despite the Crash XRP is Still on Track, we look past short-term panic to examine historical market structures and key cycles. Watch the full breakdown to see why the broader trend remains intact.
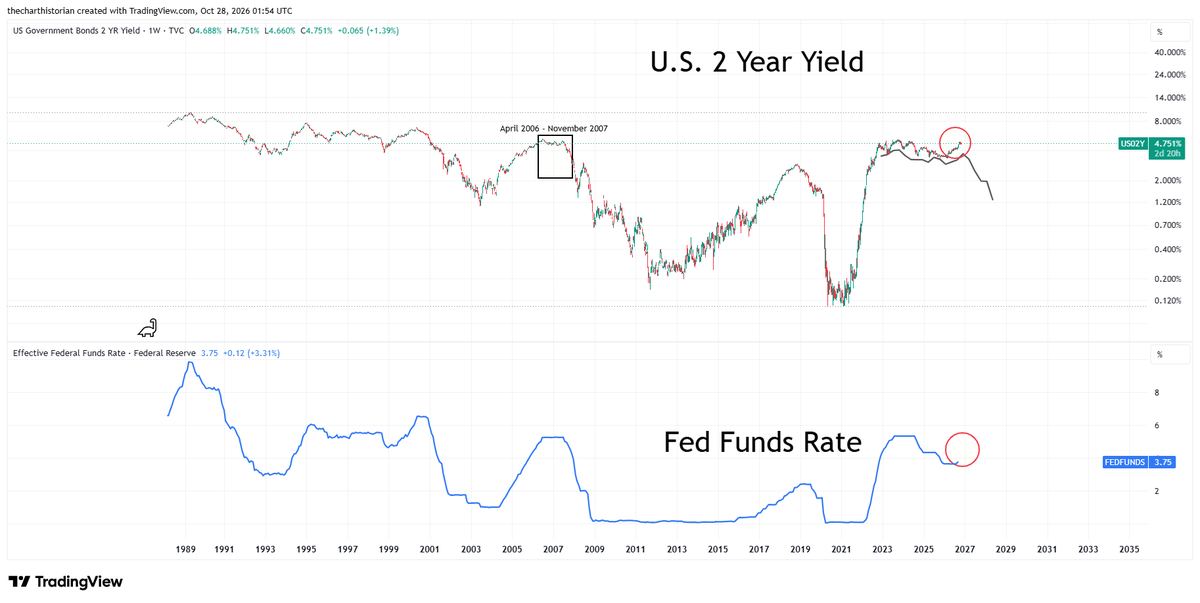
The Fed interest rate decision is tomorrow (Oct 28). The Fed Funds Rate has room to move up compared to the 2 year yield, which the Fed Fund Rate has been following. The 2 year yield has been repeating a peak pattern from 2006 - 2007. Even with this pattern in play, there is still room for the Fed Funds Rate to move up.
If the Fed Funds Rate is following the 2 year yield, and the 2 year yield is repeating a peak pattern from 2006 - 2007, will rates go up, or down by the next FOMC meeting?
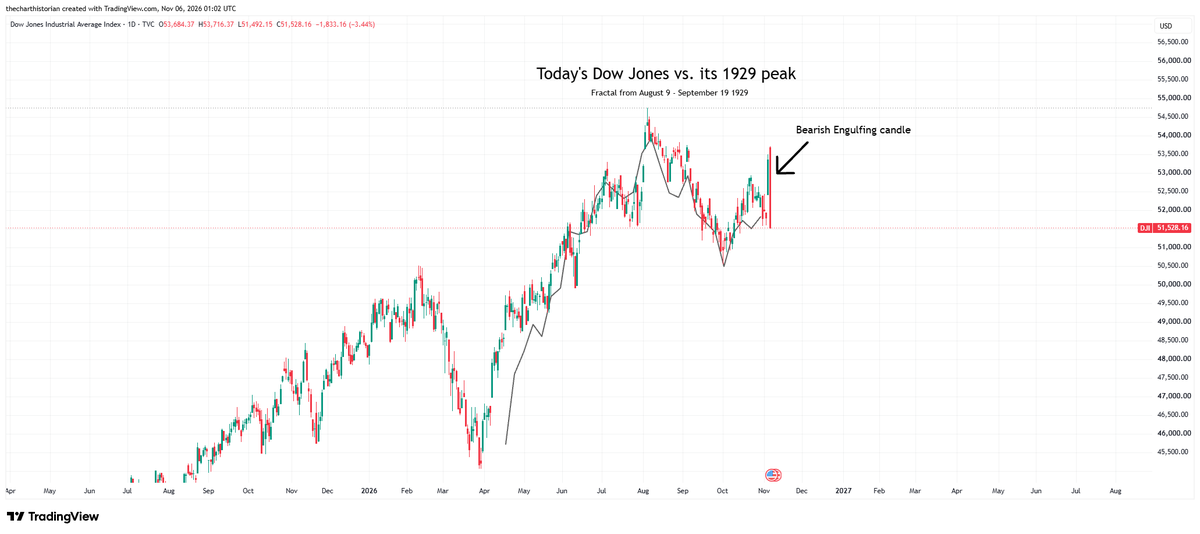
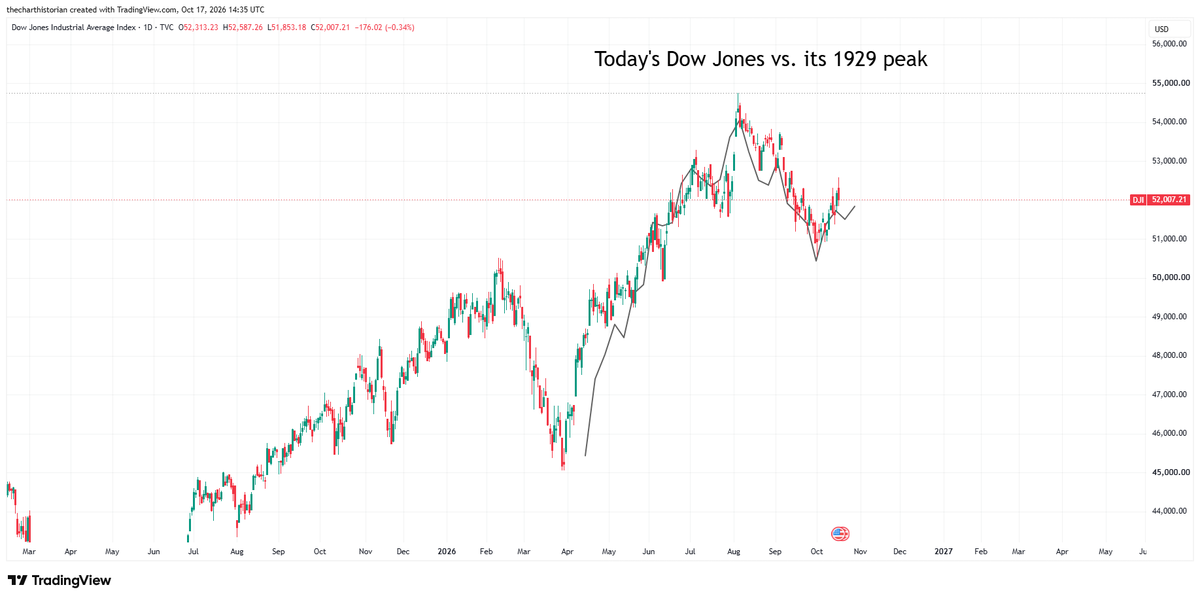
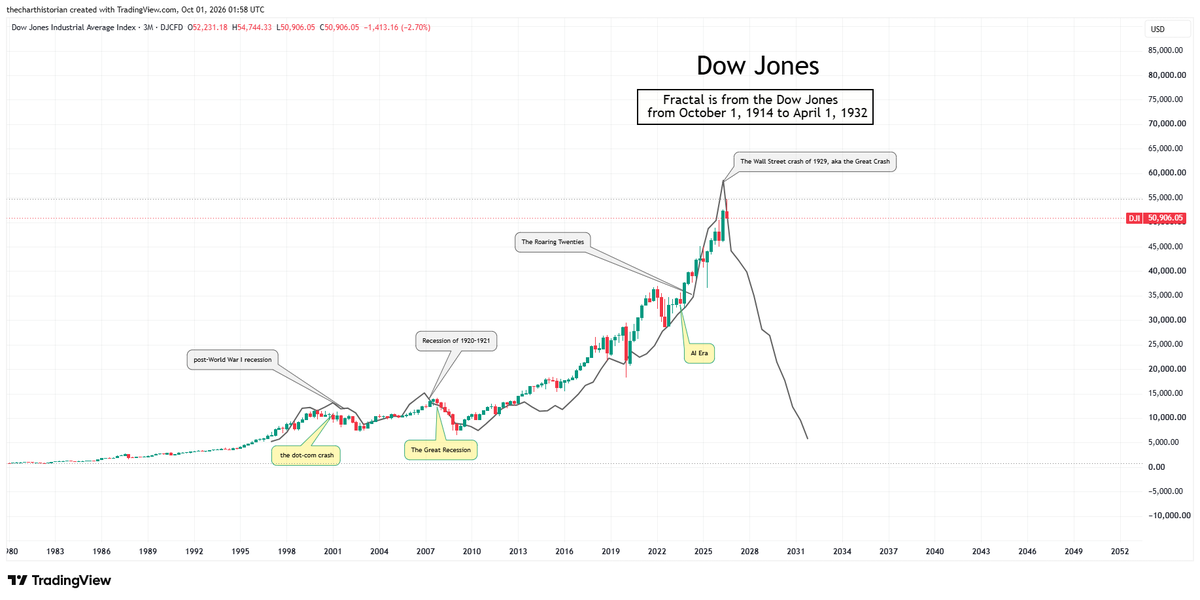
I had the starting date and ending date on this fractal incorrect. As far as I can tell, it started on December 24, 1914 and went to July, 8 1932. I could still be off on the actual day.
What has been will be again,
what has been done will be done again;
there is nothing new under the sun.
Ecclesiastes 1:9
#Dowjones#DJI#Stockmarketcrash
If the Fed Funds Rate is following the 2 year yield, and the 2 year yield is repeating a peak pattern from 2006 - 2007, will rates go up, or down by the next FOMC meeting?
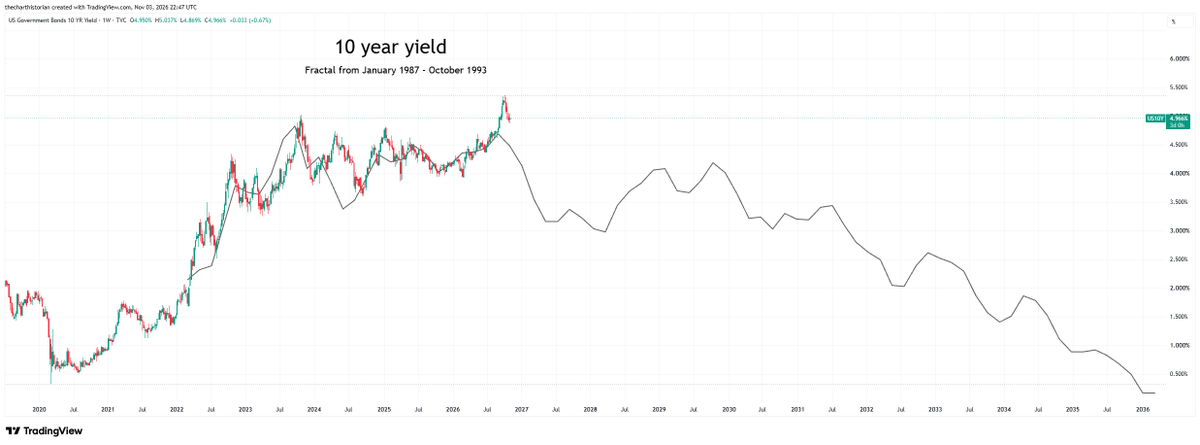
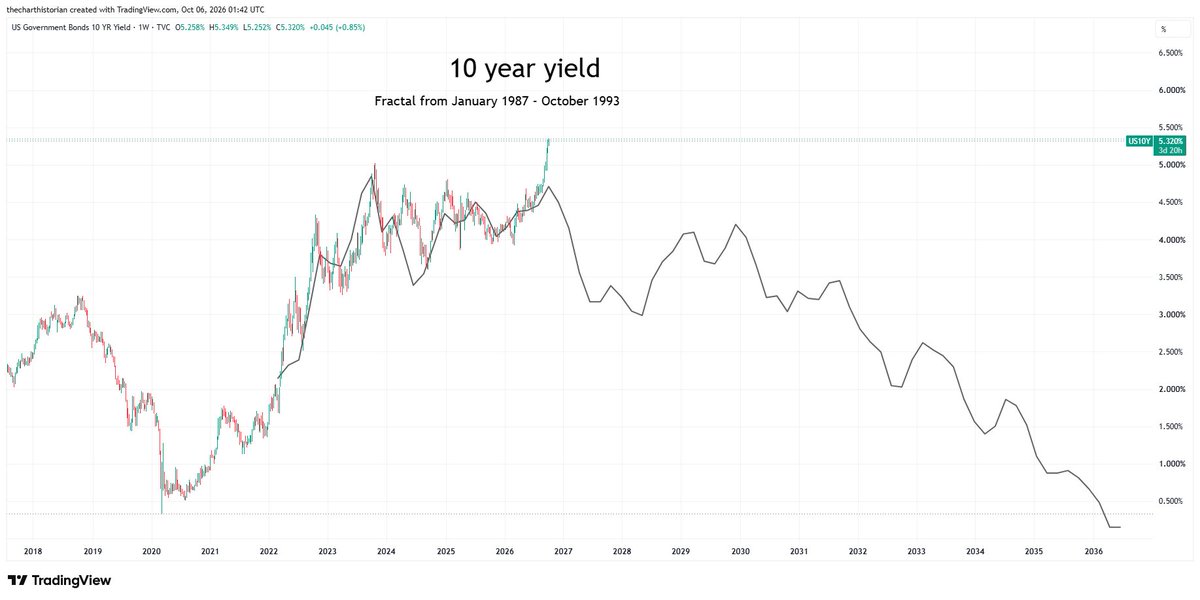
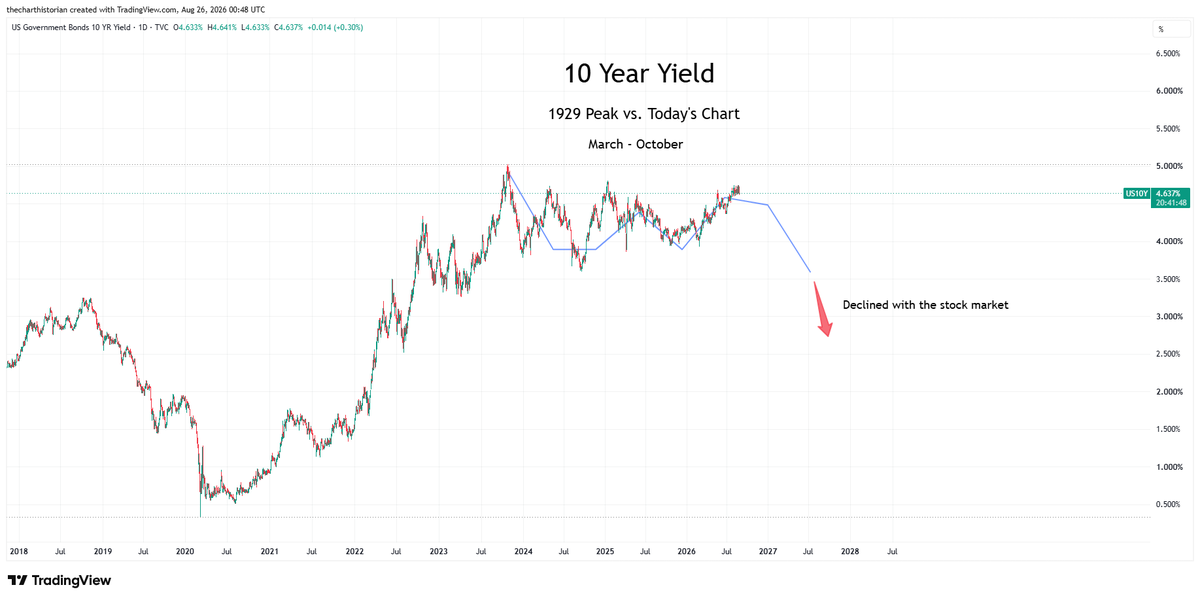
Since the 1940s the U.S. 10 year #yield has been repeating the patterns it printed in its early history. Since 2020 the 10 year yield has been repeating a pattern it printed from 1928 to 1932. This pattern includes a sharp decline that took place during the 1929 stock market crash. Many people believe the yield will rise, and it might in the near term. However, if the basic idea of this pattern continues to unfold a decline will take place. Just like in 1929, the coming decline may also coincide with a stock market crash.
Since the 1940s the U.S. 10 year #yield has been repeating the patterns it printed in its early history. Since 2020 the 10 year yield has been repeating a pattern it printed from 1928 to 1932. This pattern includes a sharp decline that took place during the 1929 stock market crash. Many people believe the yield will rise, and it might in the near term. However, if the basic idea of this pattern continues to unfold a decline will take place. Just like in 1929, the coming decline may also coincide with a stock market crash.