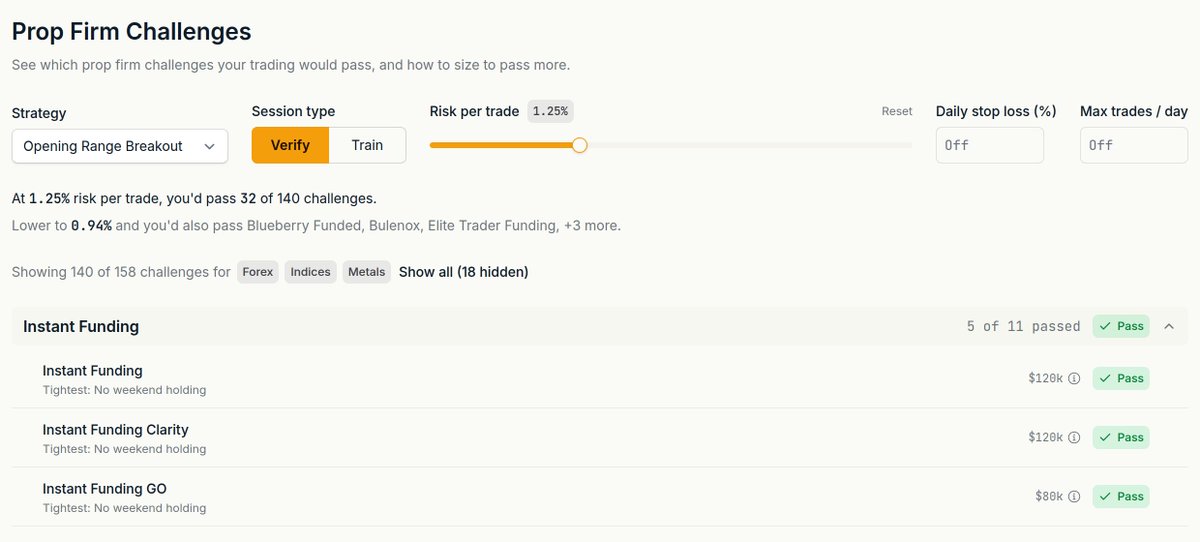
Move the risk-per-trade slider on the Prop Firms page and everything re-scores live. Same backtested trades, sized differently, different equity curve. You see how many challenges in the catalog you pass now, and which ones a smaller size adds. Smaller takes longer to reach a target, but drawdown rules are what end most attempts.
@Heremita_Trader We've looked into it and have downloaded the roll history for the full series, not just from 2023. It isn't implemented yet, so our commodity candles are not roll-adjusted today, and we have no price data export. It's in the pipeline, no date to give you yet.
Backtests are only as honest as the data underneath. We pull from Dukascopy at tick level where available, clean it to remove anomalies, then build 1-minute candles. Depth runs per symbol: up to around 22 years on the oldest forex pairs, other instruments start later.
Most backtesting tools keep every chart inside one window, so the rest of your desk sits empty. Our charts open as separate windows you can drag across monitors, then save the whole arrangement and load it again. Practise on the same screen layout you trade on, not a squeezed-down version of it.
Nobody's first live trade should be their first trade. Reps on historical data tell you how a setup behaves when it stops working, before the money is real. It builds confidence. It guarantees nothing.
No leaderboards. No streaks. No badges. No points. A feature ships only if it helps you validate or practice a strategy, so what you get is an equity curve, Monte Carlo, Sharpe. We are not optimizing for your screen time, we are optimizing for your trading.
Prop Firms scores the trades you already backtested against published challenge rules. Each challenge comes back Pass, Almost, Not yet, or Failed. Move the risk-per-trade slider and everything re-scores live. It scores. It does not connect to a firm, trade, or fund you.
Automated backtesting tells you whether a set of rules made money. Manual backtesting tells you whether you can actually trade them. That second answer is the one that decides your account, so we build for it.
Reviewing closed trades on the chart is steadier too. The selected trade stays put, its row stays highlighted, and getting back to realtime takes less work.
You can now write down why you took a trade. Journal notes ship with a Notes column in the Orders panel, a note button on the chart while a trade is open, and the note comes along in your CSV export.
Drawings keep your look. Right-click one and hit Apply defaults to snap it back to your saved style, or switch on Remember last used so the next drawing starts where the last one left off.
Setting up a session got simpler.
Pick a random date range by length and period, any time, from, to, or between. Or hand-pick it yourself.
Training and verification use the same setup now. If a pick fails, it says why right under the field.
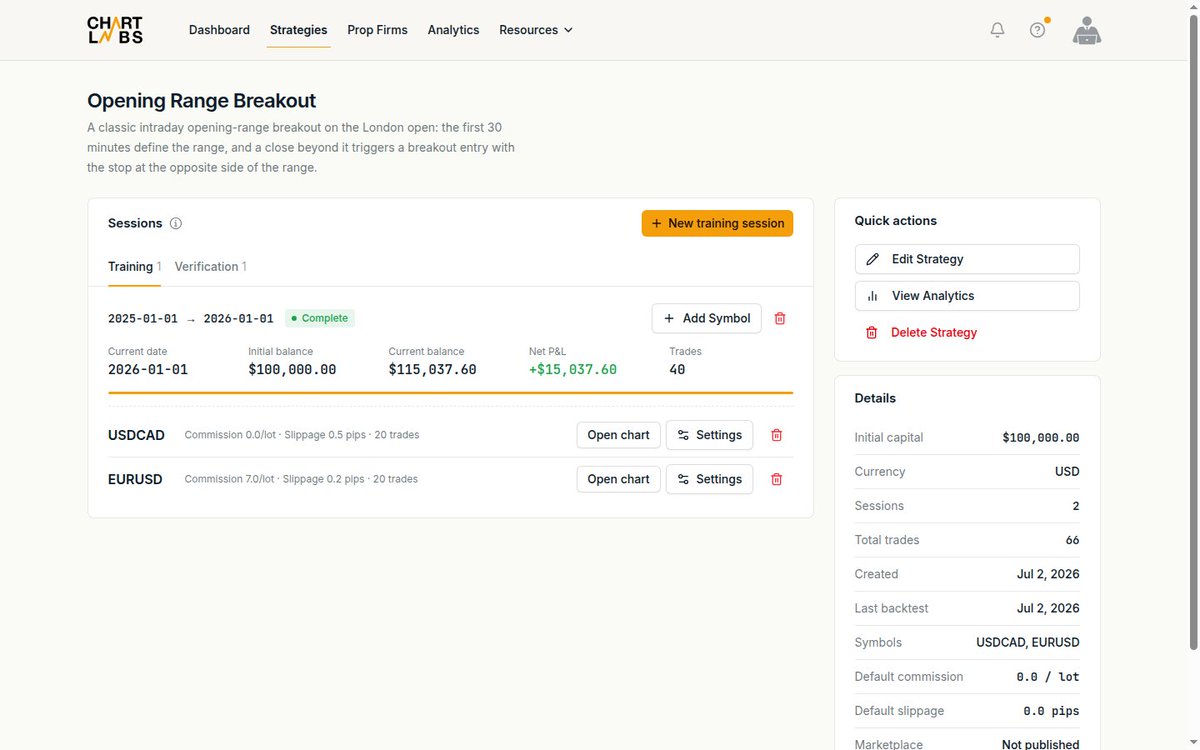
The strategy page is redesigned.
Sessions come first, because that is what you open the page for. The key facts sit in a sidebar. Each session shows its progress and balance at a glance.
Less hunting, more backtesting.
We shipped a round of polish. Nothing new to learn, just less in your way.
Session setup is simpler, the strategy page is rebuilt around your sessions, and every page finally shares one look.
The boring work. It is most of the work.
Charts remember the period you last used, per symbol and per trading session. Reopen a symbol and it comes up where you left it, with no default-period flash first. Range bar sizes are remembered the same way.
Reaching the end of a replay session used to look like an error, or say nothing at all. You now get a session summary: closed trades, net realized P&L and a way through to analytics. Running out of data says that instead, in those words.