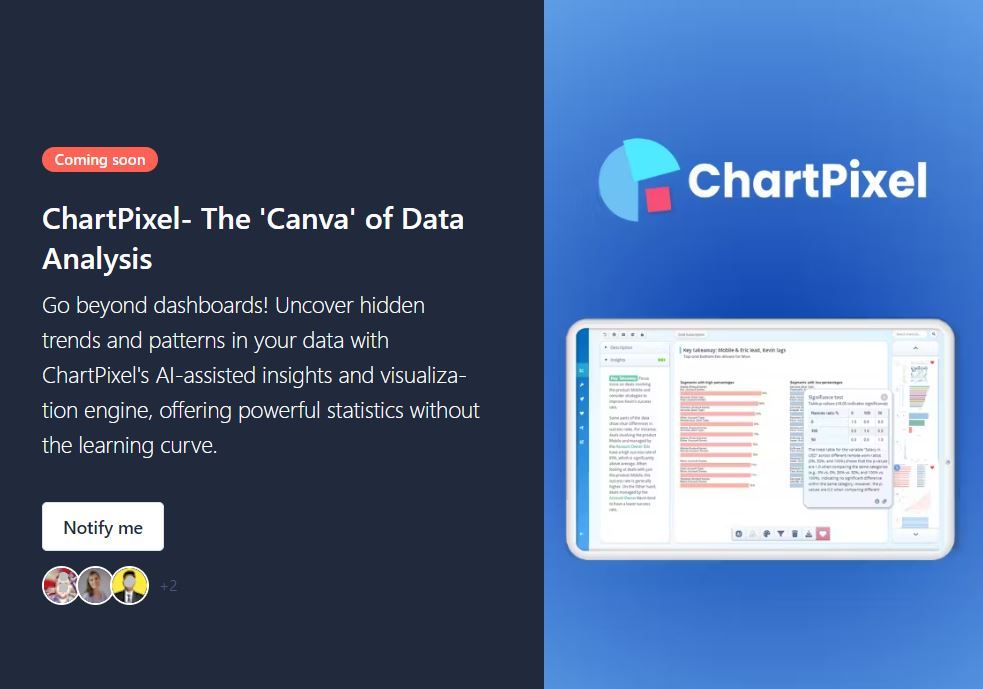
🌍 Did you know ChartPixel speaks your language - literally?
✅ Choose from 20+ 𝐥𝐚𝐧𝐠𝐮𝐚𝐠𝐞𝐬 𝐢𝐧 𝐲𝐨𝐮𝐫 𝐏𝐫𝐨𝐣𝐞𝐜𝐭 𝐒𝐞𝐭𝐭𝐢𝐧𝐠𝐬, including Deutsch, Français, Português, Türkçe, 中文, and many more.
📊 Let your data insights speak to you, in your language.
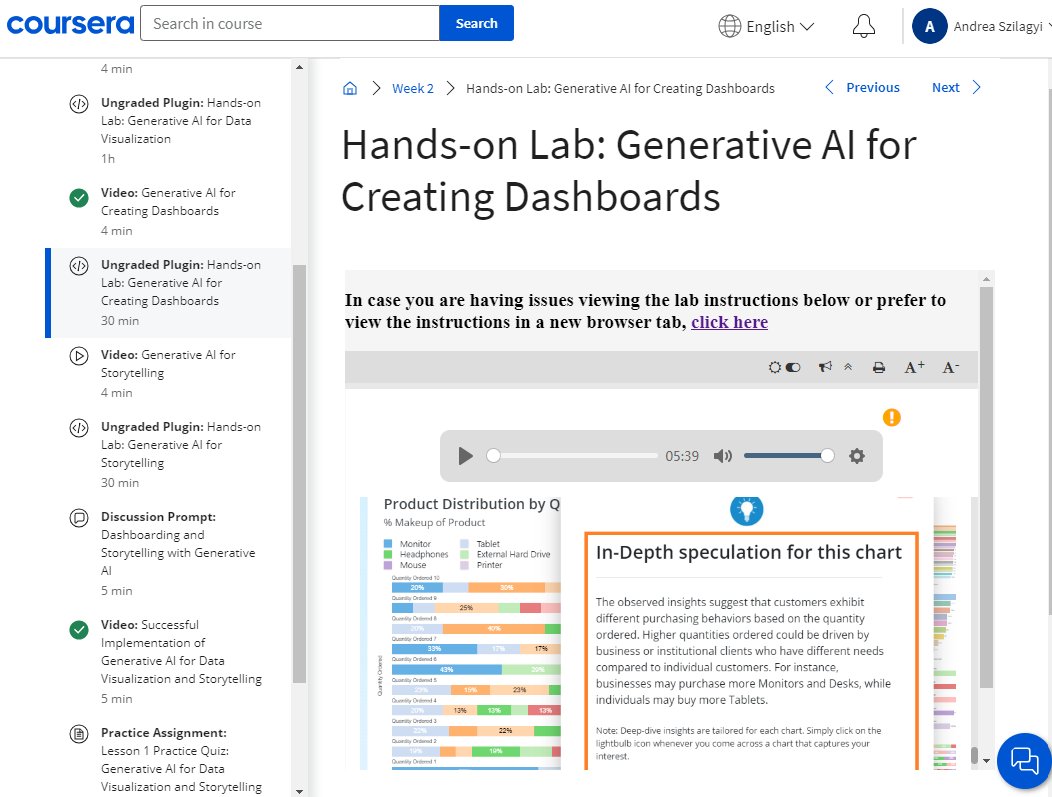
🚀 ChartPixel is featured in another 𝐂𝐨𝐮𝐫𝐬𝐞𝐫𝐚 course: 𝐆𝐞𝐧 𝐀𝐈 𝐟𝐨𝐫 𝐅𝐢𝐧𝐚𝐧𝐜𝐢𝐚𝐥 𝐃𝐚𝐭𝐚 𝐀𝐧𝐚𝐥𝐲𝐬𝐢𝐬 course, alongside tools like Power BI and Tableau. The course highlights how ChartPixel automates both chart creation and insight generation.
Here’s what the course says about ChartPixel:
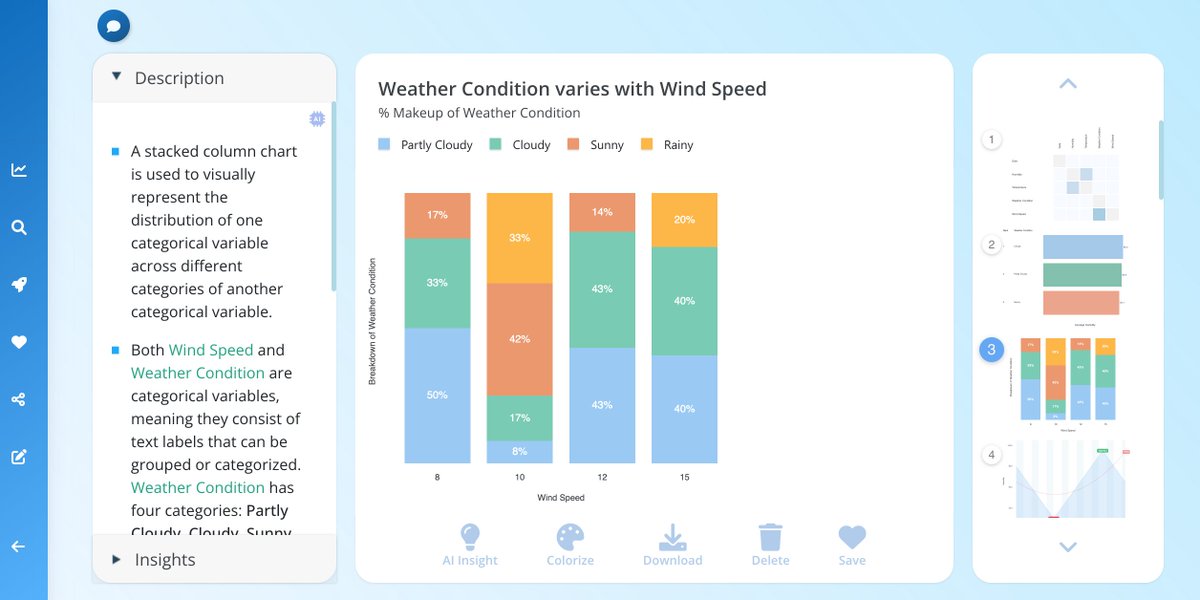
✅ Automatically generates charts and key insights – No manual setup required.
✅ Customizable visuals – Adjust colors and styles to match your branding.
✅ Designed for efficiency – Upload data, and ChartPixel does the work for you.
Rory Sutherland's advice for early-stage companies has stuck with us:
✨ Be consistent
🔍 Be distinctive
🌟 Be famous
First two are covered, but there's always room to get more famous! 😉
ChartPixel is live on Product Hunt today and we are super excited! 🚀
Please support us
In exactly 2 weeks—on Monday, October 28th—we're launching ChartPixel on Product Hunt! 🥳
If you are happy to support, go to the link below, click on 'Notify me'' so you can upvote us on the big day.
Thanks in advance for all the support in our journey!
https://t.co/1vMbgA5iHW
Do you work with survey results and wish you could uncover insights in just minutes?
With our improved survey analysis algorithm ChartPixel you can:
😊 𝐆𝐚𝐮𝐠𝐞 𝐬𝐞𝐧𝐭𝐢𝐦𝐞𝐧𝐭
💡 𝐔𝐧𝐝𝐞𝐫𝐬𝐭𝐚𝐧𝐝 𝐤𝐞𝐲 𝐭𝐨𝐩𝐢𝐜𝐬
📈 𝐓𝐫𝐚𝐜𝐤 𝐜𝐡𝐚𝐧𝐠𝐞𝐬 𝐨𝐯𝐞𝐫 𝐭𝐢𝐦𝐞
👥 𝐈𝐝𝐞𝐧𝐭𝐢𝐟𝐲 𝐤𝐞𝐲 𝐝𝐞𝐦𝐨𝐠𝐫𝐚𝐩𝐡𝐢𝐜𝐬: Even with smaller samples, uncover which demographic attributes drive outcomes like customer satisfaction.
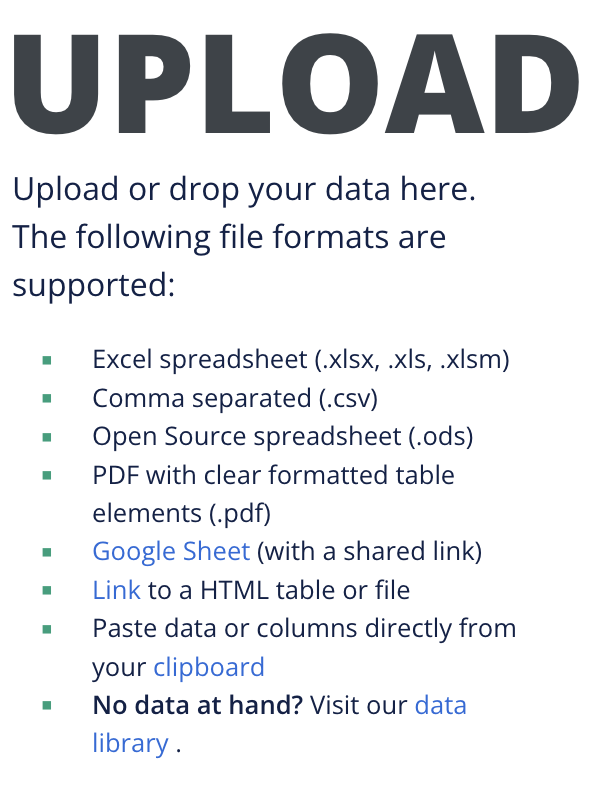
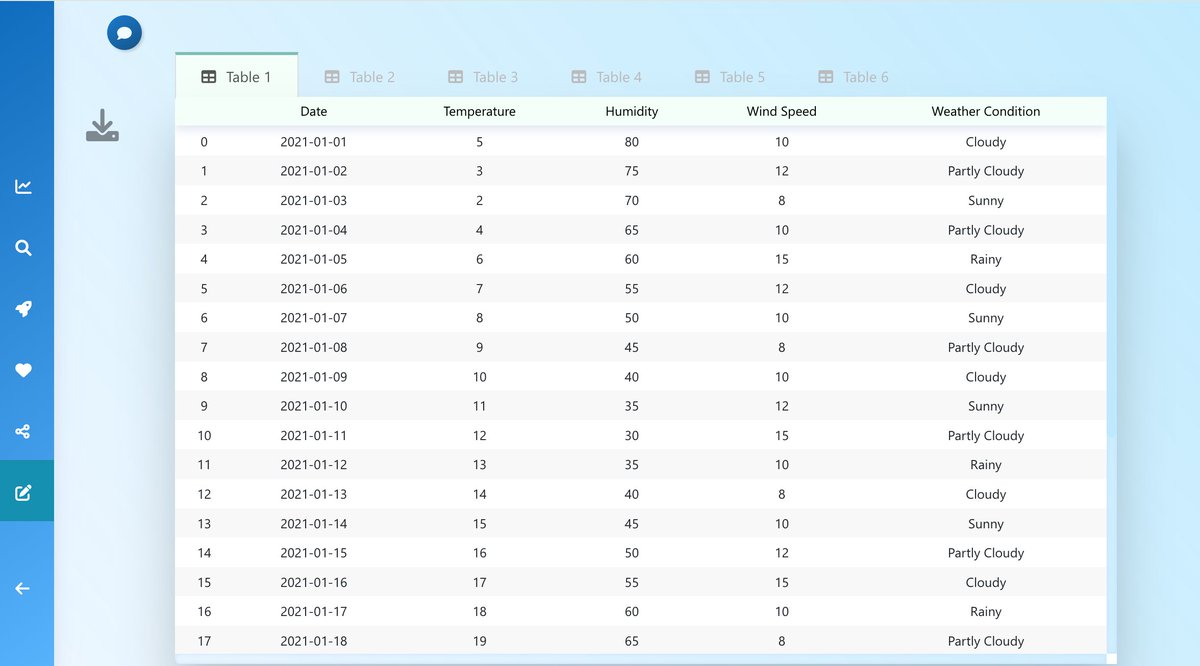
Just drop your data, lean back and see your insights visualized.
Do you work with survey results and wish you could uncover insights in just minutes?
With our improved survey analysis algorithm ChartPixel you can:
😊 𝐆𝐚𝐮𝐠𝐞 𝐬𝐞𝐧𝐭𝐢𝐦𝐞𝐧𝐭
💡 𝐔𝐧𝐝𝐞𝐫𝐬𝐭𝐚𝐧𝐝 𝐤𝐞𝐲 𝐭𝐨𝐩𝐢𝐜𝐬
📈 𝐓𝐫𝐚𝐜𝐤 𝐜𝐡𝐚𝐧𝐠𝐞𝐬 𝐨𝐯𝐞𝐫 𝐭𝐢𝐦𝐞
We are excited to be part of the curriculum in the IBM 𝐂𝐨𝐮𝐫𝐬𝐞𝐫𝐚 course:
𝐆𝐞𝐧𝐞𝐫𝐚𝐭𝐢𝐯𝐞 𝐀𝐈: 𝐄𝐧𝐡𝐚𝐧𝐜𝐞 𝐲𝐨𝐮𝐫 𝐃𝐚𝐭𝐚 𝐀𝐧𝐚𝐥𝐲𝐭𝐢𝐜𝐬 𝐂𝐚𝐫𝐞𝐞𝐫🎉
Try the 7-day free trial to access the assignment for ChartPixel within the course.
We introduced the next step in our automated chart creation - AI data filters: They will instantly help you to uncover patterns and crack those hidden segments.
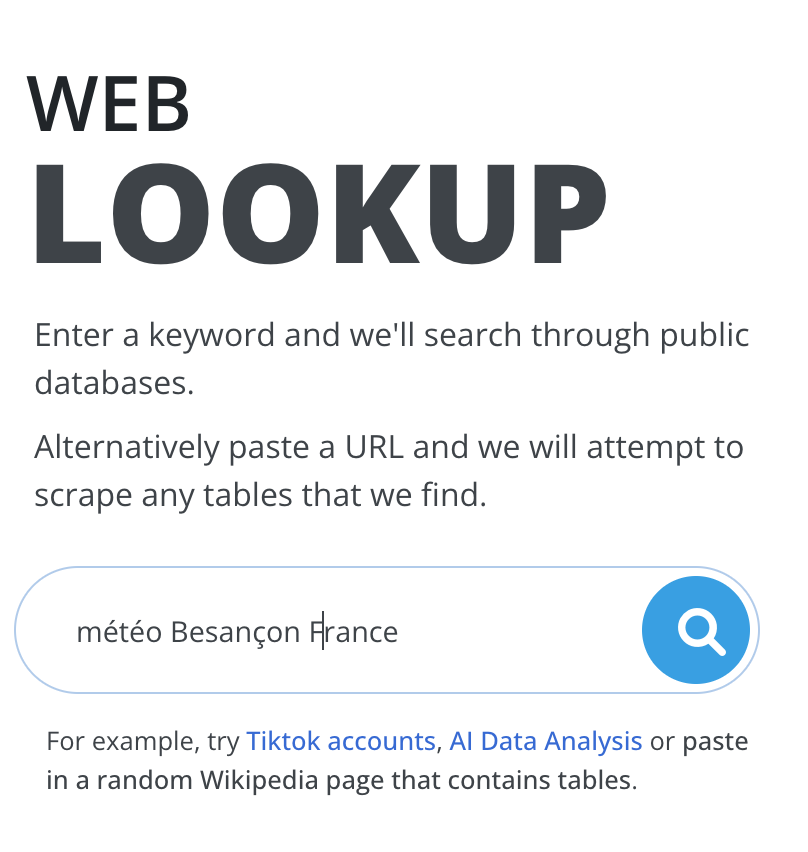
Chartpixel (https://t.co/gTcVl0NL5d) analyse des données (sources possibles : voir image 1) et en génére des visualisations. Peut construire une base depuis une recherche mais⚠️ne cite pas ses sources. Beta gratuite, import de 10 Mo. Export png #uneIAparjour#données Test ⬇️⬇️
1️⃣ ChartPixel -
Visualize your data with ease using ChartPixel. This AI-driven platform offers tools for creating dynamic and interactive charts, graphs, and dashboards, enabling businesses to gain valuable insights from their data. #ChartPixel