#NQ_F $NQ $MNQ -- Tale of Momentum Tape. Potential weakness arrived as forecasted on July 2nd, with price hitting 1st support target amid diminishing bullish momentum. Observing for potential red momentum turn, which could move price towards 2nd support.
#NQ_F $NQ $MNQ -- Tale of Momentum Tape. Bullish momentum leaving again as Elliot Wave 4 levels indicating potential weakness on July 1st with weak close. Bullish failure to capitalize on June 30th & July 1st momentum might have established short-term resistance zone.
#NQ_F $NQ $MNQ -- Tale of Momentum Tape. Bullish momentum leaving again as Elliot Wave 4 levels indicating potential weakness on July 1st with weak close. Bullish failure to capitalize on June 30th & July 1st momentum might have established short-term resistance zone.
#NQ_F $NQ $MNQ -- Bullish momentum returning in an extended bearish Elliot Wave 4 from June 16th. Break of June 25th high indicates a potential move above June 16th high. However, cautiously observing EW4 levels for potential weakness.
$NVDA -- Support zone bounce success with bullish momentum returning. With bullish momentum also returning into S&P, June 29th low now line in sand.
$NVDA -- Momentum still in bull country and coming into very key support zone. Anticipating support zone bounce <$194, like it did in February (clean) & March (delayed). But cautiously observing impact of S&P losing bullish momentum.
#NQ_F $NQ $MNQ -- Bullish momentum returning in an extended bearish Elliot Wave 4 from June 16th. Break of June 25th high indicates a potential move above June 16th high. However, cautiously observing EW4 levels for potential weakness.
#NQ_F $NQ $MNQ -- June 22nd severe lack of demand interest confirmed supply overcoming demand, as bullish momentum wanes. Similar momentum action occurred in March of 2018. Look out below. Else, Momentum State reverses with price moving >$30264.
$MSFT -- Momentum still in bear country but price bouncing off bearish Elliot Wave 5 zone. June 18th & 26th Absorptions over the coming days will indicate if momentum turns bullish or continues bearish.
$NVDA -- Momentum still in bull country and coming into very key support zone. Anticipating support zone bounce <$194, like it did in February (clean) & March (delayed). But cautiously observing impact of S&P losing bullish momentum.
$NVDA -- Momentum still in bull country and coming into very key support zone. Anticipating support zone bounce <$194, like it did in February (clean) & March (delayed). But cautiously observing impact of S&P losing bullish momentum.
$SPCX -- 30m chart bearish post Friday rejection, but coming off mini-bullish Elliot Wave 3. Potential EW4 move back towards $150 support resulted in 86% supply. Rally @ market close resulted in 228% demand effort. With S&P losing bullish momentum, $150 support line in sand.
$NOW -- Momentum in bear country off Resistance Zone rejection. June 26th Bullish Panic off Absorption looks similar to May 14th action indicating potential bottom reversal. Else, with S&P losing bullish momentum, momentum could take a red turn especially with move <89.4
$NOW -- Price bar initial bullish momentum can be spotted returning on white bars in a downtrend from 04/17 prior to green bars from 05/20 as momentum indicator reverses. Still anticipating momentum bullish crossover.
$MRNA -- Tale of Momentum Tape. Playing out as projected. Bottom reversal resulting in new higher highs. May 11th Absorption now supporting rally. However, be mindful of June 18th Absorption especially with bar closing in the middle, indicating sellers taking profits.
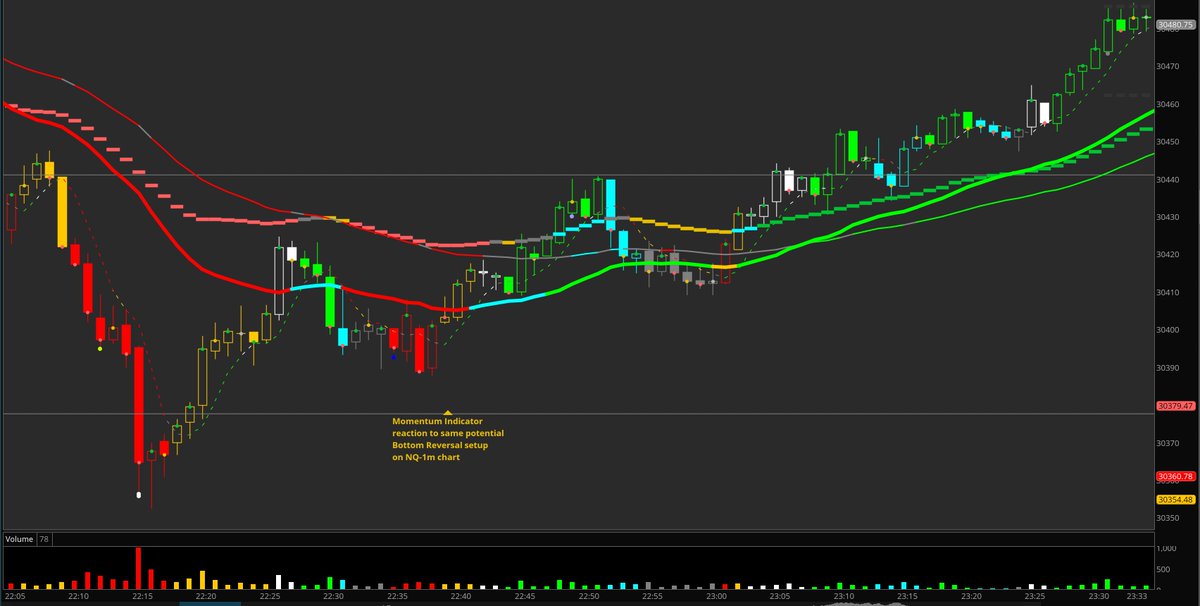
$MRNA -- Bullish panic on June 3rd creating a potential bottom reversal spotted by Momentum indicator. Same pattern spotted on NQ-1m chart followed-up with strong bullish momentum.
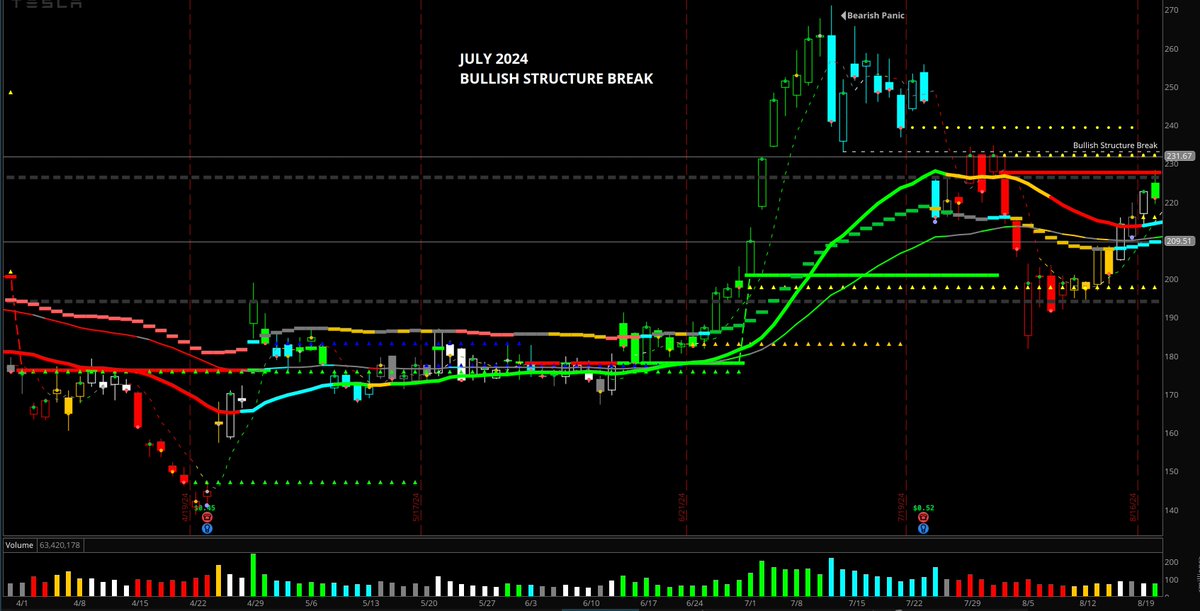
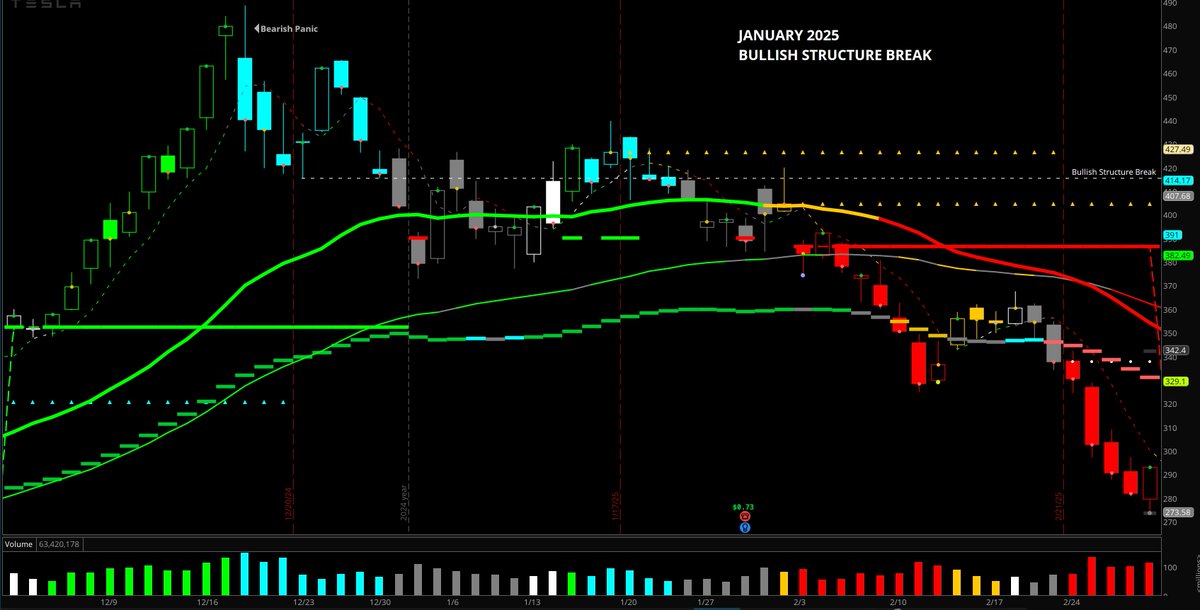
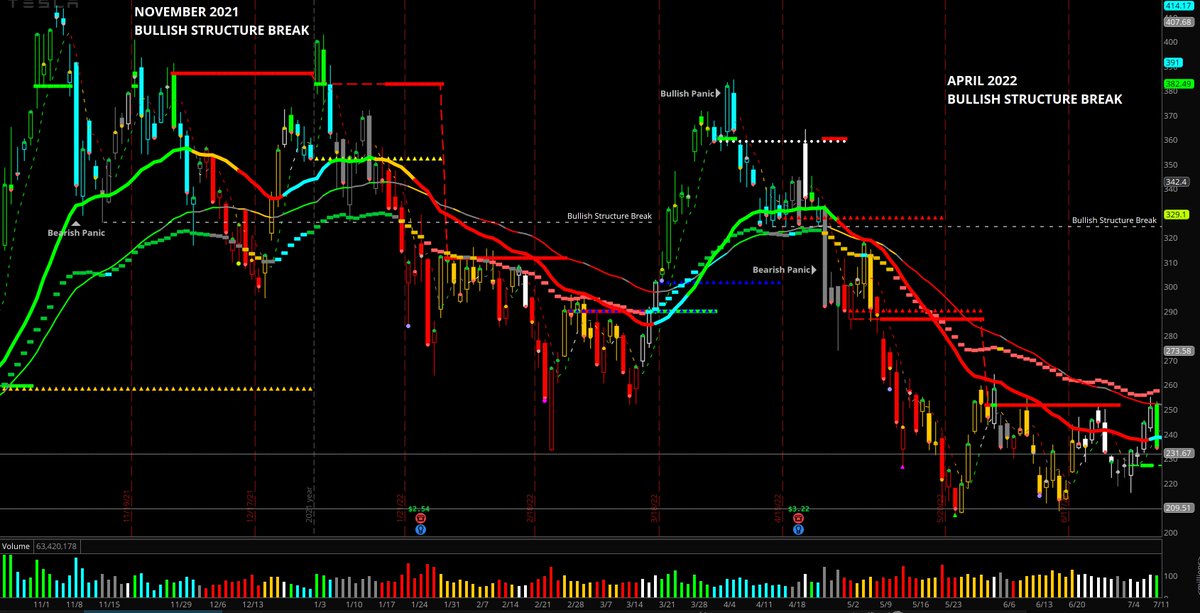
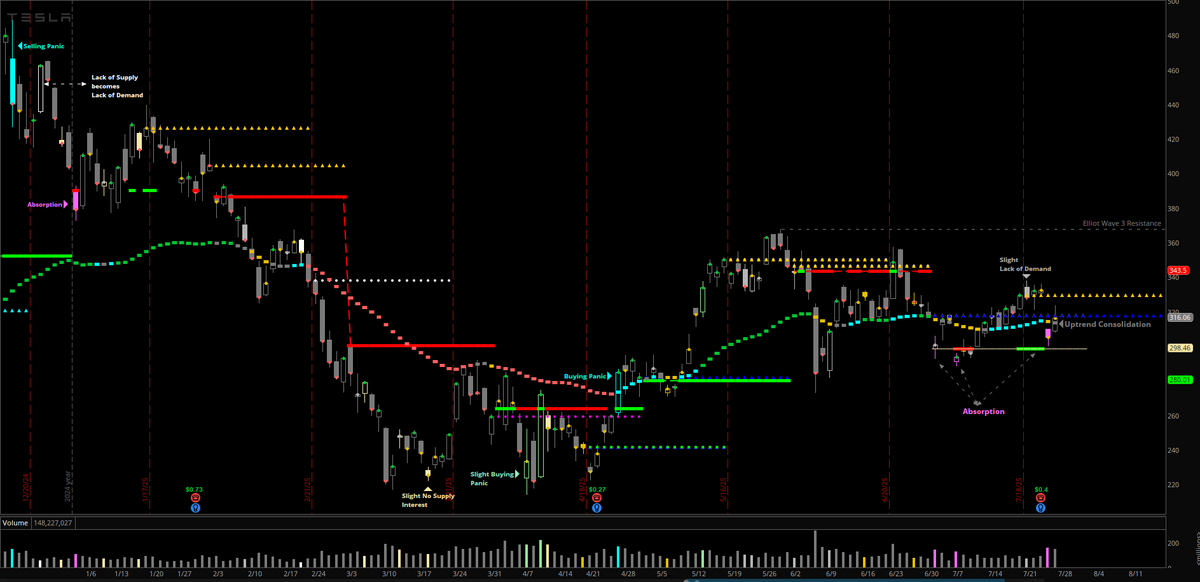
$TSLA #TSLA -- Tale of Momentum Tape. Playing out as projected. Momentum turning red. Until >=$400 is successfully tested & breaks out, bearish momentum continues. June 15th was a successful bearish test that resulted in no demand.
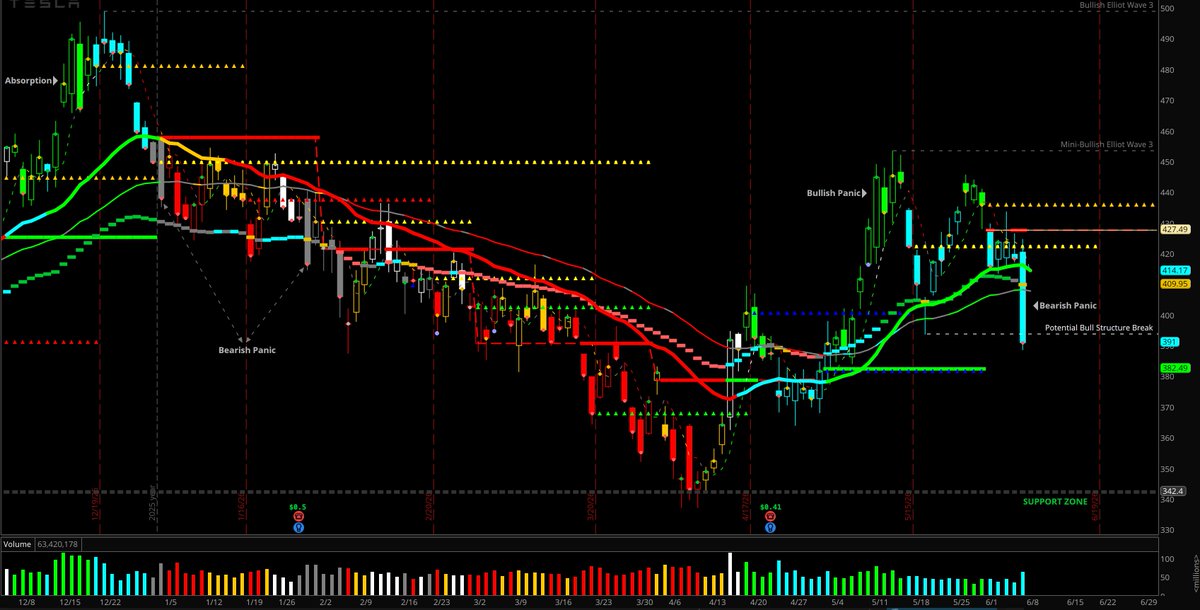
$TSLA #TSLA -- Tale of Momentum Tape. June 5th bearish panic hinting @ potential bearish momentum started from demand's failure to overcome May 11th bullish panic. Anticipating potential momentum red turn. Else, just an extended EW4.
#NQ_F $NQ $MNQ -- June 22nd severe lack of demand interest confirmed supply overcoming demand, as bullish momentum wanes. Similar momentum action occurred in March of 2018. Look out below. Else, Momentum State reverses with price moving >$30264.
$TSLA #TSLA -- Tale of Momentum Tape. June 5th bearish panic hinting @ potential bearish momentum started from demand's failure to overcome May 11th bullish panic. Anticipating potential momentum red turn. Else, just an extended EW4.
$MRNA -- Bullish panic on June 3rd creating a potential bottom reversal spotted by Momentum indicator. Same pattern spotted on NQ-1m chart followed-up with strong bullish momentum.
$NOW -- Price bar initial bullish momentum can be spotted returning on white bars in a downtrend from 04/17 prior to green bars from 05/20 as momentum indicator reverses. Still anticipating momentum bullish crossover.
$NOW -- Potential bottom reversal spotted post bearish panic absorption. Anticipating a bullish crossover of momentum indicators for additional confirmation, especially after potential Elliot Wave 2 bounce post earnings.
$NOW -- Potential bottom reversal spotted post bearish panic absorption. Anticipating a bullish crossover of momentum indicators for additional confirmation, especially after potential Elliot Wave 2 bounce post earnings.