Nifty Straddle Challenge.
Earn consistent passive income by trading every wednesday and thursday.
This system has potential to double your trading capital within one year.
https://t.co/PwHZitECrx
#Nifty#nifty50#straddle#intradaytrading
in this thread v vl understand how to read RSI on price graph
1) RSI is an oscillator and every oscillator fluctuate in a pre-defined range.RSI range is from 0 to100
2)Between 0 to 100,we have three different range to determine if price is in bullish,bearish or sideways zone(1/n)
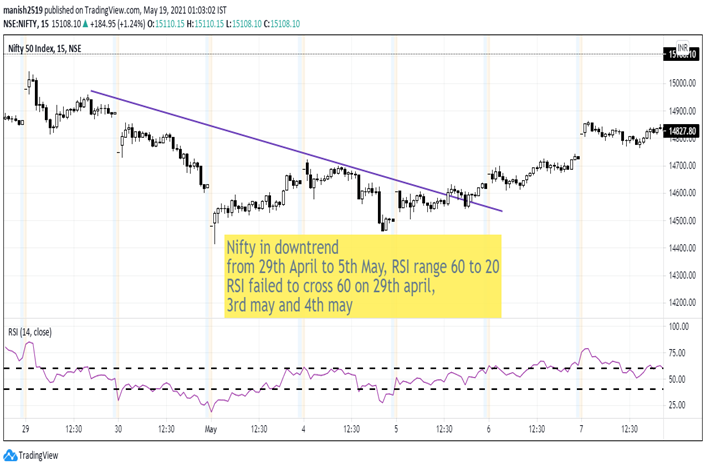
10) Nifty on 15 mins time frame – downtrend between 29th April 2021 to 5th May 2021 – RSI range was 60 to 20. RSI failed to cross 60 on 29th April, 3rd and 4th May (9/n)
5) call writing seen in 15300 and 15200 strike.
6) Highest oi in 15500 strike, highest chg in oi - 15300 and 15200 strike
7) Looking at oi data and breakout from 15000 level, there is bullish bias.
8) Bull put spread can be the strategy for this expiry (2/2)
18th May 2021 Update
1) Nifty opened gap up almost +1% and cross major hurdle of 15000 level
2) Currently at 2.22pm trading @ 15110 level, +187 points
3) Put writing can be seen in 15000 and 15100 strike
4) Highest oi in 15000 strike, highest chg in oi 15000 and 15100 strike(1/2)