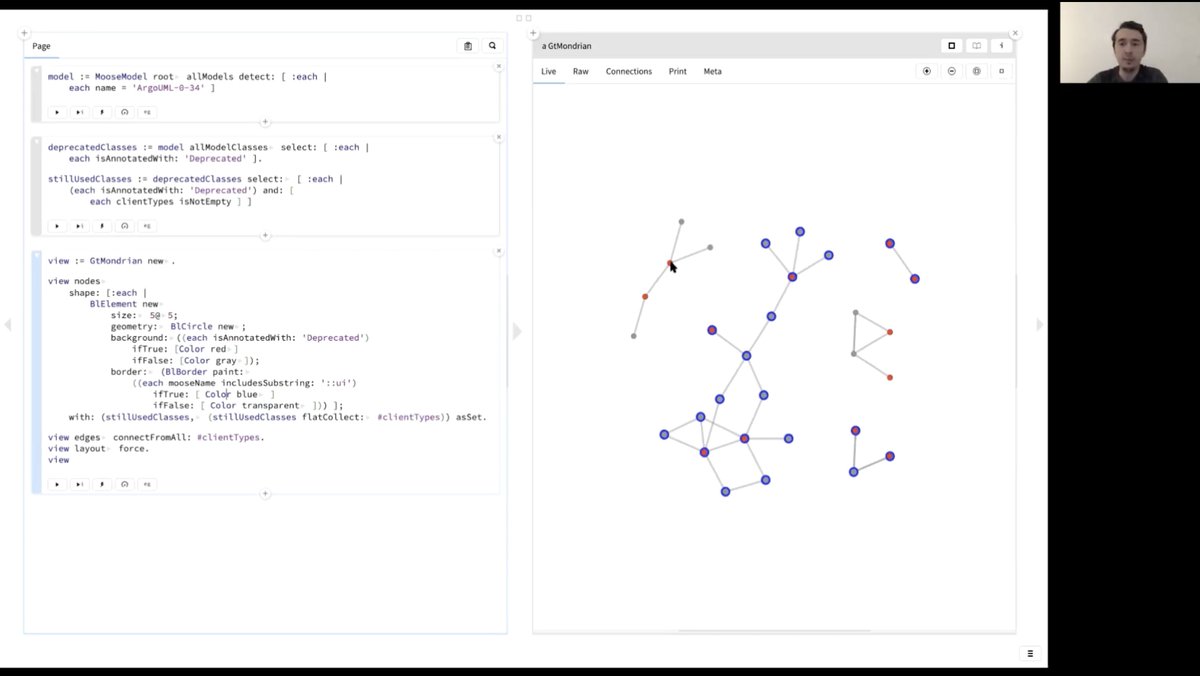
Boundaries between software tools are arbitrary. In the view below we start by writing a query, continue by creating a view, use that view to explore a set of classes, browse the details of a class, parse its source code and explore its AST. All in one workflow. No tool switch!
The lecture on #MoldableAnalysis by @Chis_Andrei is now available:
https://t.co/z7px1qRtOO
It offers a live tour for how we use #gtoolkit for software assessment by means of custom tools. It covers: navigation, querying, visualization, working with ASTs & even creating reports.
#GToolkit can be integrated in many different ways with other systems or runtimes.
Watch @Chis_Andrei showing examples of such integrations.
https://t.co/gNgadlEFYi
Recently, we focused our attention on Moldable Debugging. Here is @Chis_Andrei giving a tour of what we mean by it.
https://t.co/ijzAdVacWv
#MoldableDevelopment with #GToolkit
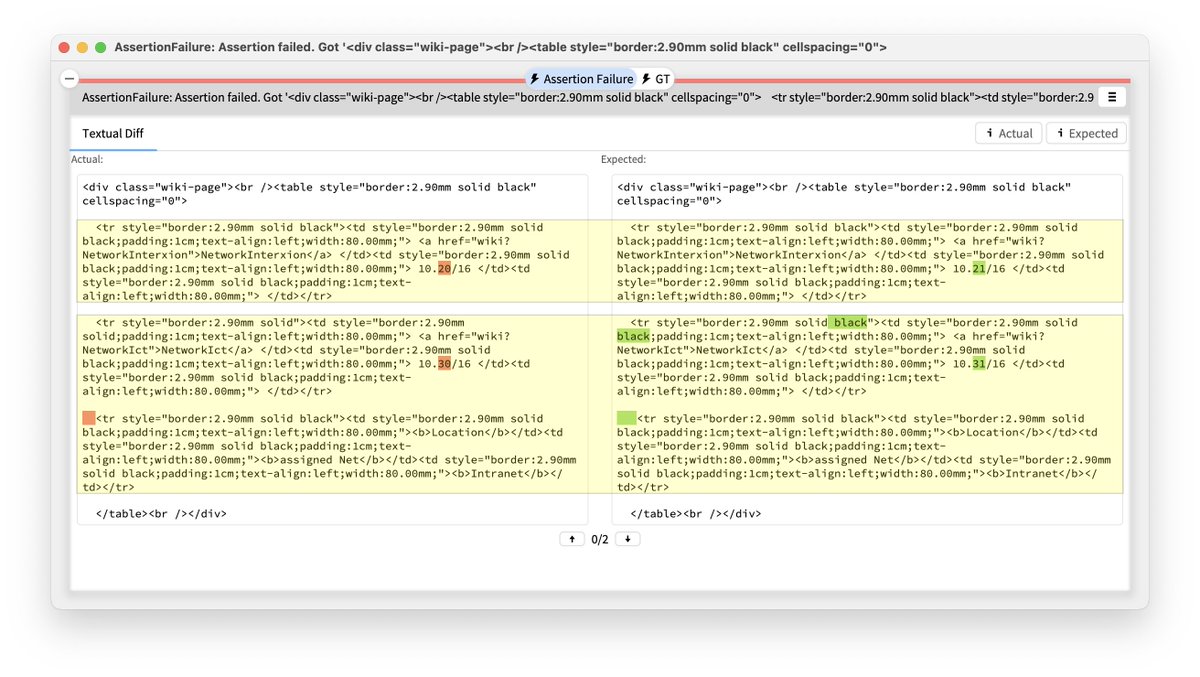
Moldable Exceptions offer an inexpensive way to create custom debugging experiences in #GToolkit.
Here is a basic example: when getting an assertion failure error, the debugger shows directly a diff.
#MoldableDevelopment
1/
@FlySWISS Quite terrible and frustrating customer support for lost luggages. More than 5 days passed since my luggage was lost and nobody knows what to do. Swiss Port says to call Swiss Air, and Swiss Air says to call Swiss Port. And https://t.co/iDGLINCT9f does not work...
If you missed @onierstrasz's excellent keynote "Making Systems Explainable" at #VISSOFT2022 or if you want to listen to it again, you can now watch the recording online 📺
https://t.co/hvvoNrwXlO
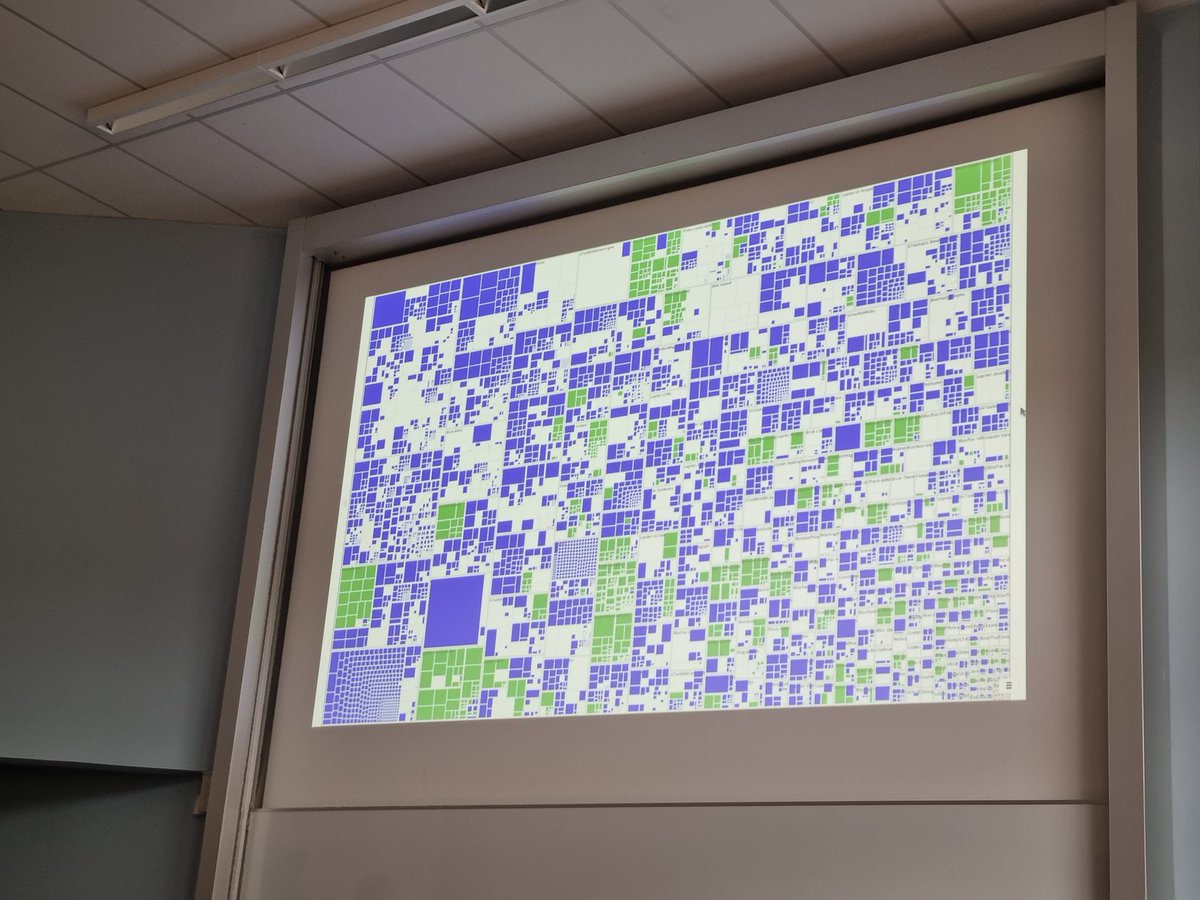
@girba The idea of custom tools can apply to every single development problem! This view shows a treemap with all classes in Glamorous Toolkit. Classes colored in blue have domain specific extensions; classes colored in green are examples. @girba at #esug2023