$NVDA
Multiple key zones ahead to watch for potential long opportunities. 👀
Price is currently testing the first key area, but the ideal setup would be a deeper pullback into the rising trendline, which aligns with the 200W EMA.
$NVDA
Multiple key zones ahead to watch for potential long opportunities. 👀
Price is currently testing the first key area, but the ideal setup would be a deeper pullback into the rising trendline, which aligns with the 200W EMA.
$NVDA
Multiple key zones ahead to watch for potential long opportunities. 👀
Price is currently testing the first key area, but the ideal setup would be a deeper pullback into the rising trendline, which aligns with the 200W EMA.
$NVDA
Multiple key zones ahead to watch for potential long opportunities. 👀
Price is currently testing the first key area, but the ideal setup would be a deeper pullback into the rising trendline, which aligns with the 200W EMA.
$NVDA
Multiple key zones ahead to watch for potential long opportunities. 👀
Price is currently testing the first key area, but the ideal setup would be a deeper pullback into the rising trendline, which aligns with the 200W EMA.
$NVDA
Multiple key zones ahead to watch for potential long opportunities. 👀
Price is currently testing the first key area, but the ideal setup would be a deeper pullback into the rising trendline, which aligns with the 200W EMA.
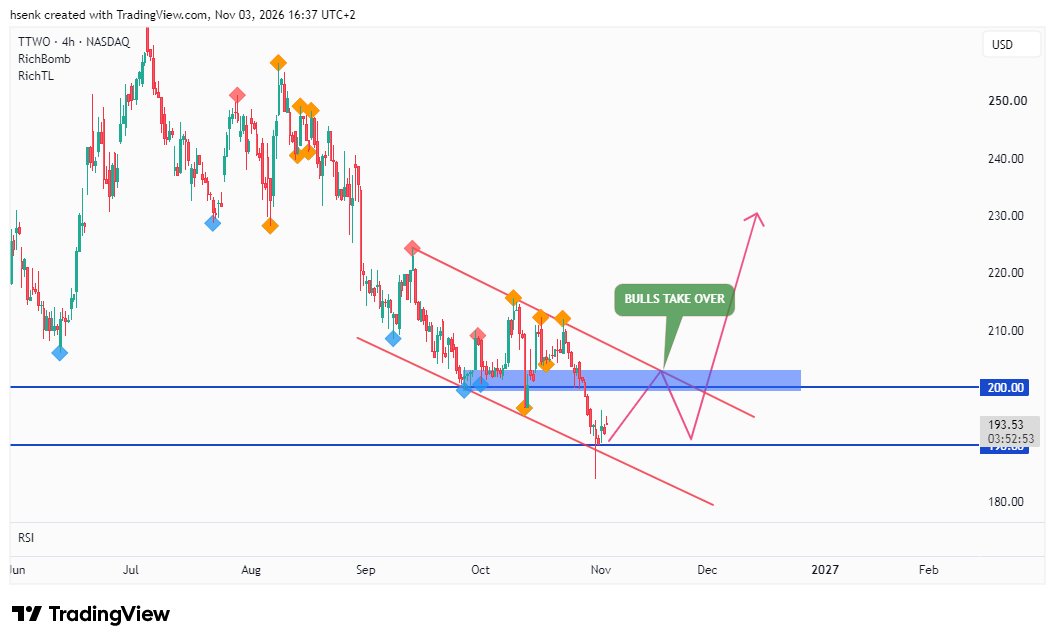
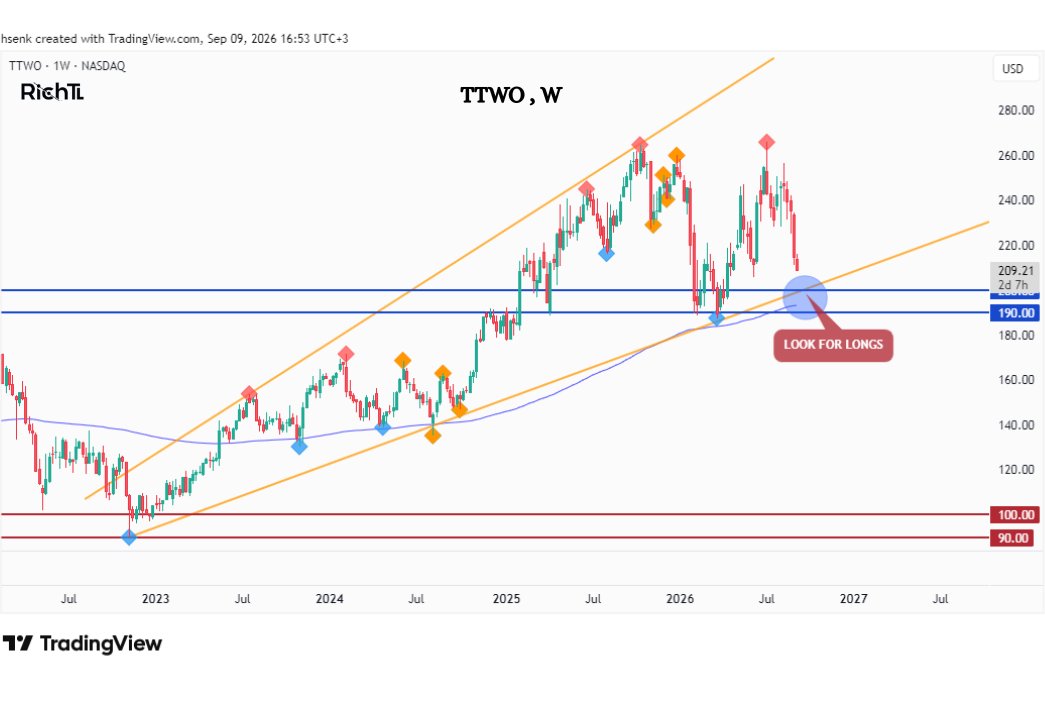
$TTWO is approaching the intersection of:
• $200 round number
• Rising trendline
• 200-week EMA
Strong confluence zone to watch for long setups within the broader bullish trend. 👀
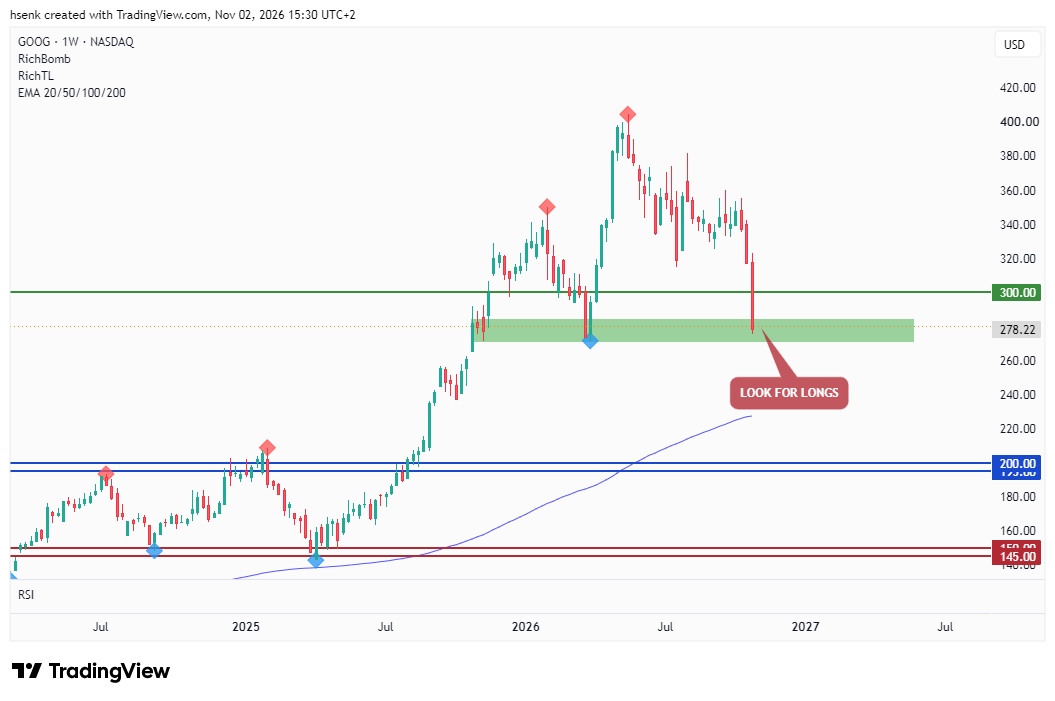
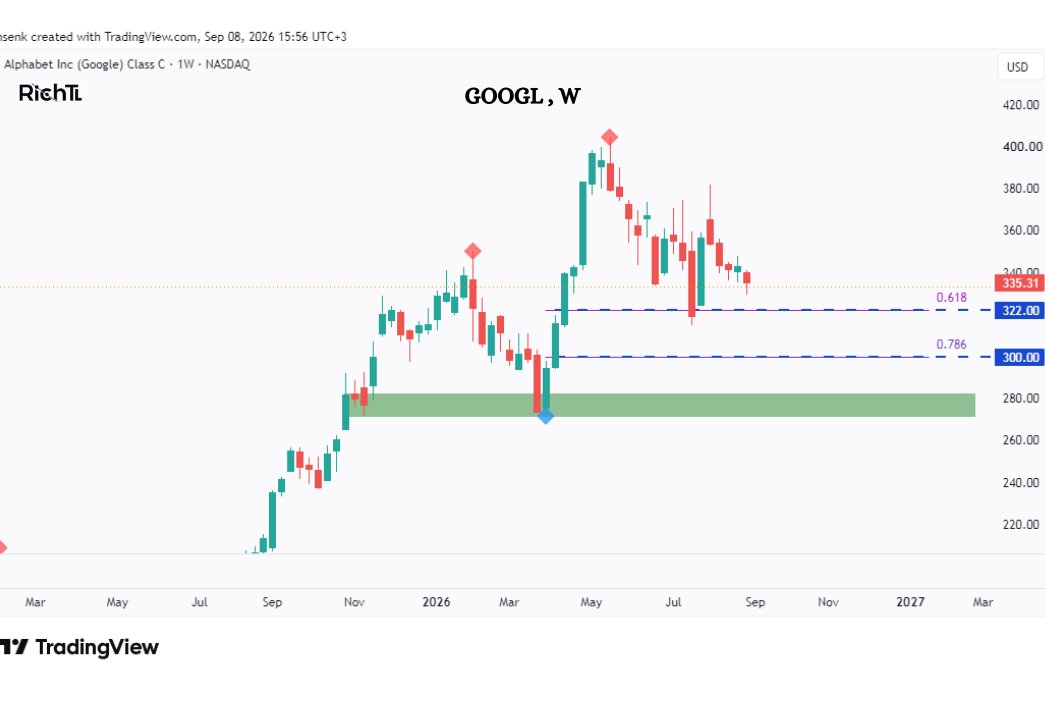
$GOOGL remains bullish, but the question is:
How deep does this pullback get?
Will the 0.618 Fibonacci level trigger another bounce, or are we headed toward deeper discount areas?
The reaction on lower timeframes could give us clues about the next move.
$GOOGL remains bullish, but the question is:
How deep does this pullback get?
Will the 0.618 Fibonacci level trigger another bounce, or are we headed toward deeper discount areas?
The reaction on lower timeframes could give us clues about the next move.
$GOOGL remains bullish, but the question is:
How deep does this pullback get?
Will the 0.618 Fibonacci level trigger another bounce, or are we headed toward deeper discount areas?
The reaction on lower timeframes could give us clues about the next move.
$GOOGL remains bullish, but the question is:
How deep does this pullback get?
Will the 0.618 Fibonacci level trigger another bounce, or are we headed toward deeper discount areas?
The reaction on lower timeframes could give us clues about the next move.
$GOOGL remains bullish, but the question is:
How deep does this pullback get?
Will the 0.618 Fibonacci level trigger another bounce, or are we headed toward deeper discount areas?
The reaction on lower timeframes could give us clues about the next move.
$GOOGL remains bullish, but the question is:
How deep does this pullback get?
Will the 0.618 Fibonacci level trigger another bounce, or are we headed toward deeper discount areas?
The reaction on lower timeframes could give us clues about the next move.
$GOOGL remains bullish, but the question is:
How deep does this pullback get?
Will the 0.618 Fibonacci level trigger another bounce, or are we headed toward deeper discount areas?
The reaction on lower timeframes could give us clues about the next move.
$TTWO is approaching the intersection of:
• $200 round number
• Rising trendline
• 200-week EMA
Strong confluence zone to watch for long setups within the broader bullish trend. 👀
$GOOGL remains bullish, but the question is:
How deep does this pullback get?
Will the 0.618 Fibonacci level trigger another bounce, or are we headed toward deeper discount areas?
The reaction on lower timeframes could give us clues about the next move.