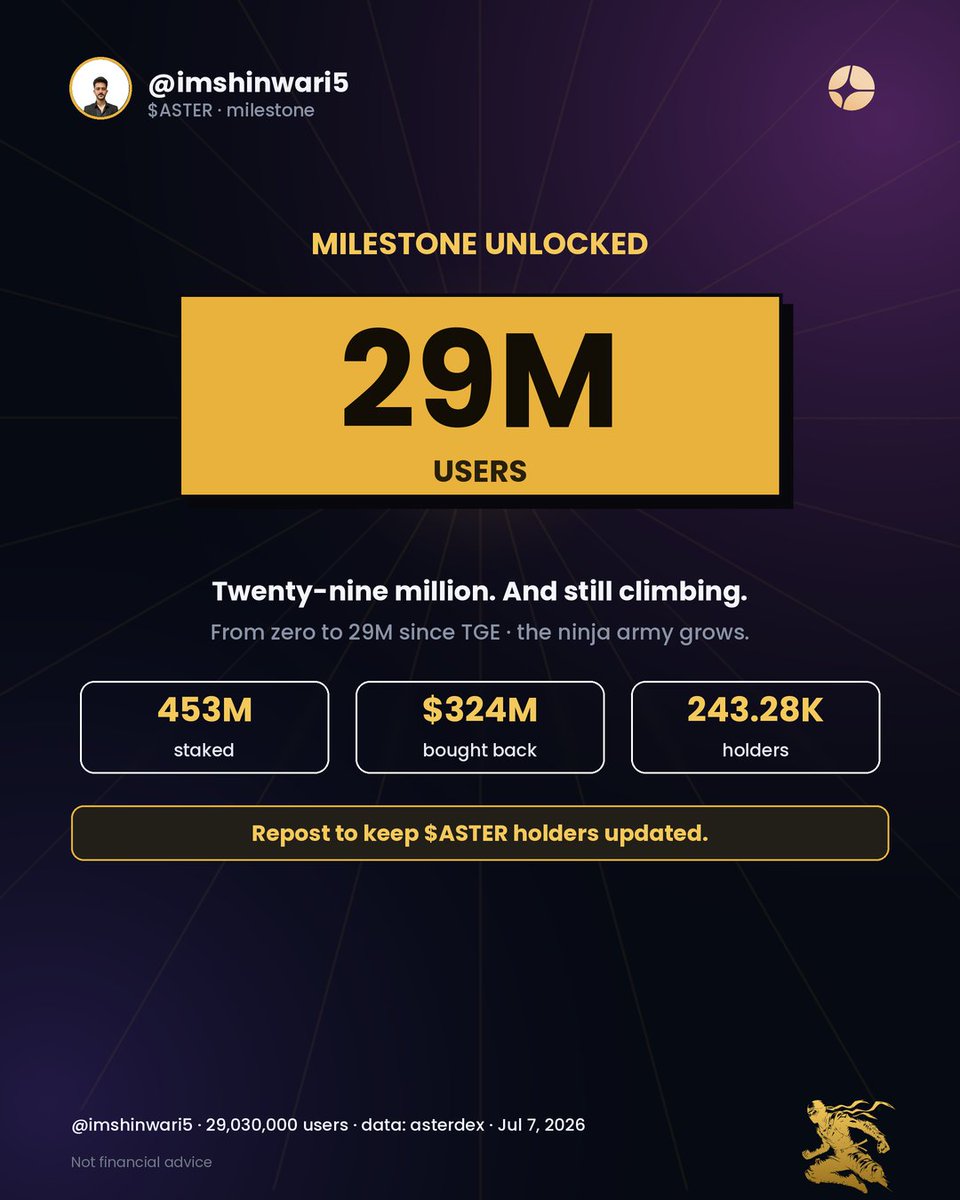
29,000,000 USERS 🥷🎉
@Aster_DEX just crossed 29 MILLION users.
From zero at TGE to twenty-nine million the ninja army keeps growing.
453M staked · $324M bought back · 243.28K holders
Repost to keep aster-2:native holders updated 🥷 @imshinwari5@Leonard_Aster
A some stage, $BTC is going to need to set a higher low on its daily chart.
When it does, be prepared for everyone to call for $50K.
The reality is, if BTC can hold above $61K on a retest and form a higher low above the $58K pivot, I think it's reasonable to remain bullish in the short term.
If we lose $61K, then I'd lean back toward the idea that we're simply following the same bear market sequence.
Flush. Relief rally to set a lower high. Continuation down.
So far, we've only managed to print another daily lower high, but given the structural invalidation sits up at $67K, it was never realistic to expect a single move from $57K to completely invalidate the downtrend.
It's all about the pullback.
If BTC can hold above $61K and print a higher low, I'd become increasingly constructive on the short-term outlook.
If it can't, then we're most likely following the sequence and setting up for another lower low.
bitcoin:native
If we stay below this $75.5K region, I'd expect something like this to play out.
The weekly, daily, and 4H structure all have the same $74-75K region acting as resistance, while the upper side of the channel is sitting around $76K.
If we see price manage to get through both, it would give a compound breakout into higher resistance and challenge the downtrend.
What I think we'll most likely see is a push into $74.5K-75.5K, failure to breakout, then continuation toward $71.5K.
🫡
$ZEC
What’s been interesting about the recovery back to $680 is that the move doesn’t really look retail-driven.
Retail participation has mostly remained flat throughout the structure, while the majority of the buying has continued coming from mid-sized flows.
At the same time, larger institutional-sized flows dropped during the correction, but have slowly started turning back upward. Interestingly, the low in institutional flows also lined up almost perfectly with the local low in price.
That creates a very different backdrop from the type of euphoric breakout conditions people usually expect near reversals.
So far, the move has looked more like sustained positioning coming back into the chart rather than a retail-led momentum chase.
Now ZEC is attempting to reclaim the November high region after breaking above $640.
If larger flows also start pushing back toward their prior highs above this region, then the probability of continuation higher starts increasing pretty quickly from there.
$SOL
One thing that continues standing out on SOL is how different the structure looks compared to BTC and ETH.
While BTC and even ETH managed to build larger ascending structures off the February lows, SOL has spent the last 4 months trapped inside the same horizontal range without any real trend development.
Ranging after a major breakdown is very different from trending after one.
So far, every breakout attempt into the $98 region has been sold back into the middle of the range, while support around the high-$70s / low-$80s continues getting retested over and over again.
The longer a market keeps repeatedly leaning on the same support without expanding upward, the more vulnerable it becomes if general market weakness starts accelerating.
Especially for an asset like SOL, where positioning and beta tend to amplify the downside once momentum flips.
So either this range is marking long-term accumulation, or it’s redistribution before another leg lower.
Right now, I lean toward the second.
$ZEC
Still looking for continuation here.
Structurally, this is still one of the best macro recovery charts in the market right now.
Price has now completed a full V-shaped recovery back into the top of the local $680 range after reclaiming the entire corrective structure from the lows.
That said, I still want to see the $700 resistance region properly cleared before getting too aggressive on continuation.
But once that level breaks and confirms as support, I’m still targeting a move into the $740 region next.
Unbelievable run so far.
$BTC
The biggest threat to bulls within this structure is how much of the range and rally has been built by perp volume.
For reference, when BTC was trading at $60K, spot volume was higher than what we’re seeing now.
Perp volume, on the other hand, has nearly doubled during that same period.
That’s not a particularly healthy imbalance to have while the market is trying to hold the upper half of a major range for continuation.
Especially when spot volume has been deteriorating faster than price.
So now we're facing:
1. A range filled with multiple high liquidation points
2. Less spot volume available to absorb the cascades
There’s a reason we’ve barely seen a meaningful bounce after almost $1B in liquidations since the $83K high.
If there isn’t enough underlying spot volume to absorb that liquidation pressure, the chart will naturally struggle to produce moves back above lost support levels.
So for bulls to have any real confidence in continuation, spot volume needs to start reflecting that demand again, similar to what we saw with the rally from $65K.
$ZEC
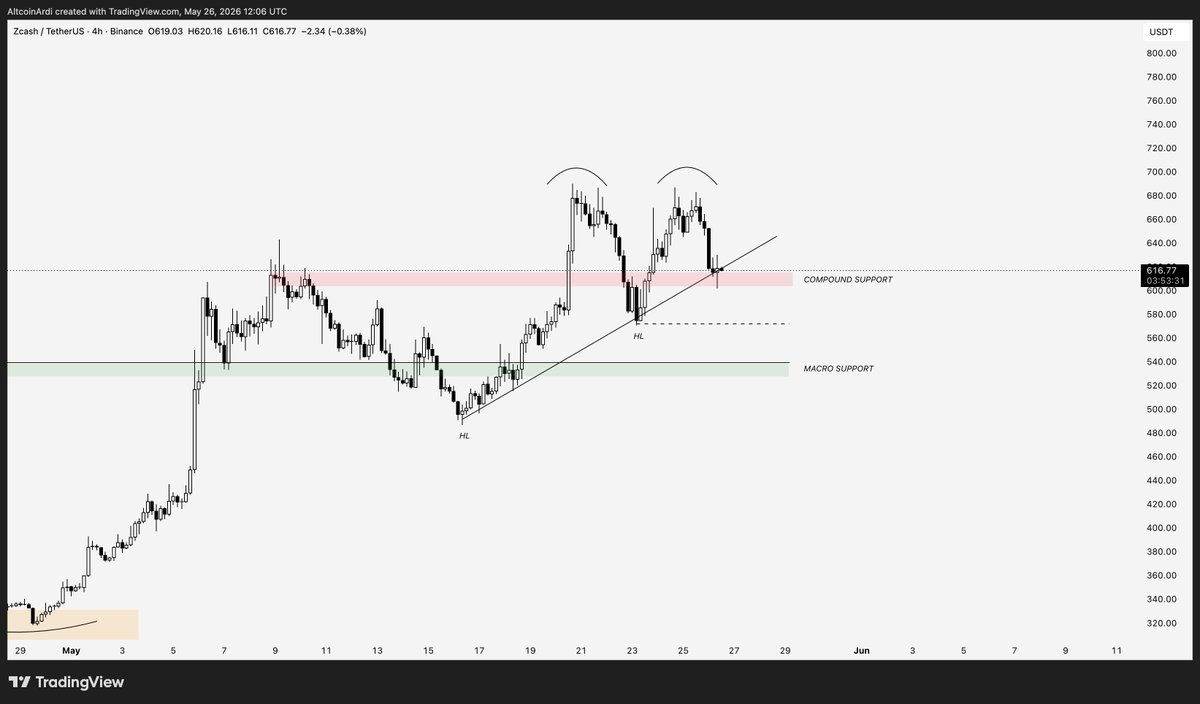
Things are getting interesting.
Once again, we’ve seen the $680 region cap yet another rally.
That’s twice in a week, and not dissimilar to what we saw in November, where $680-700 rejected multiple breakout attempts.
And it’s now setting up for what is probably the most important structural test of the uptrend so far.
Firstly, we’re testing the HTF trendline support, which has been holding this move since $300.
On top of that, we’re retesting the prior local high at $600 in the exact same spot as the trendline, giving us a compound support setup.
If that compound support is lost, the uptrend is going to be seriously tested.
Given we now have two $680 rejection candles forming a potential double top, a loss of the trendline likely means testing the pattern neckline at $575, which would ultimately be the last line of defence.
A loss of that would see macro support at $540 tested once again.
That’s almost a potential -10% swing based on a few important structural variables.
On the other hand, if ZEC can hold here and form its higher low pivot, we could potentially see an ascending triangle type formation develop, which would give us the continuation move above $680.
⌛️
$BTC
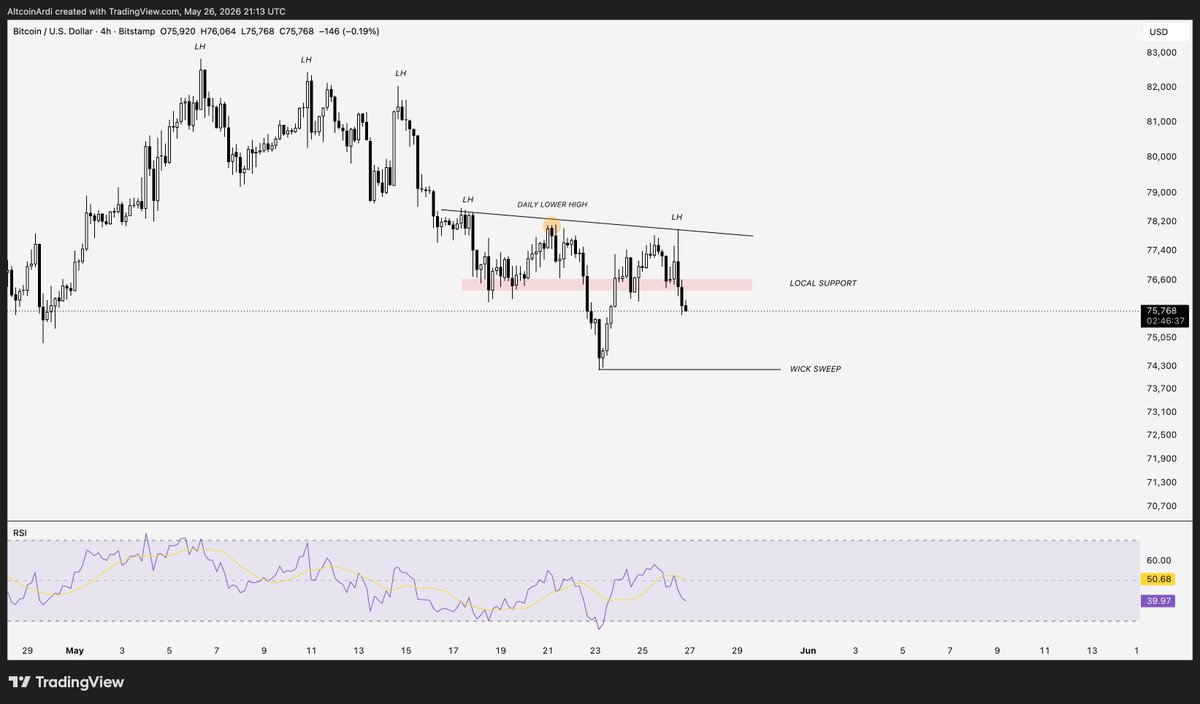
The chart looks ready to sweep $74K.
- 3 weeks of lower highs across multiple timeframes
- 3 failed breakouts above $77.7K
- Lost the $76.4K local support pivot
I don't make the rules.