I just voted for The Brutalist as Best Picture winner in the FT's poll about the Oscars. Who will you vote for? https://t.co/xT3jn05yRD via @FinancialTimes
🧵4/4:
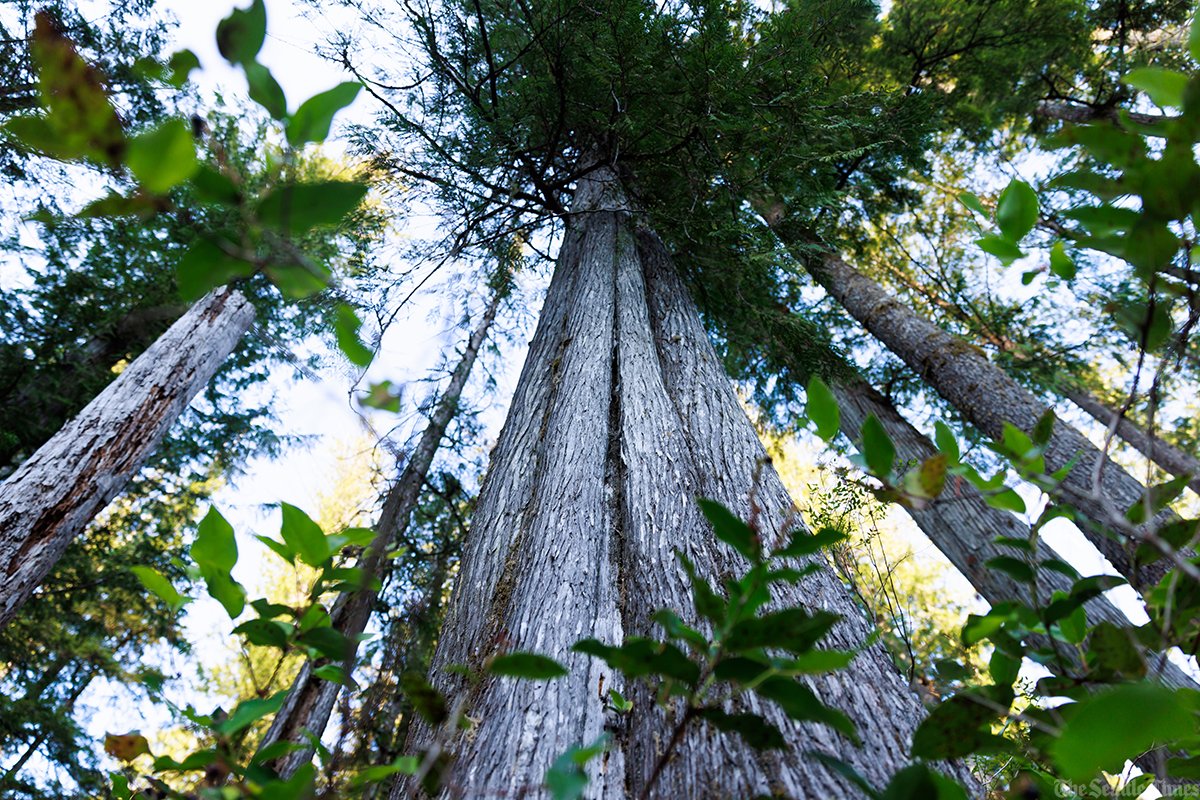
The fruits of these efforts wouldn’t be seen today or tomorrow — but as long as 500 years from now.
Explore the project: https://t.co/BIwKCRAxLr
Reporting: @LyndaVMapes
Photos: @ErikaJSchultz
Video: @laurenfrohne
🧵4/4:
The fruits of these efforts wouldn’t be seen today or tomorrow — but as long as 500 years from now.
Explore the project: https://t.co/BIwKCRAxLr
Reporting: @LyndaVMapes
Photos: @ErikaJSchultz
Video: @laurenfrohne
A Dutch supermarket chain introduced slow checkouts for people who enjoy chatting, helping many people, especially the elderly, deal with loneliness.
The move has proven so successful that they installed the slow checkouts in 200 stores.
Another unfathomable heatwave is unfolding in North America right now. This latest heatwave alone would be remarkable...
But this summer has been exceptionally warm in the Northern hemisphere, punctuated by record-shattering heatwaves across the continents.
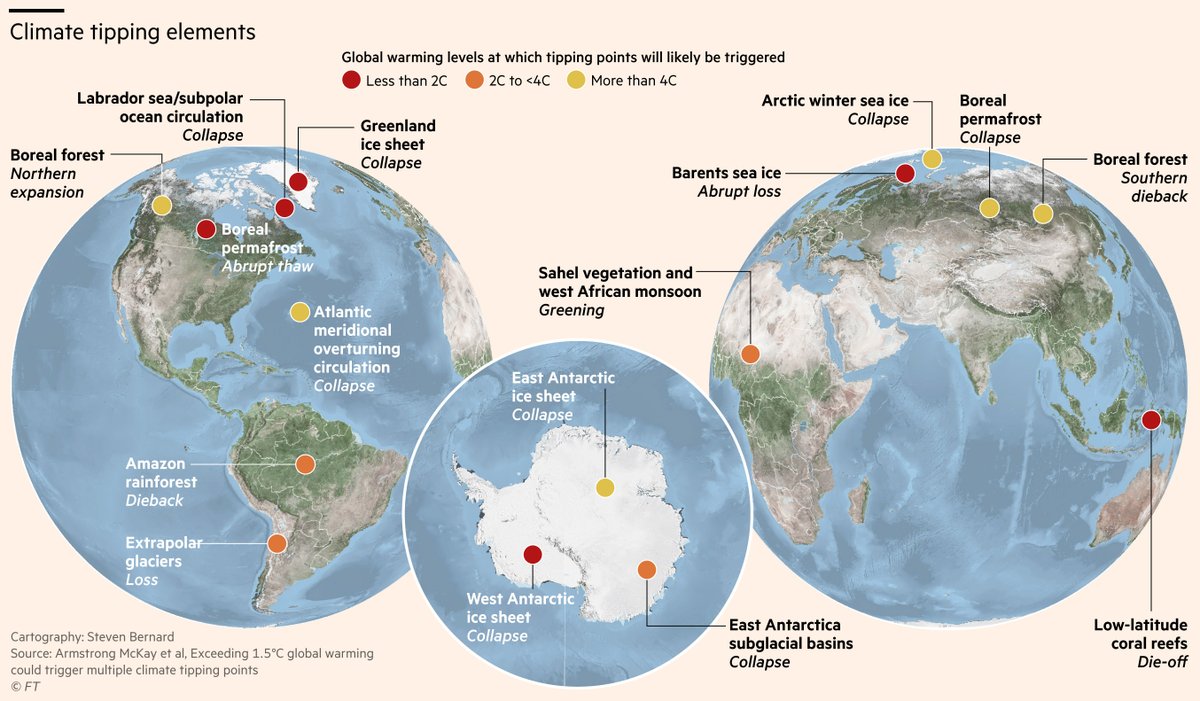
NEW: This week's climate graphic looks at climate tipping points and in particular the Greenland ice sheet melt in September. Huge thanks to @PIK_Climate and @jscarto for the data
Read @CamillaHodgson's excellent report
https://t.co/kOQMXA0ZQS
#dataviz#gistribe
This was so moving. Spontaneously stopped off at the London Bridge station organ to play a couple of pieces for the Queen. This lovely security guard, Marcella, asked if I could play Lascia ch'io pianga. Turns out she trained as a singer! ❤️😭
An incredible example of interactive storytelling with maps, using @Mapbox to show what a spectacular failure the Russian invasion of Ukraine has been so far. Ukrainian resistance is amazing. 🇺🇦🚀
https://t.co/pmiceLLBAQ
And that’s a wrap... Last story written for @ft and it made the home page! Thank you to all my amazing colleagues who made the last 5 years so much fun. I’ll miss you all x
How bad will the global food crisis get? https://t.co/jRgr91IHkq
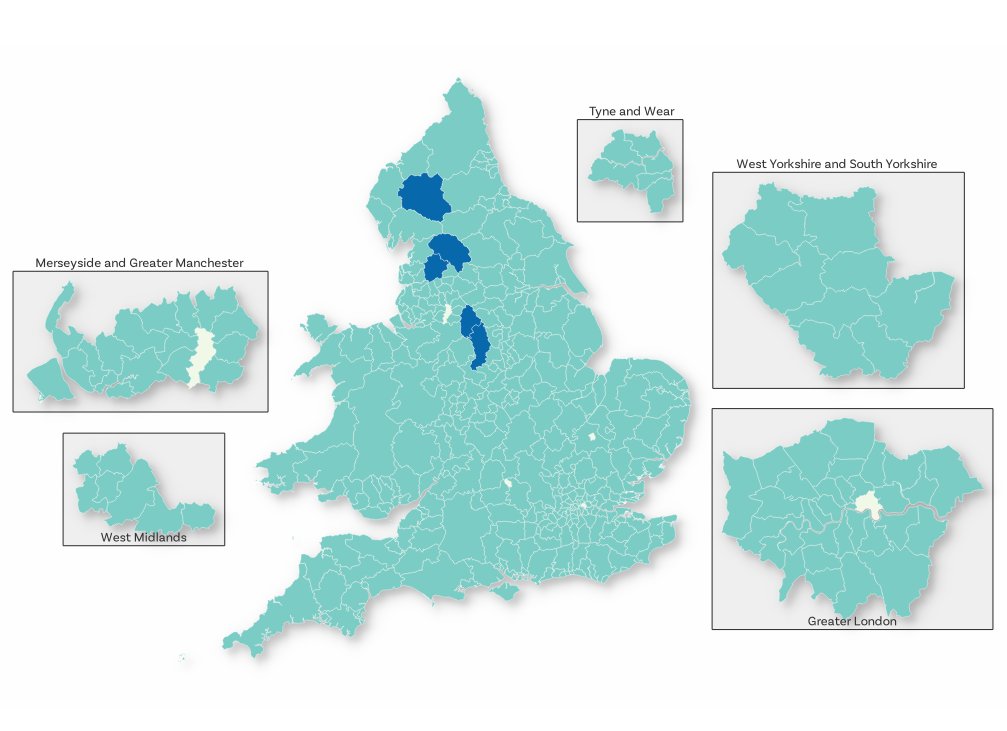
I waited more than a ~day~ before making a Census 2021 map - so here's a very basic view of 'middle aged England and Wales' using the 45-64 definition - dark blue is 30% or higher, light shades = under 20% and everything else is somewhere in between (next tweet has smoother map)
My new online intro-level QGIS course is now live on Udemy, for anyone who wants to get into mapping - or knows anyone that does - see short thread below with further details
https://t.co/tQxmG163SW