$ZIG looks ready to bounce.
Did 2x in may, even while large caps were dumping. Now momentum is getting stronger.
TVL is growing, big partnerships secured, buyback starting July 1st.
Daily crypto volume reached a new all-time high on June 2.
@Polymarket processed $175.8M.
@Kalshi processed $107.6M.
Combined, the two platforms facilitated more than $283M of crypto-related prediction market volume in a single day.
The immediate reaction was to frame the event as a market-share battle.
The more interesting question is why both platforms reached records simultaneously.
…
α/ The June 2 ATH
The prediction market sector has already experienced explosive growth throughout 2026.
> Prediction markets processed roughly $27B in January alone.
> March volume reached approximately $25.7B across the sector.
> Combined lifetime volume across Polymarket and Kalshi surpassed $150B earlier this year.
Against that backdrop, June 2 produced another milestone.
➢ Polymarket crypto volume reached $175.8M.
➢ Kalshi crypto volume reached $107.6M.
Both established new daily highs according to Artemis data.
The key observation is that volume expanded on both venues at the same time.
…
β/ Two Platforms, Two User Bases
Polymarket and Kalshi are often treated as direct substitutes.
The data suggests they increasingly serve different audiences.
Polymarket remains primarily crypto-native:
> Wallet-based onboarding.
> Stablecoin settlement.
> Crypto-focused market participation.
Kalshi’s growth has come through a different path:
> Regulated access.
> Traditional payment rails.
> U.S.-based users.
This distinction matters because growth on one platform does not necessarily require contraction on the other.
The June 2 ATH demonstrates that demand expanded across both user cohorts simultaneously.
…
γ/ Event-Driven Trading Demand
One pattern appears repeatedly throughout prediction market history.
Volume spikes when uncertainty spikes.
Prediction markets are not simply betting products.
They are mechanisms for pricing uncertainty.
Recent sector growth has been driven by:
> Crypto markets
> Politics
> Sports
> Macro events
> Regulatory outcomes
As volatility increases, traders seek faster ways to express views.
Prediction markets increasingly function as one of those venues.
The June 2 record should be viewed through that lens.
Not as an isolated volume spike.
But as another example of event-driven demand overwhelming prior liquidity records.
…
δ/ The Volume Share Question
The most important metric going forward may not be total volume.
It may be volume share during major volatility events.
Historically, liquidity tends to concentrate during periods of heightened activity.
The platforms that attract the deepest liquidity often strengthen their position after each major event cycle.
For now, the data suggests neither venue is winning outright.
Instead, both are benefiting from broader category growth.
That is a different dynamic than most crypto exchange battles.
…
λ/ What June 2 Actually Proved
The June 2 ATH did not prove that Polymarket is defeating Kalshi.
Nor did it prove that Kalshi is taking share from Polymarket.
What it demonstrated is that demand for event-driven trading continues to expand.
Both platforms reached record crypto volume on the same day.
That suggests the immediate story is not competition.
It is category growth.
And until one venue begins capturing a disproportionate share of volatility-driven flows, that remains the most defensible conclusion supported by the data.
Everyone waiting for BTC to “confirm the bottom.”
Good luck.
The funny thing about confirmation is that it’s usually just a higher price.
@cryptoquant_com says Bitcoin demand fell by roughly 501,000 BTC over the past month.
People see that and think “obviously bearish.”
Maybe.
Or maybe that’s exactly what a market looks like after spending weeks shaking people out.
Every cycle is the same.
The market dumps.
Everyone becomes cautious.
Everyone wants confirmation.
Nobody wants to buy uncertainty.
Then BTC rips 15-20%.
Suddenly the exact same people start calling it strength.
The chart didn’t change.
The price did.
My experience has been pretty simple:
If you’re waiting for the market to make you feel comfortable, you’re probably not buying the bottom.
You’re buying proof that the bottom already happened.
Tried out the @TMGM_CryptoCFD app recently and one thing I noticed is how quick it is to get a market overview.
Instead of jumping between different websites and apps, I've been able to keep track of what I'm watching from one place.
Not every day is a green day, but having a platform that's easy to navigate definitely makes the process less frustrating.
A recent result from my account below :
Still testing it over time, but first impressions have been positive.
Explore the campaign here
https://t.co/Sv922IBpAV
While everyone is gassed about tokenized stocks.
I think the bigger story is what happens after tokenized stocks work.
That’s where @OndoPerps gets interesting.
The market has basically spent the last two years proving people want onchain exposure to real-world assets.
Cool.
Now what?
Because eventually every market follows the same path:
1. Spot works
2. Liquidity grows
3. Derivatives arrive
4. Activity explodes
Crypto did it.
Commodities did it.
Equities did it.
RWAs were always going there.
The reason I’m paying attention isn’t because Perps launched.
It’s because this might be the first sign that RWAs are graduating from an asset class into an actual market.
Most protocols are still trying to bring more assets onchain.
Ondo is trying to build things people can do with those assets.
That’s a different bet.
The obvious comparison is Hyperliquid.
I don’t think that’s right.
@HyperliquidX owns crypto-native leverage.
@OndoFinance is trying to own leverage around tokenized real-world assets.
Those aren’t the same users.
Those aren’t even the same markets.
If tokenized equities become a real category over the next few years, derivatives were always going to become the largest piece of the stack.
That’s what happened everywhere else.
Wow, so this was staged all along. The “robbery” was a marketing bait used to launch a challenge.
So, CFT founder @alanshz was scammed years ago by a prop firm. Now he is introducing BREAK to flip that experience into a narrative driven product, one that positions itself as a response to the flaws of traditional prop firms.
solana real world assets just recorded their biggest transfer volume day ever.
daily transfer volume surged past $1.49B, more than doubling from the previous day. Over $1B of that activity came from preSPAX alone.
this activity only further proves the growing demand for tokenized assets on solana.
31 protocols generated more than $10M in 30d fee.
The interesting part is where that fee is coming from.
> @HyperliquidX: derivatives
> @Aave: lending
> @Polymarket: prediction markets
> @Pumpfun: launchpads
> @JupiterExchange: trading infrastructure
> @PancakeSwap: exchange activity
Different products.
Same outcome.
Users continue paying.
While token prices have spent weeks chopping, these sectors continue monetizing behavior that persists across market environments.
Traders still need leverage.
Capital still needs to be borrowed.
People still speculate on outcomes.
New assets still need distribution.
That creates a useful filter.
Price tells you where attention is.
Fee tells you where users are finding enough value to pay.
The sectors generating fees today are often the sectors building the strongest flywheels underneath the surface.
Narratives rotate.
Revenue compounds.
Seeing more savings and yield opportunities emerge around USD1 got me thinking about how stablecoin ecosystems evolve over time.
A stablecoin being issued is only the starting point.
The harder part is creating enough utility around the asset afterward.
> Trading.
> Payments.
> Savings.
Different products serving different user needs.
That’s why developments like this are worth watching.
Not because of the yield itself.
Because every new use case gives capital another reason to stay within the ecosystem.
you can own very few web3 assets
- tokens
- stablecoins
- NFT
- RWA
same mind-blown facts:
- 100% of you own stablecoins
- 6.8% of the global population, or over 560 million ppl own tokens
- ~11.87 million NFT users by 2026, with 0.15% user penetration globally
- 903k unique onchain addresses holding tokenized RWAs, approx. 0.011% of World Population
- Bitcoin ~1.3% is the most held crypto
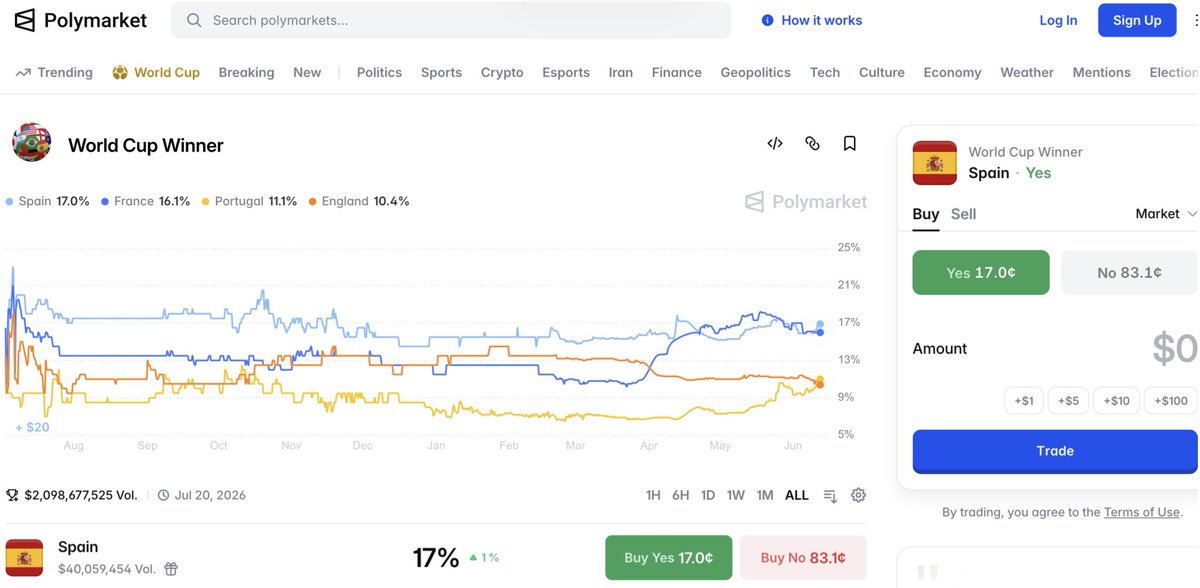
Polymarket just crossed $2B on a single World Cup contract.
The World Cup market is already larger than every major sports market Polymarket has previously hosted.
And the tournament only just started.
Many are betting on Spain to win. Which team are you backing?
Two Kinds Of Institutional Money Looked At The Same Bitcoin And Did Opposite Things
Between May 15 and June 3, U.S. spot Bitcoin ETFs recorded a 13-day outflow streak.
Roughly $4.4B left the complex.
On June 3 alone:
> IBIT: -$342M
> FBTC: -$54M
> Every other major fund: largely flat
The headline wrote itself.
Institutions were selling Bitcoin.
Except another group of institutions was doing the opposite.
During roughly the same period, public companies led by Strategy and Strive added 4,508 BTC, worth approximately $288M.
Same asset.
Same market.
Opposite behavior.
The mistake is treating both flows as the same signal.
They’re not.
ETF flows measure allocators.
Treasury purchases measure balance sheets.
One group manages:
> Portfolio weights
> Risk budgets
> Liquidity needs
The other is making long-term capital allocation decisions.
Crypto keeps asking whether institutional money is bullish or bearish.
That’s the wrong question.
Institutional money isn’t one thing.
A treasury buyer and an ETF holder can look at the same chart and reach completely different conclusions because they’re solving completely different problems.
What’s interesting is what happened next.
June 12 saw net inflows return, with roughly $85.9M entering spot Bitcoin ETFs.
The divergence that looked so dramatic a week earlier began narrowing almost immediately.
Which is exactly the point.
Most people interpreted the ETF outflows as a change in institutional conviction.
They were more likely a change in institutional positioning.
Treasury buyers treated the drawdown as an opportunity.
ETF allocators treated it as a rebalance.
Calling both “institutional sentiment” collapses two fundamentally different signals into one misleading number.
The first challenge for a stablecoin is distribution.
The second is capital retention.
That’s why I pay attention to opportunities around USD1.
Not because of any individual campaign.
But because capital now has multiple destinations:
> Binance: 6.39% APR
> Gate: up to 20% APR
> Binance Simple Earn: up to 10.5% APR
> MEXC: 9% APR
> Bybit: 10.78% APR
> Lorenzo Vault: 11% APY
> Dolomite: 10% APR
> TownSquare × Native: 12.32% APY
The more productive homes capital has, the easier it becomes for liquidity to remain inside the ecosystem.
That’s a different milestone from adoption.
Oil down 3.66% in 24h. BTC up 3.4%.
Almost a perfect mirror. That symmetry is not a coincidence and it's not bullish.
When macro relief and risk-on move at the same magnitude, it means BTC is trading as a geopolitical hedge, not as a risk asset. The Strait of Hormuz deal gave oil sellers relief and BTC buyers a reason. Both moved the same amount in opposite directions.
April told you how this ends. First ceasefire: BTC $65K → $78K overnight. Truce collapsed. Every dollar reversed.
Markets remembered. This time the response was calibrated from the start.
@Polymarket has the deal signing at 86%. Iranian uranium surrender (the actual substance) at 9%. The ceremony is priced in. The compliance isn't.
BTC is tracking the second number.
Fear & Greed sits at 20. Extreme Fear. Unchanged after the bounce. Price moved. Sentiment didn't. That's a relief trade with a short leash.
The confirmation markers:
> Strait of Hormuz operationally verified 72+ hours
> BTC ETF net inflows positive 3 consecutive days
> Fear & Greed crosses 30
Until those clear, a 3.4% move on a 3.66% oil drop tells you exactly what this market thinks the deal is worth.
Prop traders often face high fees, strict daily loss limits, delayed payouts, and rigid drawdown rules
@CFTradercom removes these constraints with the new BREAK evaluation.
The idea behind “BREAK your limits” is removing these common frustrations that make traditional prop firm difficult and stressful.
Use code elite7 to get 50% off your first BREAK account.
What a night at UFC Freedom 250.
My favorite Justin Gaethje’s relentless pressure left Topuria’s face visibly damaged round after round.
Seeing @worldlibertyfi on the Octagon flipped a switch for me. USD1 is no longer niche. Liquidity is expanding and attention is shifting from crypto native circles into mainstream sports.
Impressed by USD1’s growth and the well-deserved fighter bonuses.
Crypto card cumulative volume hit $8B as of June 17, 2026.
Sounds like mass adoption. Look closer.
Top 5 cards capture 87% of all volume. The long tail is statistical noise; dozens of products competing for 13% of a market that hasn't crossed $8B cumulative.
The concentration map (30d volume):
1. @Nexo card — $281.71M
2. @ether_fi Cash — $80.54M
3. @RedotPay — $58.4M
4. @Cypher_HQ_ — $7.8M
5. @Bitget Wallet Card — $4.76M
Everything below that line is fighting for fractions.
What the data is actually saying:
Crypto card adoption is not broad. It is deep in a handful of products and essentially zero everywhere else.
This is not a market with ten viable competitors. It's a market with 5 real ones and a pool of products with live URLs and dead volume.
> Nexo leads on volume but runs a custodial model: yield-bearing balances drive card spend, not wallet-native behavior
> EtherFi is the only top-3 product with a self-custodial, borrow-to-spend architecture, different user entirely
> RedotPay runs on pure stablecoin spend: no yield, no collateral, highest accessibility ceiling
Three different models. Three different users. All three winning simultaneously means the market isn't unified; it's three separate use cases wearing the same product label.