lista @lista_dao just added $40m in $USD1 liquidity becoming one of the largest $USD1 liquidity hubs in DeFi
These are some of the lowest rates available for $USD1 borrowing:
➡️ 1.16% $BTCB/ $USD1
➡️ 2% $USDF/ $USD1
➡️ 1.97% PT-$USDe/ $USD1
This enables some looping strategies with insane yield on stables >20% with serious size
(>$10m) when you borrow $USD1 to:
➡️ Loop and yield farm with PT-$USDE
➡️Loop and yield farm $asUSDF
➡️ Use binance earn for 20% on $USD1
Read more 👇
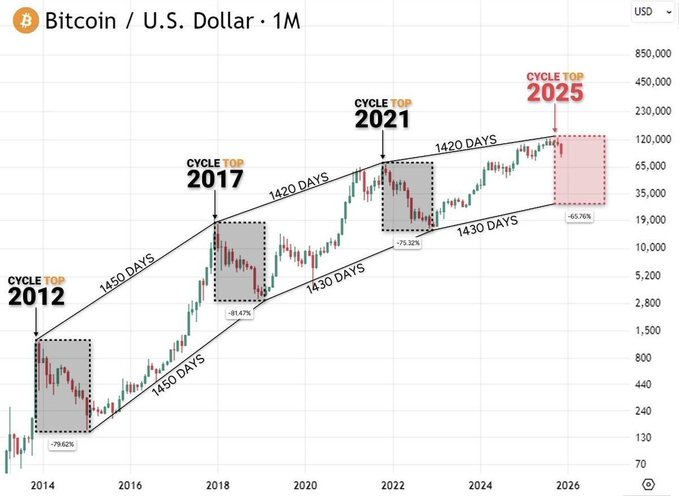
This chart predicts $BTC will dump to $32,000 next week.
The 4-year cycle is now complete, and we might be entering the longest bear market in history.
Are you actually prepared for that scenario?
$ETH is pushing to the ~$3,080 highs.
Nice to see Ethereum is pushing upwards as 2026 started.
For trades, I'm watching the sweep of ~$3,080 for shorts after the failure. So I'll be waiting on a MSB after the liquidity grab above it.
If we continue to show strength above $3,080 and get a full 4H reclaim, we can try to catch a breakout trade/long.
The ~$2,900 rangelow is interesting for longs after reversals. Again, I want to see some liquidations coming through, so a nice sweep of the lows first is preferable.
The ~$2,800 low still has untapped liquidity, if price drops to that region, longs after reversals become interesting again.
I think we're all ready for some action here.
BREAKING 🚨: Diamonds
Diamonds may be a girl's best friend but they're your portfolio's worst nightmare. Prices have fallen to their lowest level this century!
$BTC - is the bear market here?
Why using MA's is essentially gambling.
Alright, the is about the 7th time I get tagged of someone telling me the following:
"We closed below the 50W MA and are far below it, so the bear market started".
Okay, I like your thinking. Using actual data to predict price.
However, have you thoroughly fact checked this data? Who brought you to the idea, did you come up with this yourself?
All power to you, regardless of the answer, but just a simple check, can help you very far.
So I will quickly present you here why using MA's is something only "chartists" do, but has 0 use in trading as it is essentially gambling.
Indeed, I will simply and effectively show you how, it has no merit to use a random average price of the x most recent candle closes, as a metric whether price will go down or up.
The data
MA's are broad, so let's use something truly relevant right now as an example. Since so so many people are confidently and loudly preparing for the bear market, almost as if they have their limit orders ready to buy $BTC at 50k/40k/30k... wouldn't it be great to present how most of the data I have to debunk time after time (the one of the 50 W MA), is a pure myth of fairy dust...
So as mentioned, the argument goes: Astro, we closed below the 50 W MA and are significantly below it, that has "always" been a bear market trigger.
Well, let's check, and let's check properly (non cherry picked).
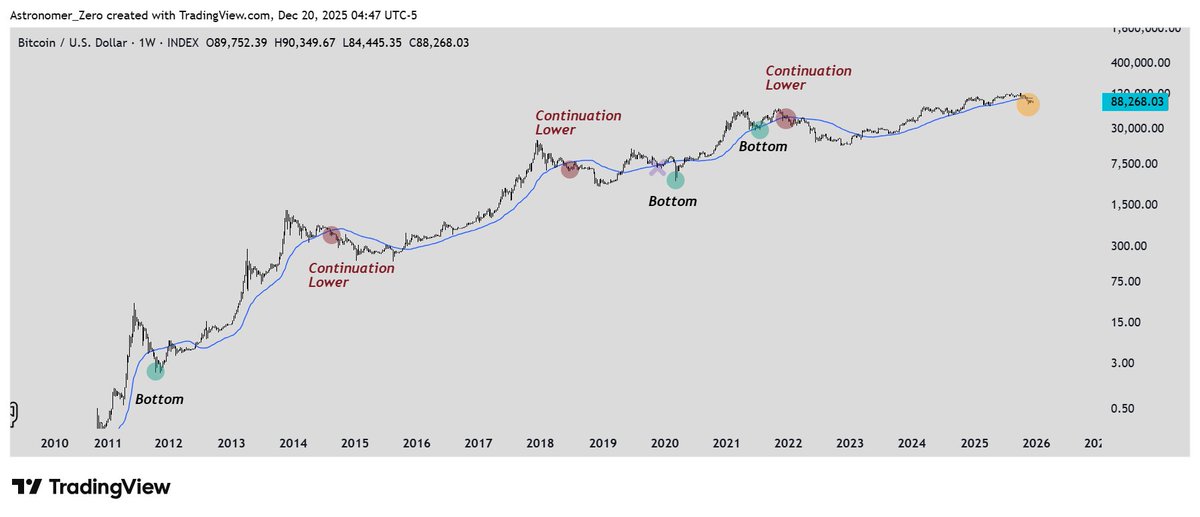
On the chart below, I highlighted every single weekly swing low that has formed each time $BTC fell under the 50 WMA. And I did that throughout its entire history (no cherry picking)
What's a swing low? It's per classic institutional definition: a candle where the low of the candle to the left and right are both higher than the candle itself. Indeed, the very definition of a low, in its most simple and fundamental form.
To eliminate even more noise, I only counted the swing lows where also a candle close below the 50 W MA has been placed (otherwise, a wick into the 50W MA, would also be counted as a bottom, and the data would look even less favorable for the bear market callers here, so, I choose your side wherever I can).
The times of the first weekly swing lows after which $BTC went from closing above to closing below the 50 W MA are:
➡️17 Oct 2011
➡️18 Aug 2014
➡️18 Jun 2018
➡️(25 Nov 2019)
➡️9 Mar 2020
➡️19 Jul 2020
➡️13 Dec 2021
And today:
➡️17 Nov 2025
For each of the occasions, price headed lower, 3 out of 6 times. And 3 out of 6 times, price printed the absolute bottom.
Yes, I left out 25 Nov 2019 (covid crash, if it didn't happen, it would have been a bottom, otherwise, technically price heading lower, although it went so quick, that it is hard to call it a prolonged bear market, so let's skip it. The results do not change much).
So in essence, if you are using this as a sole argument to call whether the bear market is in or not, then you are essentially betting your money on a coinflip i.e. you are gambling.
The problem with MA's
I don't really have an issue with MA's. They can be useful, but they are purely descriptive. So, they are nice to see on charts, and "chartists" often use them to describe price:
"Price is below the MA, price is above the MA, price is far below the MA, price is far above the MA"
But they are not predictive.
If price is "far" below the MA, it doesn't mean price will perform a mean reversion => followed by a reversal i.e. a bottom
Or a mean reversion => followed by continuation lower
As I have just shown with this example. To use them whether they have the power to call a bear market or not, is a complete toss-up.
And that is because of their core problem: they carry no logic. They are simply the average price of the most recent x candles. No one cares what that price is. Institutions don't care, the trend doesn't care, the macro economics don't care, the whales don't care, no one cares.
If a trend is "riding" the 20 ma, that is just a description of the steepness of the trend. If the trend changes, then all the 20 ma buyers will get rekt.
If the trend steepens even ever so slightly, then the 20 ma buyers will all get front run and have to fomo in higher.
They just describe the steepness of the trend, they don't define the trend, and the same is true for bear markets, they don't define bear markets (or bull markets either).
Conclusion
The 50 MA, and MA's in general, have no statistical power (not even negatively i.e. in counter sense), nor do they care any logic. They are completely descriptive, and completely random in predictive power.
To call whether the bear market has started, or we just printed another bull market bottom, it's best to use other, more logical and statistically powerful data.
Let this be clear. IMO anyone using MA's should just be classified as a chartist with no implication on stakes. Or he or she is just trying to describe price and has no ability to predict price, at least not using those metrics.
So all power to them, but best not to mix both up, even if said influencer tells you how "perfectly" price bounced off his or her ma. Great, but not great for consistently being successful in this game.
Successful trading and investing is just as much about using the right data, as avoiding the wrong data.
Especially the latter, so here is another piece to your puzzle of mastery.
Take it, or leave it.
This is just my view.
It's up to you if you believe it.
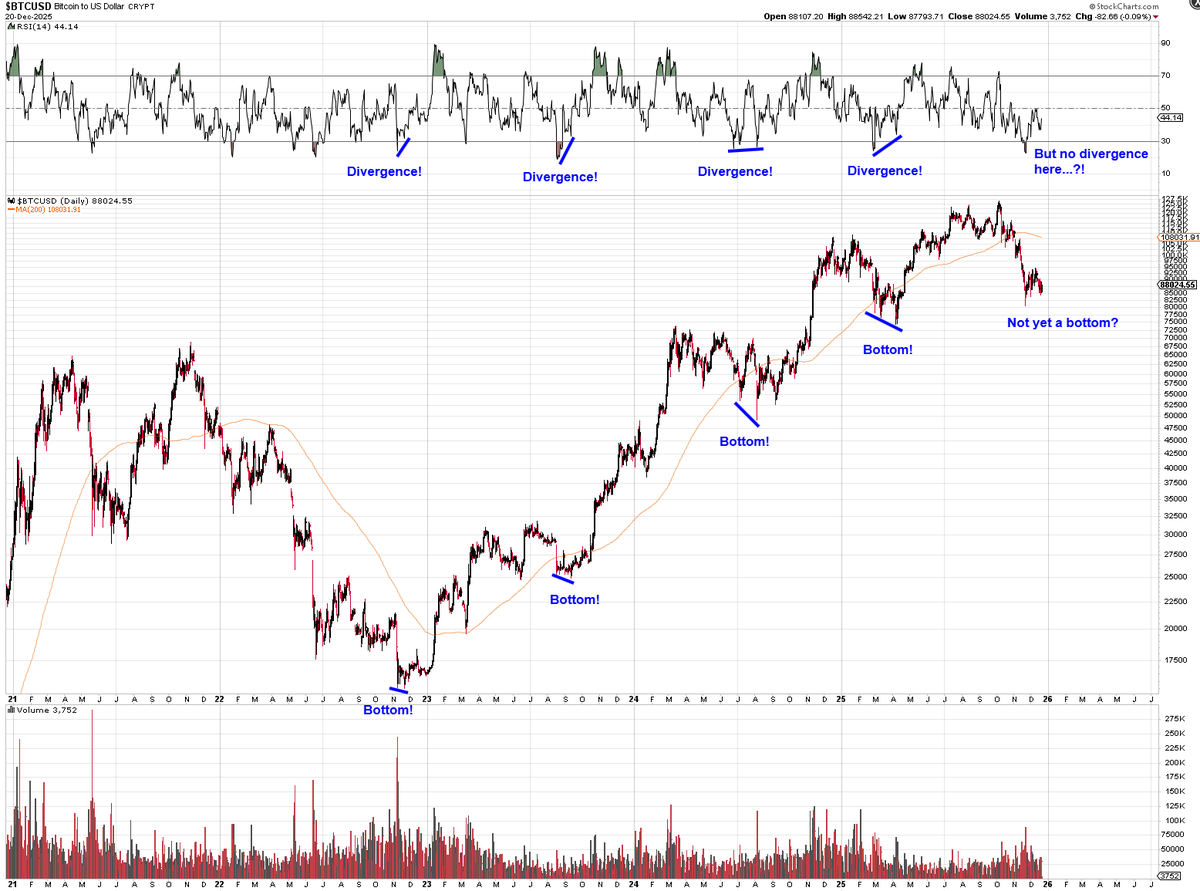
$BTC If strictly just looking at RSI divergences, we have had 4 notable ones dating back to the 2022 lows.
Each time marked a bottom for Bitcoin.
Notice something different about today? No RSI divergence.
Do we need to create one in order to create a bottom...?!
🤔
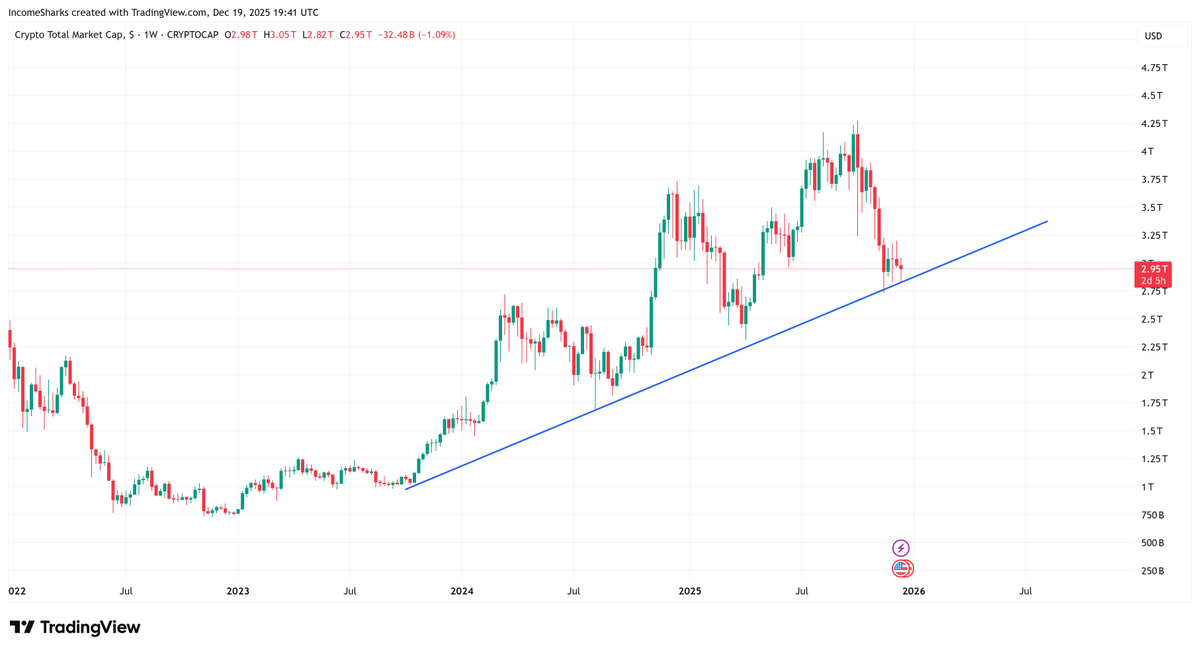
ALTSEASON IS COMING
BTC is testing the base of a 3-year rising channel
Every touch of this trendline has marked a major reversal
This retest lines up with oversold momentum across majors
Bounce here would shift flows back into high-beta alts
The last 3 cycles for Bitcoin all lasted around the same amount of time.
2015-2017: 1067 days
2018-2021: 1059 days
2022-2025: 1062 days
Sometimes the simplest indicators are the best.