$BTC
Trolled a lot today, but here's some genuine thoughts. I talked about this years ago as well so it's not something new I've added to my chart (it's how I publicly sold the 2021 tops).
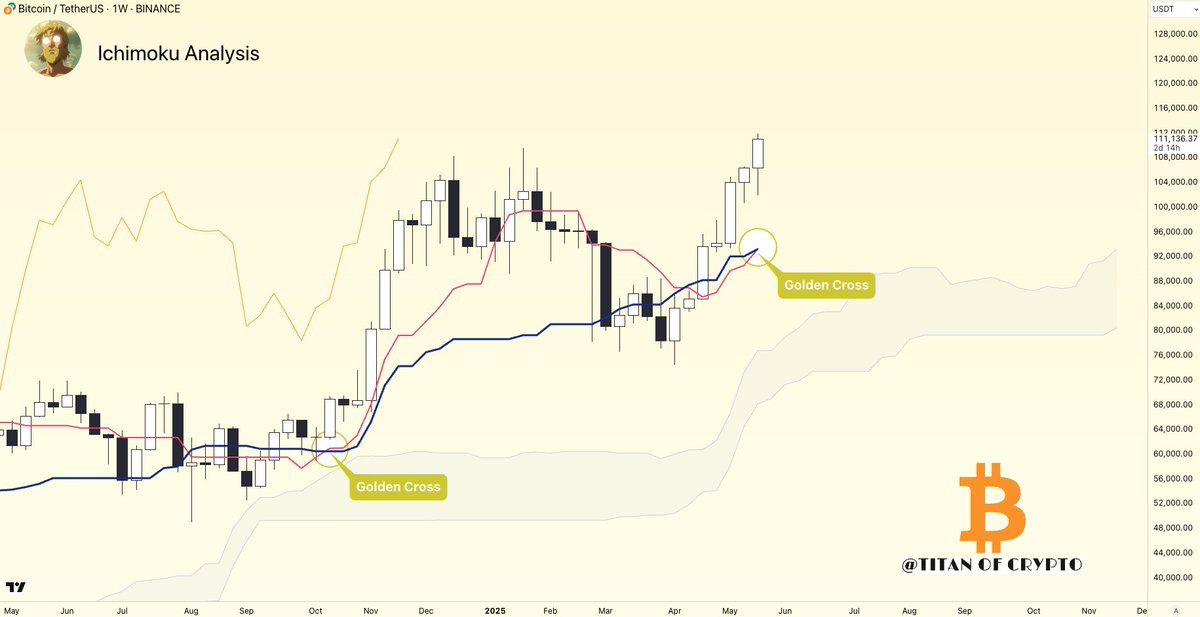
Every time price deviates FAR outside the EMAs (circled areas), we always see a pullback. Even if that pullback if brief before more upside, it's a pullback. Now, we're 7 green weeks in a row and way outside the EMAs (Superguppy indicator).
It is very possible that the landscape has changed via ETF inflows, Saylor, and other big entities, but historically, this area would be a good sell or area to wait for a pull back.
Godspeed to HODL'ers and degen longers who have no fear of downside, I wish you well, but I do think the pullback is coming sooner than later (perhaps just to low 100K's, but we'll see).
Go ahead and troll me as price continues to rip higher, but this will be the FIRST TIME it continues to endlessly rip outside the Superguppy if it ends up doing so. And you can go on the Bitstamp chart and backtest that to 2013 (extension outside the Suppyguppy on the Weekly always ends up in a decent pullback).
Good luck.
Truflation data shows inflation has stayed under 2% for a while—well below the Fed’s target. With that goal met, rate cuts are likely on the horizon. This is a bullish signal. Now is not the time to sell. #Inflation#RateCuts#Investing#Markets#Finance
$ETH Pretty messy price action the past 2 weeks.
Marked some levels on the chart that got my interest. Currently range bound as is BTC and the Total crypto market cap.
Not looking to do much until we at least convincingly break out of this local range.
High Timeframe Support & Resistance being $2100 & $2800.
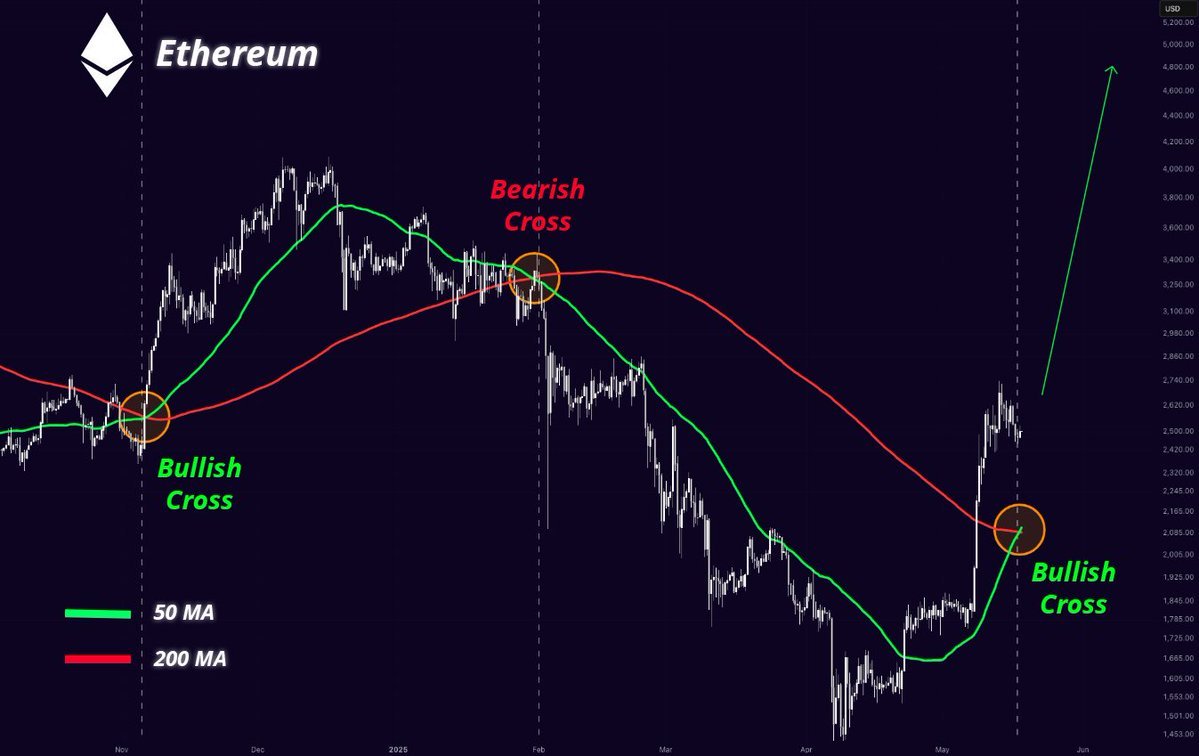
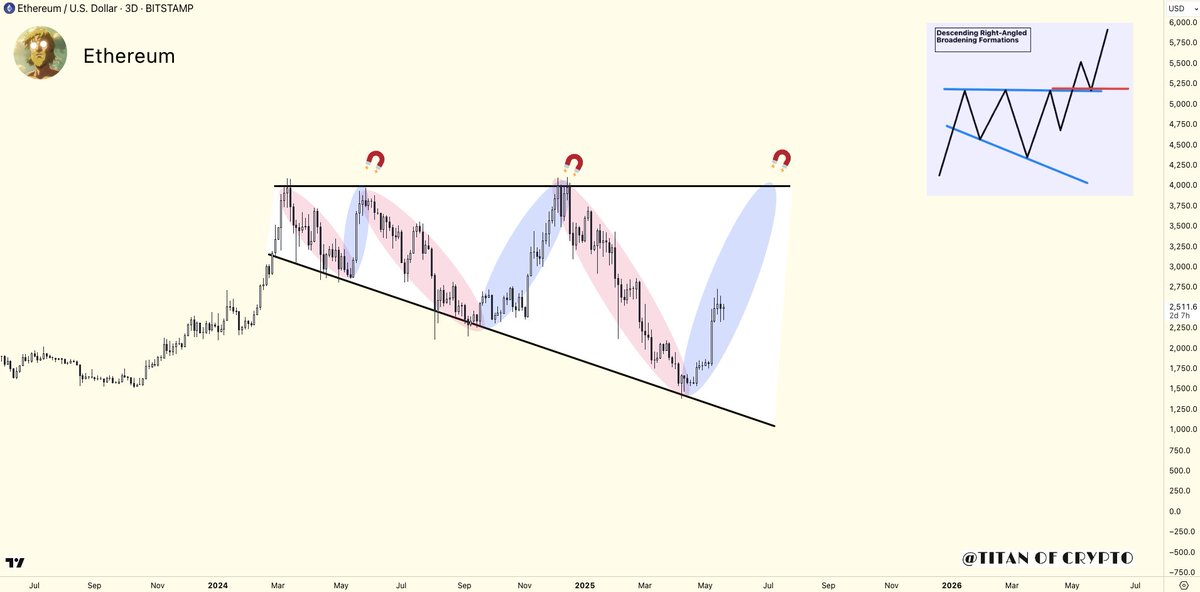
#Ethereum Ready to Explode? 💣
A rare descending broadening wedge is forming on the 3-day chart.
This pattern often precedes explosive breakouts and the structure looks textbook.