Daily Elliott Wave Analysis for #Bitcoin $BTC and more!
Terminal: Analysis & Live Charts for 100+ Titles, EW education, trading community & indicators.
#Bitcoin / bitcoin:native
Shorter Timeframe
I’ve now calmly reviewed the entire structure, indicators, and symmetry of the movements again, including from a timing perspective, and adjusted everything accordingly.
We are currently at a strong resistance level for bears, located around the previous swing low, the 200-week SMA, and the 261.80% Fibonacci level of the orange (3). This is a level where liquidity grabs and massive volatility can occur quickly, but it is unlikely that we will break through it abruptly and sustainably.
Since we are dealing with very weak 1-2 setups and strong wave 3 expansions, the minimum price targets can be disregarded, and the focus can instead be limited to expansion levels such as 261.80% and 361.80%.
Here, we find a strong overlap between the 361.80% Fibonacci level of wave ③ and the 61.80% price target of the green c at $52,345.69. This represents the technical minimum price target that this c wave of the zigzag should reach. The ideal target for wave c is located at the 100% Fibonacci level at $39,436.82.
From a timing perspective, and based on the wave expansions, I do not expect an extended wave c that reaches the ideal or expansion targets. Of course, timing is always difficult to assess. According to the well-known four-year cycle, the bear market bottom should develop sometime toward October.
Based on our Elliott Wave Timing Indicator, the average duration of a move of this wave degree points to around August 4, 2026, with the beginning of the maximum window on October 4, 2026, provided that wave ④ develops into a more complex and more time-extended correction, such as a triangle.
$BTC / #BTC
Shorter Timeframe
Bitcoin has moved very impulsively to the downside over the past few days.
This now raises the key question:
Is this sell-off already marking the start of wave c of (y) of II potentially taking $BTC below $50,000 and toward the 100% Fibonacci extension target at $39,436?
Or is Bitcoin currently forming a larger 1-2 setup before continuing the broader uptrend?
Due to the strong impulsiveness and the depth of the recent decline, we currently consider the bullish 1-2 scenario to be the less likely setup.
Our primary view is that Bitcoin is currently trading in wave ① of (c) to the downside. This move may still have further short-term potential toward the $63,000 region.
The reaction from that area will be crucial.
If Bitcoin then only recovers in a corrective three-wave ABC structure and rejects within the 50% to 78.6% Fibonacci retracement zone between $73,540 and $78,755, the bearish scenario would gain significant confirmation.
In that case, Bitcoin would likely continue lower in wave ③ of (c).
The most important level remains the 88.7% Fibonacci retracement at $62,362.
If this level breaks sustainably, we continue to expect $BTC to move toward the 100% Fibonacci extension target at $39,436.
For the bullish scenario to remain valid, Bitcoin would need to form the low of wave Ⓐ very soon, then recover in a three-wave move into wave Ⓑ, and subsequently hold above $62,362 during wave Ⓒ.
An impulsive reversal from that area would strongly support the view that Bitcoin is already in wave (iii) and that the broader uptrend is continuing.
Until then, $62,362 remains the key make-or-break level.
$NIO / #NIO
Macro Timeframe
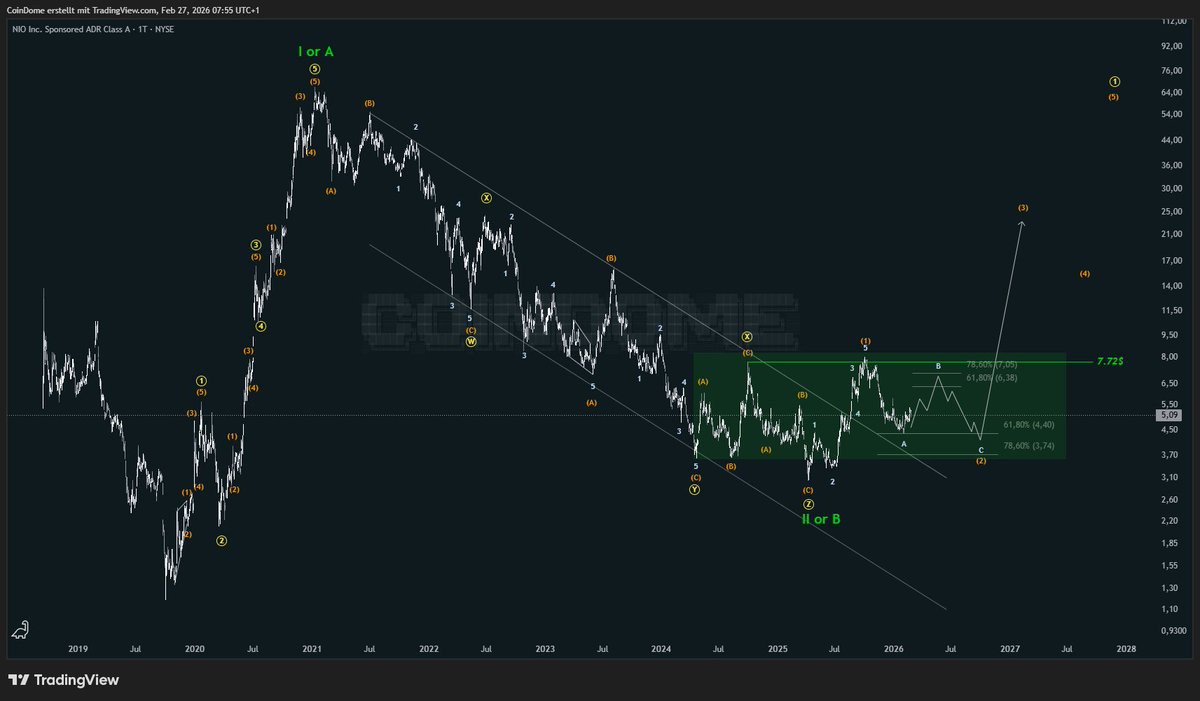
From the perspective of Elliott Wave theory, NIO appears to have completed the Wave II/B correction in the form of a complex WXYXZ structure. In addition, the stock managed to break above the important interim high at USD 7.72, which can be interpreted as a constructive technical signal.
As long as NIO is able to hold the target area for Wave (2), located around the 50% to 78.6% Fibonacci retracement zone between approximately USD 5.55 and USD 4.85, there is a possibility that the low of Wave (2) has already been formed. However, this still needs to be confirmed by further price action.
For now, it remains important to watch whether the stock can continue to turn upward from this area and build further bullish momentum. A sustained move higher would support the view that the correction has ended, while a clear break below the mentioned Fibonacci zone could weaken this scenario.
Over the next couple of days and weeks I am gonna share some of my stock picks for the coming years.
Which analysis do you want to see first.
$FLY
$RKLB
$NIO
$NOW
$NIO / #NIO
Macro Timeframe
From the perspective of Elliott Wave theory, NIO appears to have completed the Wave II/B correction in the form of a complex WXYXZ structure. In addition, the stock managed to break above the important interim high at USD 7.72, which can be interpreted as a constructive technical signal.
As long as NIO is able to hold the target area for Wave (2), located around the 50% to 78.6% Fibonacci retracement zone between approximately USD 5.55 and USD 4.85, there is a possibility that the low of Wave (2) has already been formed. However, this still needs to be confirmed by further price action.
For now, it remains important to watch whether the stock can continue to turn upward from this area and build further bullish momentum. A sustained move higher would support the view that the correction has ended, while a clear break below the mentioned Fibonacci zone could weaken this scenario.
$NIO / #NIO
Macro Timeframe
Yesterday Nio surged 15%, which looks like it is part of wave B. We're expecting Nio to consolidate further in this range between 7.72 USD and 3 USD for quite some time - afterwards, once Nio completes wave (2), the run will be phenomenal!
Comment below which stock or coin I should update next!
$NOW / #ServiceNow
Macro Timeframe
ServiceNow clearly belongs on the list of potential buy candidates from an Elliott Wave perspective.
We assume that the stock completed a clear five-wave structure in cyclical Wave I at around USD 240 at the end of January 2025. Since then, the stock has been undergoing the correction of cyclical Wave II and reached its low so far in April 2026 at around USD 81.
In our view, a transition into Wave III now appears to be emerging, which could open up significant upside potential. The key factor is that the Wave Ⓐ low at USD 136.08 must be sustainably exceeded. If this breakout succeeds, the bottoming process would be confirmed, and from an Elliott Wave perspective the stock would have established the foundation for a dynamic upward move in Wave III.
@EA32376@thinkingcrypto It's not about what can happen but rather what is the most probable scenario. Sure, it can go lower first; that's my alternative scenario on the right.
#Bitcoin / $BTC
Macro Timeframe
Bitcoin (Bull) – Leading Diagonal Scenario:
In the bullish scenario (which remains my primary scenario) we assume that we have completed the orange (1) as a leading diagonal and are now in the process of completing wave (3).
Bitcoin (Bear) – ABC Flat:
The bearish scenario remains valid up to 81k. In this scenario, the entire bear market was not built as a WXY, but as a classic ABC Flat. Here we would now be finished with the (4) of Ⓒ and the final downward movement is imminent.
For this reason, I am also posting this update here, as we are now shortly before the invalidation of the last (currently) serious bearish scenario. The bulls have invalidated all bearish scenarios in recent times (primarily on the smaller timeframe) and have been able to prevail. As long as this does not change and support on the smaller timeframes (e.g. 64932.04 $) breaks, I see no reason to be bearish here, as we are obviously in an uptrend.
#Bitcoin / $BTC
Micro Timeframe
First of all: If this post reaches 50 likes, I will update $ETH, $XRP and more!
We successfully dropped into the 62.5k region, where we had our ideal targets for this wave Ⓨ. There currently is the possibility that we get one more low, as the wave Ⓨ can still develop a larger ABC structure. As I said yesterday, I heavily bought more spot, leaving just a small cash position for this alternative.
The 200W SMA was more or less hit and served as support, while the 1W RSI is oversold, which is also a major bottom signal.
Governments spend billions on this.
We built it for everyone.
Argos Radar gives you the situational awareness that used to require an intelligence budget.
Free. Open Beta. No registration required.
Navigate Conflict. Not Chaos.
https://t.co/DYLSnmYl8W
Today we launch Argos Atlas and Argos Radar!
Governments spend billions on intelligence infrastructure.
We rebuilt it as a free platform for everyone who needs the full picture in a world on fire.
Military-grade tools. No signup. Live.⚡️
Today we launch Argos Atlas and Argos Radar!
Governments spend billions on intelligence infrastructure.
We rebuilt it as a free platform for everyone who needs the full picture in a world on fire.
Military-grade tools. No signup. Live.⚡️
@michaelcjakob Sieht spannend aus, nur paar Sachen sind durch die Website unklar, wie bspw. ob man Anteile besitzt oder eben nicht und wie liquide Bettermarkets ist, wenn man größere Summen handeln möchte.
$NIO / #NIO
Macro Timeframe
Yesterday Nio surged 15%, which looks like it is part of wave B. We're expecting Nio to consolidate further in this range between 7.72 USD and 3 USD for quite some time - afterwards, once Nio completes wave (2), the run will be phenomenal!
Comment below which stock or coin I should update next!