The market is still in a downtrend.
Track every coin that surged in the last 24 hours and the outcome is
the same. Seven days later they are down 11% on average from where
the surge happened.
Coins that gained over 100% in a day fell 25.7% by day seven. The
bigger the move up, the bigger the drop after it.
The 4h RSI data says it from both sides.
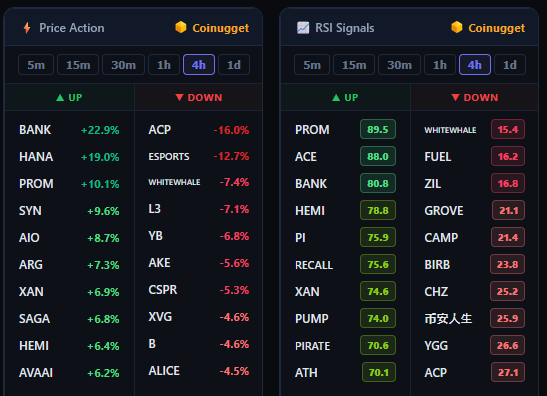
Right panel, overbought. Coins that spiked into overbought flipped
down within the hour, 86.1% of them. Seven days later 73.4% were
still down.
Left panel, oversold. The ones that crashed bounced almost
immediately, 87.2% within the first hour. But by day seven, 71.5%
had ended lower anyway.
Coins that went up end lower. Coins that went down bounce, then end
lower too.
In a market like this, risk management matters more than entries.
bitcoin:native looks positive for now.
The left is the daily chart and the right is the weekly chart, showing the MA20 (yellow) and MA100 (green) lines.
Looking at the daily chart on the left first, it's currently rising while steadily finding support at the MA20 line. At a glance, there's a possibility it's forming a Cup & Handle pattern as it climbs.
If it does rise, resistance is expected around 70k, where the MA100 line sits.
On the weekly chart to the right, the MA20 is also around 70k, making the resistance level similar.
So barring any major negative catalysts, it seems reasonable to look for a move up to 70k.
Coinugget lets you track price movement across every timeframe.
But we don't stop at whether a coin went up or down. We track each coin's surge or crash, and then we follow what happened afterward.
Right now, the data points clearly to a bear market.
Take the 4h RSI. Coins that spiked into overbought saw 86.8% flip straight into decline, and seven days later 75.6% of them were down. Coins that crashed into oversold? About 85.8% bounced sharply within the first hour, but as time passed they kept sliding, and after seven days 73% of that list had ended lower.
The same pattern shows up in price action, not just RSI.
In other words: coins that were rising end up falling, and coins that were falling end up falling too.
Read through the data, and the conclusion is hard to avoid. This is a clear bear market.
Which means chasing surges and riding the trend is the harder game right now. Waiting for a macro candle to close, like the 4h or the daily, and positioning against the move carries the better odds in this market.
Prediction markets just posted their best quarter ever at $113.8 billion in notional volume, while crypto spot volume across the top ten exchanges fell from $2.7 trillion to $1.95 trillion.
The irony is what those markets are pricing.
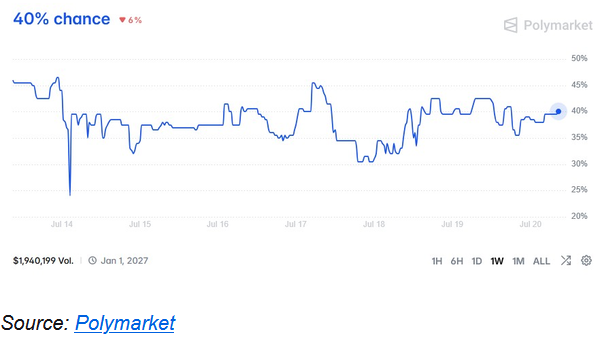
As the Senate moves toward a vote, traders put the odds of the CLARITY Act being signed this year at just 40%, with ethics provisions tied to conflicts of interest, not market structure, the sticking point.
The one corner of crypto that is growing is betting against crypto's biggest regulatory catalyst.
bitcoin:native is up 9.5% in July, its best month of July in four years, and the seasonality table explains why traders are fading it rather than chasing it.
Look at 2022. June closed down 37.29%, July bounced 16.80%, then August erased it with a 13.93% drop and September took another 3.12%. This year June closed down 20.43%, and the July bounce is now tracking the same script. It is not a coincidence of one cycle. Across every year on record, July averages 7.56% while August averages minus 3.64% and September minus 2.97%, making Q3 the weakest stretch on the calendar at roughly 6% even in bull markets.
That is why $70,000 keeps surfacing as a level to sell into rather than break out from, with $67,000 to $73,000 named as a short entry zone.
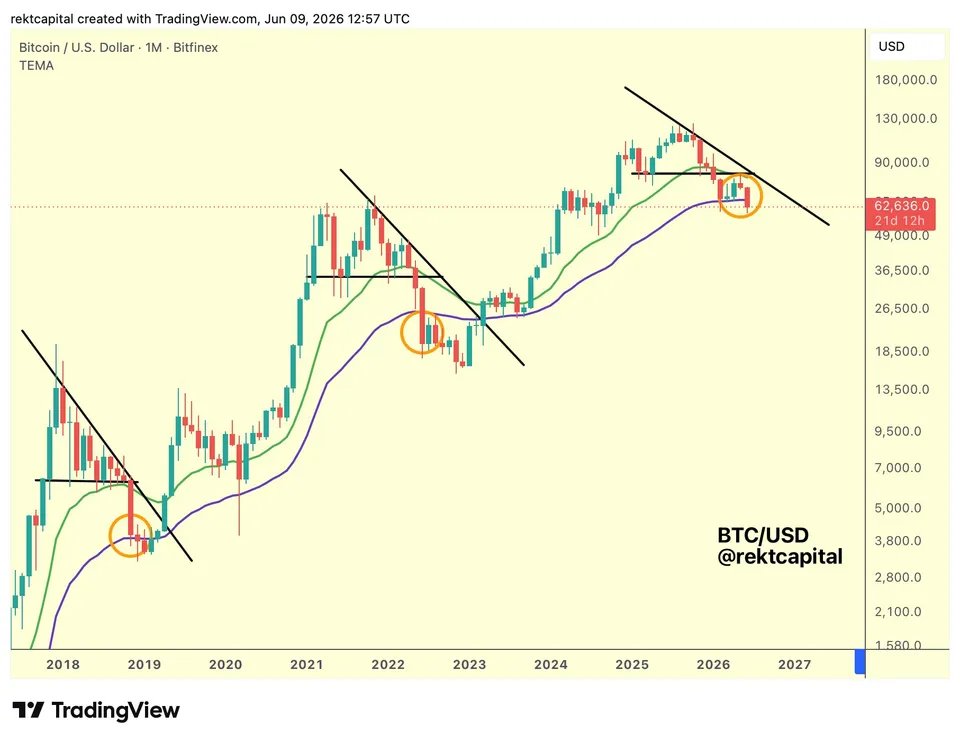
The monthly chart puts BTC where the last two bear cycles bottomed. The bounce is real. The reversal is not.
Chart. Source: Coinugget / Rekt Capital/X
@Cointelegraph Memory chips facing the worst supply shortage ever in 2027 means I will have to pay a premium just to get enough RAM to run my trading bot that loses me money
Digital credit, the preferred shares that Bitcoin treasury firms like MicroStrategy($MSTR) and Strive issue to fund BTC purchases, faced its first real stress test in June, and it held up.
These instruments, MicroStrategy's STRC and Strive's SATA, are built to trade near a $100 par value. That broke on June 18 as leverage built up in STRC triggered margin calls, and the forced selling, compounded by Bitcoin slipping under $60,000, drove both below par to fresh lows.
What followed complicates the bearish read. Rather than fleeing, buyers stepped in at the lows. A survey found 84% of holders sold nothing through the drop, and 52% of respondents added more, though that base skews pro-digital credit. Prices have since clawed back, with STRC near $87 and SATA close to $97, and combined June volume topped $10 billion without any new share sales.
Falling prices alongside record turnover is the tell. Buyers were quietly taking the other side of the panic, not running from it.