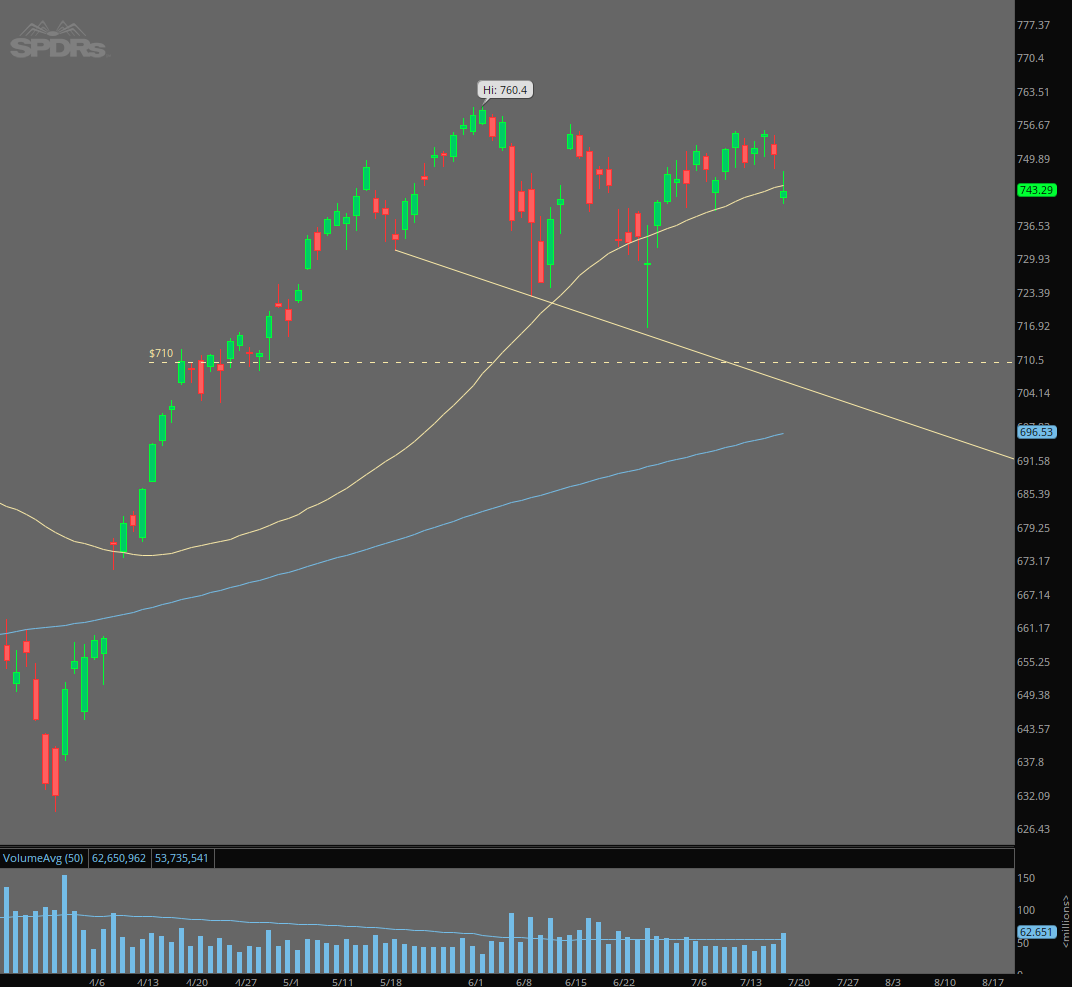
$SPY Daily
The dance between the 50 SMA and resistance zone above can only last so long.
Whatever direction it goes, volume will help tell the real story.
$HIMS Daily/Weekly Chart Analysis- Why I'm bullish
Daily Chart
Price pulled back into three key support levels last week (Prior swing high, 200 SMA, short term trend line)
As of right now this looks like another controlled pullback and potential swing low in the uptrend that started in February.
Heading into a big week next week with the peptide decisions, this is the pullback bulls wanted to see for this potentially move higher after the news.
The odds are the results of this meeting will be bullish for hims. Doesn't mean the stock will react by going up but with the pullback last week it looks good to go higher with last week being a new potential swing low.
Weekly Chart
Uptrend since February is clear here on the higher time frame. The past four weeks price has been consolidating by the 50 SMA. Consolidation is good to see here as demand and supply are balancing in the short term before picking a side.
As a shareholder I believe the fundamentals and earnings results this year will keep the stock in this uptrend. Uncertainty is behind us and quarterly revenue will reaccelerate in Q2. Any peptide approvals is just icing on the cake in my opinion, likely making the 2030 guidance even easier to hit.
Even if we see more downside short term, the uptrend can still hold as long as price doesn't break the trendline.
$ENHA Daily
This could be an interesting one with the peptide meeting later this week.
Base has been forming since IPO in the mid to lower $2's. Held strong last week with an uptick in volume.
$ONDS Weekly
High volume week last week while price didn't range too much. Could be an indication of some buying pressure at these levels.
I still have this in free fall until the lower zone around $5.50. May be right may be wrong.
Regardless this is a good opportunity to dollar cost average in if you're a long term bull. Selling puts isn't a bad idea.
$ORCL Weekly
Price closed in long term demand zone. Volume increasing here as price gets further under its 200 SMA.
Deal keeps getting better for long term bulls.
$HIMS Daily/Weekly Chart Analysis- Why I'm bullish
Daily Chart
Price pulled back into three key support levels last week (Prior swing high, 200 SMA, short term trend line)
As of right now this looks like another controlled pullback and potential swing low in the uptrend that started in February.
Heading into a big week next week with the peptide decisions, this is the pullback bulls wanted to see for this potentially move higher after the news.
The odds are the results of this meeting will be bullish for hims. Doesn't mean the stock will react by going up but with the pullback last week it looks good to go higher with last week being a new potential swing low.
Weekly Chart
Uptrend since February is clear here on the higher time frame. The past four weeks price has been consolidating by the 50 SMA. Consolidation is good to see here as demand and supply are balancing in the short term before picking a side.
As a shareholder I believe the fundamentals and earnings results this year will keep the stock in this uptrend. Uncertainty is behind us and quarterly revenue will reaccelerate in Q2. Any peptide approvals is just icing on the cake in my opinion, likely making the 2030 guidance even easier to hit.
Even if we see more downside short term, the uptrend can still hold as long as price doesn't break the trendline.
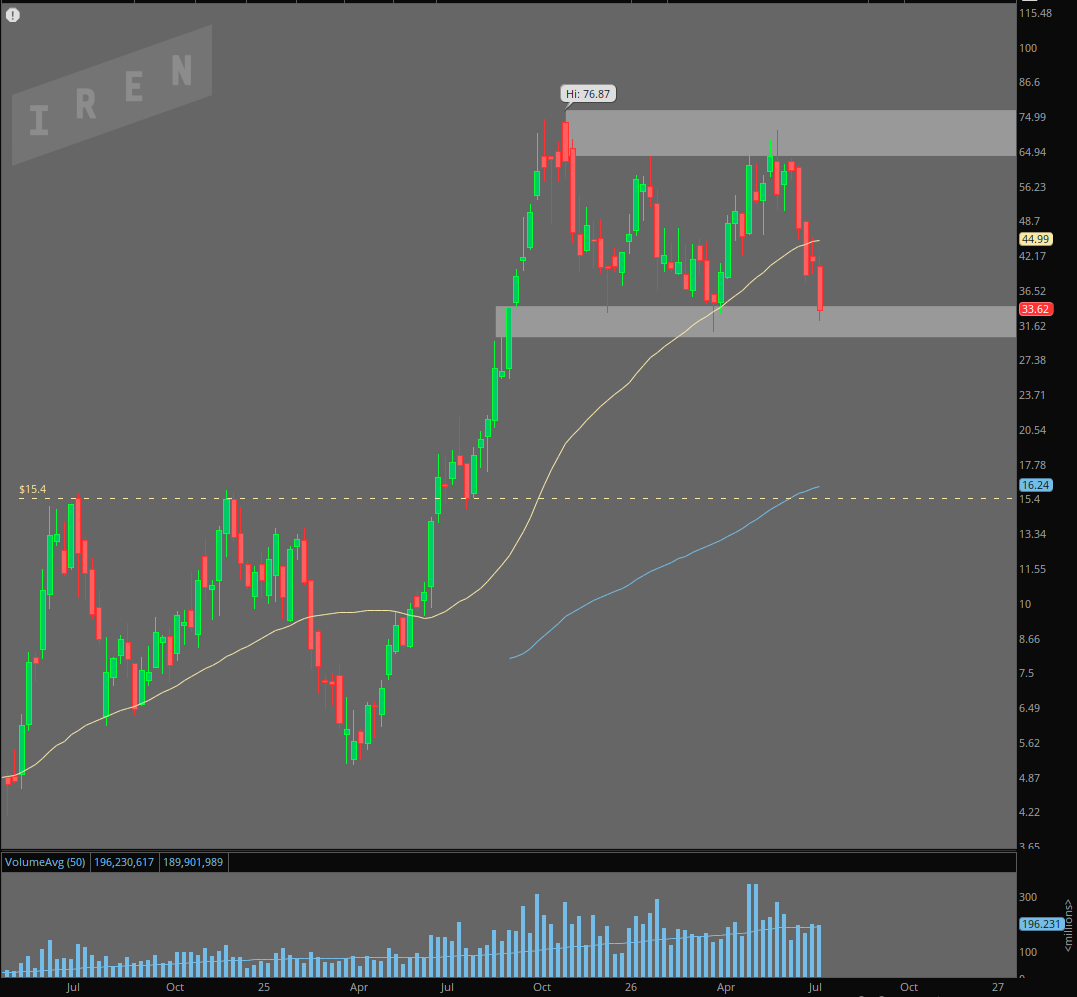
$IREN Weekly Log
Pretty clear range here since fall 2025.
Price with the clean break of the 50 SMA two weeks ago and a retest of it as resistance last week.
Low $30's demand zone looking like a good entry point with a stop below the zone.
The recent selling hasn't been on too much volume which is good for bulls in the long run. Not to say the zone can't break to the downside in the short to medium term.