12 important charts every investor must know:
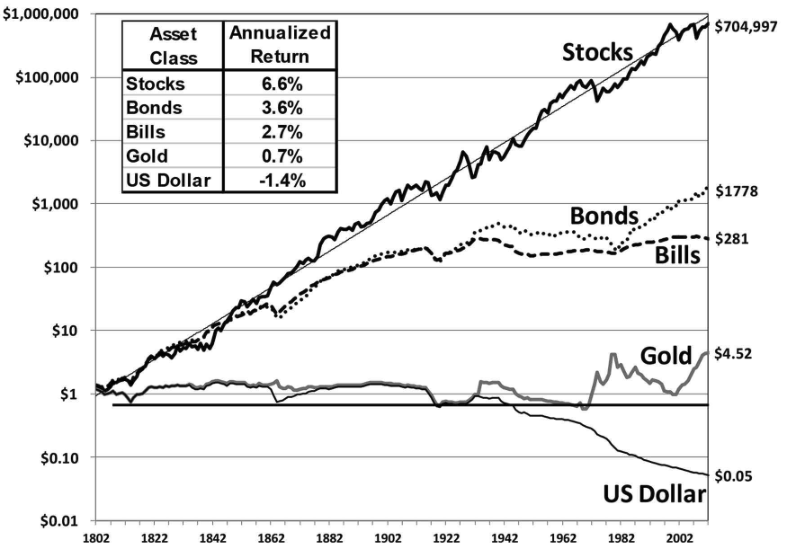
1. Over the past ~200 years, the U.S. dollar has lost 95% of its value whereas stocks are up 70,499,600%.
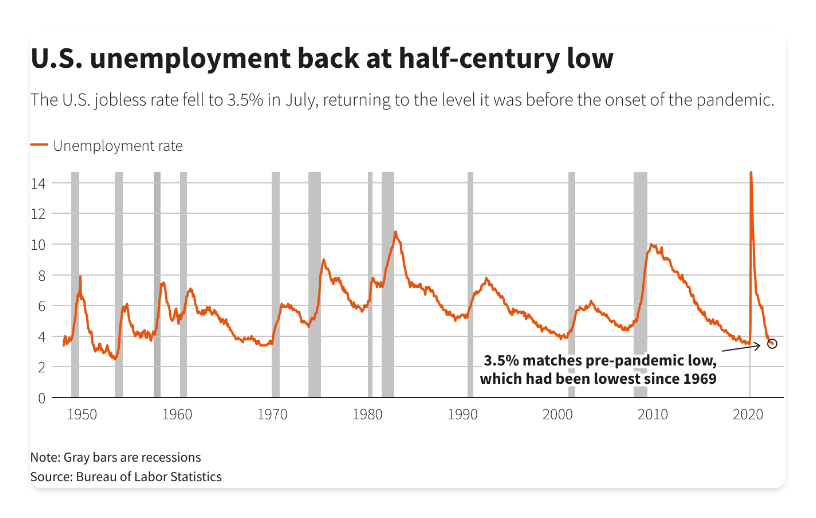
Every single time in the past 50 years, an unemployment rate below 4% was followed by a recession and catastrophic job losses.
Right now, the unemployment rate is at 3.5%.
Here are recession indicators that have been 🚨🚨 for a while now👇
The auto industry collapse has just begun and this would be one of the worst times for you to buy a vehicle.
In a normal market (pre-2020), Auto Loan delinquencies hovered at 2 to 3%.
Today that number is exploding with nearly 1 in every 4 loans in default in Washington DC👇
I am inspired by curiosity.
That is what drives me.
So let us expand the scope & scale of consciousness so that we may aspire to understand the Universe.
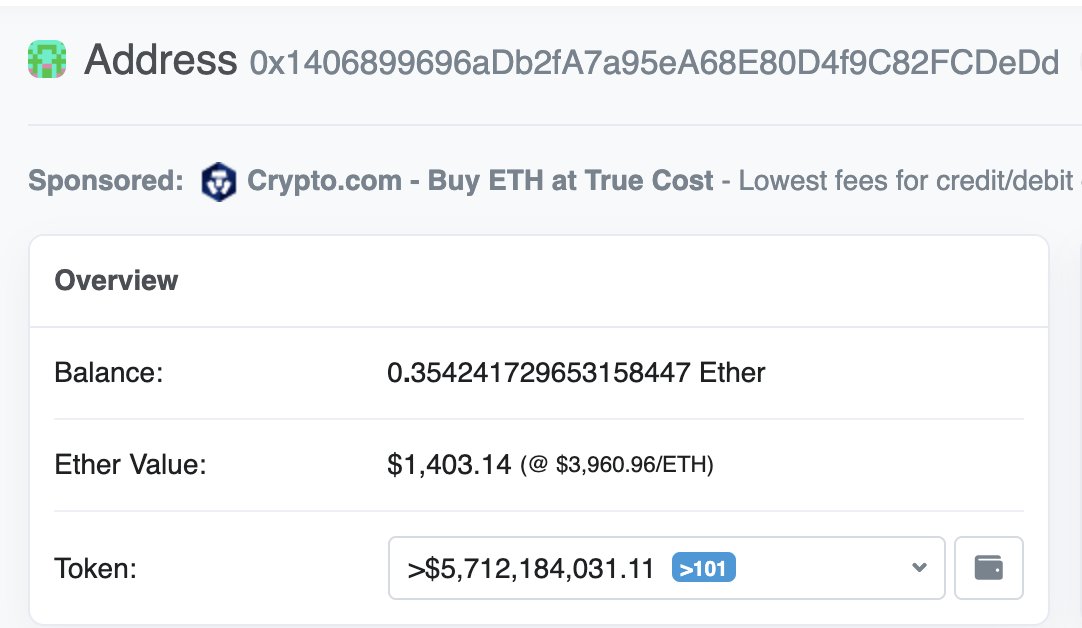
This wallet bought roughly $8,000 of $SHIB last August.
It's now worth $5.7 billion.
From $8,000 to $5.7 billion in roughly 400 days.
We may actually be looking at the greatest individual trade of all time.