We’ve tested every monitoring system under the sun… if you haven’t seen @netdatahq yet, you’re missing out. It’s absolutely incredible. #infrastructure#monitoring
New #Course Alert! We’re excited to share that @JayTheLinuxGuy is launching a brand-new full course on Netdata!
Starting today, April 15th at 12 PM EST, explore our 8-episode series to master Netdata—from installation to alerts, log views and more.
👉 https://t.co/FWWTIYtkWz
Proud to be the founder of Netdata! 🎉
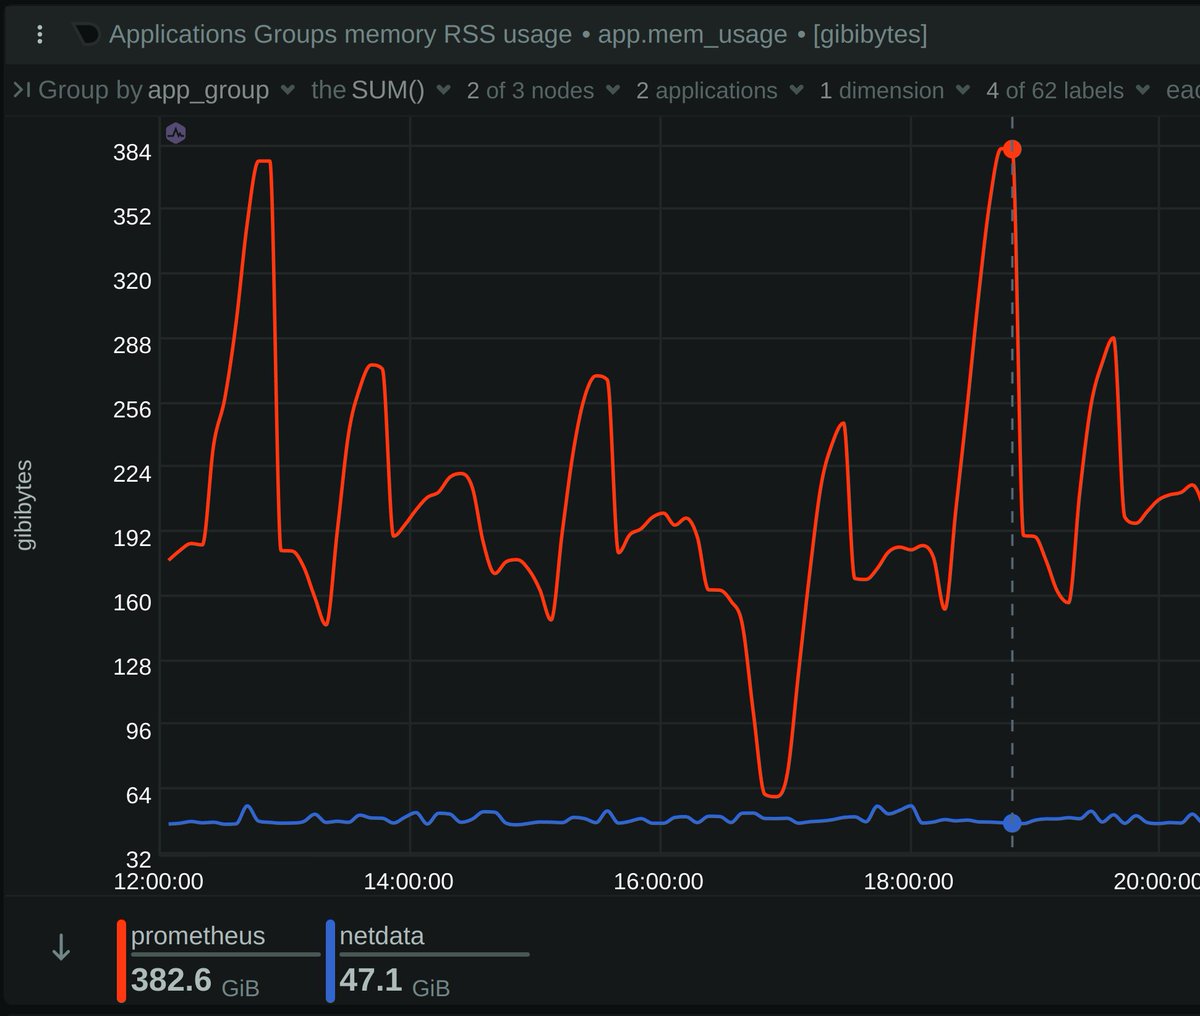
We compared Netdata 2.2 vs. Prometheus 3.1, monitoring 1k nodes & 80k containers, 4.6M metrics/sec.
Netdata: 1/5th the memory, 1/10th the I/O, 35% less CPU, and gives 40x more retention!
Couldn't be prouder of the team! 🚀
"🎉 Ep 50 of *More Than a Refresh*! @chronicallyJD chats w/@CostaTsaousis, CEO of @netdatahq, on GitHub virality, ML for insights, & why loving trouble is good!
Listen: https://t.co/jvBrsDTQc9
Check out Costa's session @OSODaycom on 10/24 https://t.co/MbIKiBUxVF
#OpenSource
Join us to our next User #Panel Discussion!
Live #UseCase Discussions: Discover how #Netdata is being utilized in various environments, straight from our #users.
Event Details:
🗓 May 23rd, 2024
⏲ 16:30 UTC
📍 Online
⏳ 45'
RSVP: https://t.co/wDhCF02wrU
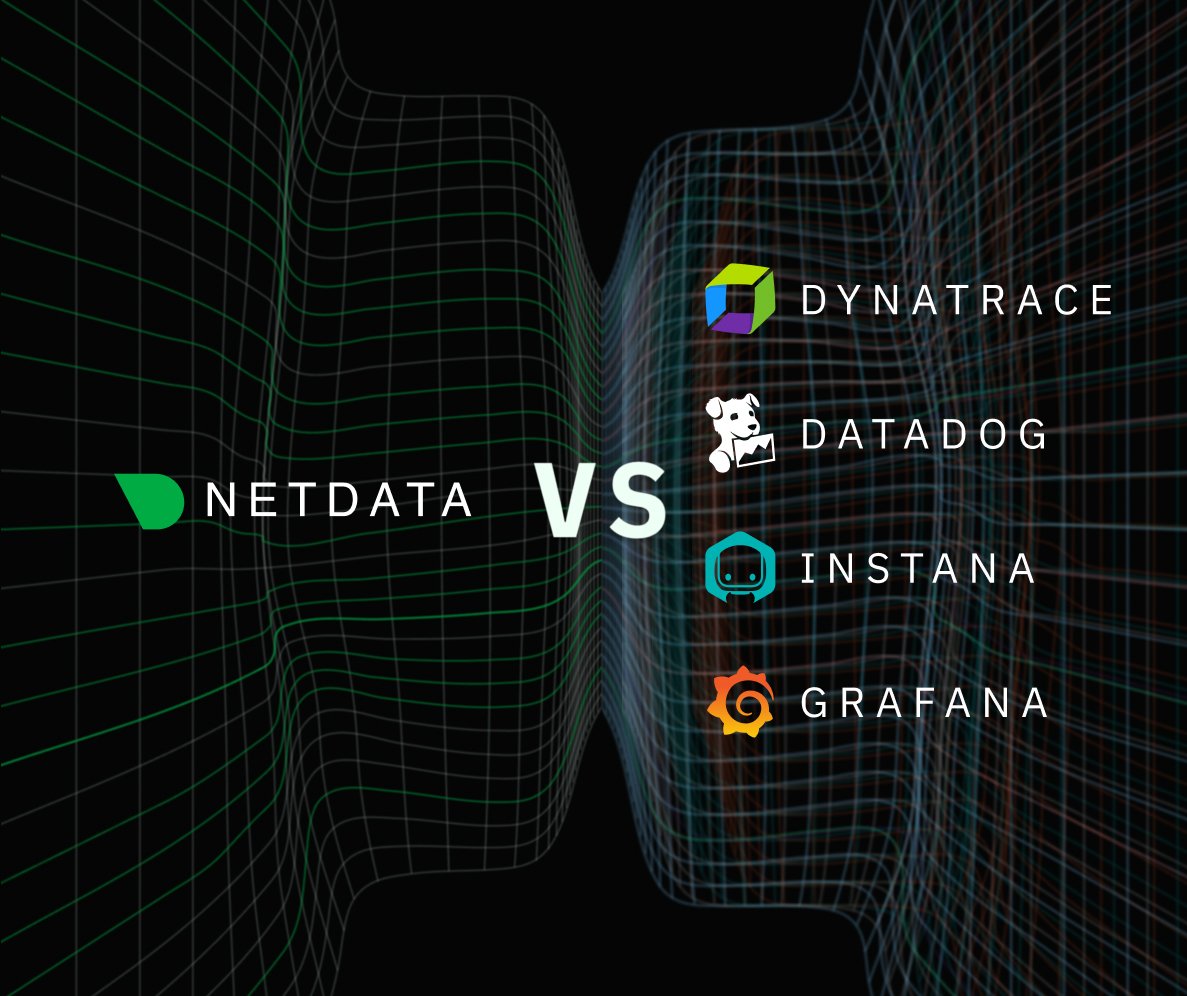
@zeeg@syntaxfm If you don't need traces, have a look at @netdatahq . Per second resolution, real-time, fully automated, almost all features of Datadog at a fraction of the price.
Optimizing The #FinTech Industry 😍
“It’s the bedrock of our #infrastructure#monitoring, providing insights we didn’t even know we needed"
🙏 Timothy Short, #DevOps specialist, Yellow Brick Road
Read the full case study 👉 https://t.co/QXkQMLha8C
When #systemd-journal is coupled with #Netdata’s systemd-journal explorer, you get a real-time, live-explorer for your #logs, similar to what you can find in #Grafana for #Loki and #Kibana for #Elasticsearch.
Read more: https://t.co/rnFm2X02P8
Dive into Synthetic #Monitoring!
It involves simulating user interactions or #API calls to test various aspects of a #system, such as availability, functionality & #performance!
Discover what each commercial tool covers
📖 https://t.co/RabyhLaUV8
Decentralized #Monitoring Explained.
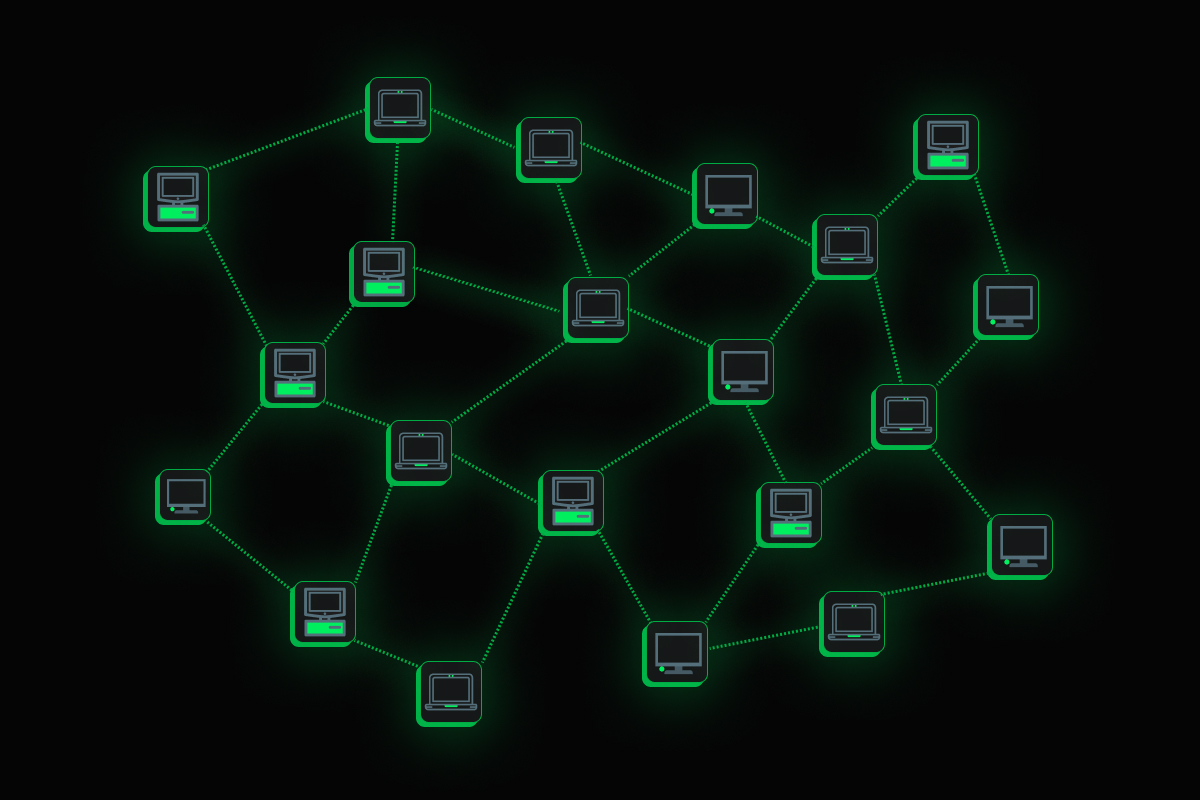
The concepts of #decentralized and #distributed monitoring can be perplexing, as many #systems claim distributed capabilities, making it hard to see what sets #Netdata apart.
👉 https://t.co/tsrcfvtM7y
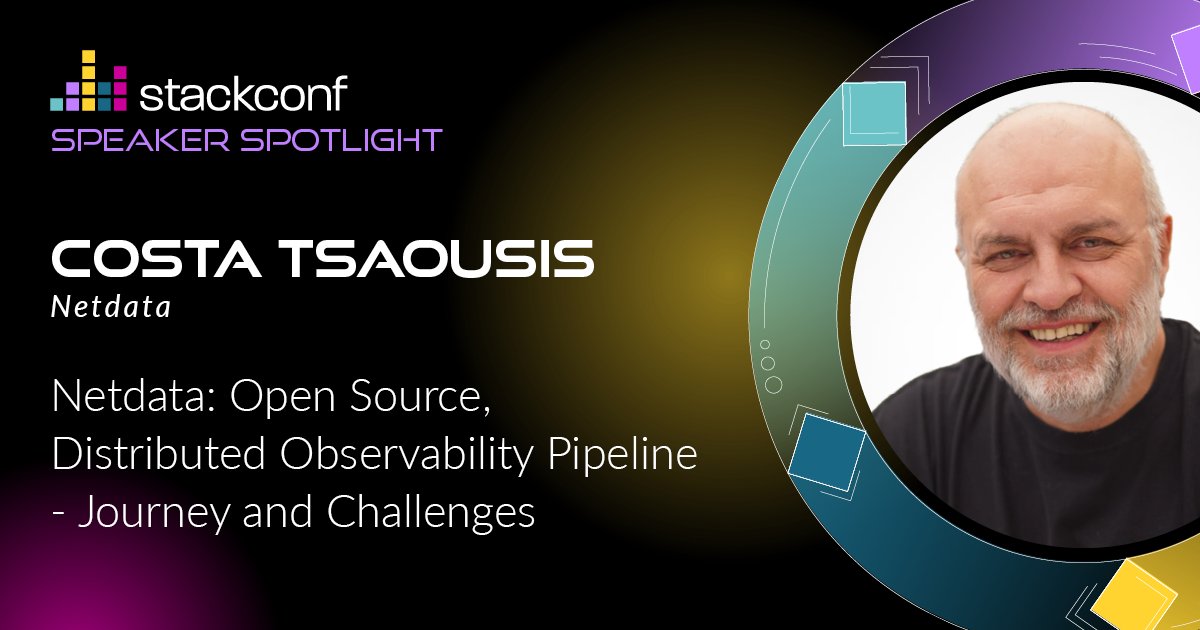
Dive into the future of #monitoring with @CostaTsaousis at #OSday24!
"#Netdata: Open Source, Distributed #Observability Pipeline" uncovers the evolution of Netdata.
From its ambitious beginnings to pioneering in observability!
https://t.co/YKNGGT8RSs
Ever wished you could see your system's health in REAL-TIME?
With #Netdata, you're not just monitoring; you're getting a live, beat-by-beat pulse of your #infrastructure. The only tool that lets you see now, not later. 🚀💥
#RealTime#Monitoring
"Driven by the question of how an ideal #monitoring solution could operate – one that could detect everything in real-time, handle unlimited metrics – I began experimenting." - @CostaTsaousis on @safetydet
Read the full interview 👇
https://t.co/lLtCqlEBWu
Thrilled to announce the launch of #Netdata v1.45.0!
This latest #release marks another milestone in our journey towards simplifying #monitoring for everyone!
Check it out 👇
🎉Netdata v1.45.0 has been officially released!
Check here for the full version of the #release notes 👉 https://t.co/qdDX6AxLUw
And our video to learn more 👉 https://t.co/XgckN2OTDF
#netdata#monitoring#devops#opensource#grafana#network
https://t.co/onIbJUlMaM
Our team has been hard at work to bring you enhancements such as a #MobileApp, Custom Dashboards, and a #Network Viewer, among others.
These developments are designed to improve your #monitoring.
Join us to explore these new features!
RSVP: https://t.co/6m7Blh1O3t
@CostaTsaousis, Founder & CEO; and the #Netdata Product team, on the 25th of March at 17:00 UTC for the Netdata #Release Meetup.
We’ll cover:
⭐Release Highlights ⭐
📱Netdata Mobile App
🖥️ Custom #Dashboards
🛜Network Viewer
And so much more!
RSVP: https://t.co/Xg1djEPzZ9