Are you treating Gold like a casino game and getting chopped up by random market noise? 📈 👇
Most retail traders chase the immediate candle, trade blindly on a news flash, and get stopped out instantly. The professionals don't guess. They use structural rules.
THE GOLD PRICE ACTION BLUEPRINT
Here is how you structure your edge:
✅Spot the Trend: Use Weekly charts for primary direction and Daily charts for market structure.
✅Map the Levels: Draw your structural "Floor" and "Ceiling" where price historically reacted.
✅Refine the Entry: Zoom into 4H or 1H charts. Wait for a clear Engulfing candlestick confirmation.
✅Lock the Risk: Place stop-losses outside the technical structure. Set targets at the next liquidity zone.
✅Manage the News: Treat fundamental data as a volatility trigger to accelerate setups, not as the strategy itself.
❌Stop chasing the sprint. Let structural discipline do the heavy lifting.
Want the full step-by-step framework?
Read the complete guide here: https://t.co/dnR4EmEl9q
❗Risk Warning: Trading foreign exchange and derivatives carries a high level of risk and may not be suitable for all investors. Leverage can work against you. Before trading, ensure you fully understand the risks, taking into account your objectives and experience. Analysis is for informational purposes only and does not constitute financial advice.
Are you obsessing over predicting the market, or are you actually managing your survival? 🤔 👇
Most beginners look at the charts and focus entirely on being right. When a losing streak hits, they panic, risk too much, and wipe out their accounts. The professionals know that losing is inevitable—they just focus on staying in the game.
THE MATHEMATICAL TRAP OF THE DRAWDOWN
Let's look at the brutal math of risk management. If you start with a $1,000 trading account and hit a 5-trade losing streak, your survival depends entirely on a single rule:
❌The 20% Risk Disastrous Strategy: If you risk 20% per trade, a 5-trade losing streak collapses your balance down to just $327. That is a -67.2% loss. To break even from there, you now need a near-impossible +205.8% return.
✅The 1% Risk Rule: If you set a strict 1% automatic exit limit, you only lose $10 on each bad trade. After those same 5 losses, you still have $950 remaining. You only need a tiny +5.3% recovery return to fully get back to break-even.
Stop overcomplicating your entries while ignoring your exits. A strict risk management rule completely prevents a fatal mathematical drawdown, keeping your account fully funded to trade another day.
Ready to build a sustainable trading strategy?
Learn the fundamental pillars of risk management and get your free guide here: https://t.co/tppweoErCX
Risk Warning: Trading foreign exchange and derivatives carries a high level of risk and may not be suitable for all investors. The high degree of leverage can work against you as well as for you. Before deciding to trade, ensure you fully understand the risks involved, taking into account your investment objectives and level of experience. Analysis is for informational purposes only and does not constitute financial advice.
Are you overestimating a relief bounce, or are you waiting for the real structural trap to snap shut? 🤔 👇
Most retail traders see a green candle after a big drop and immediately think the trend is reversing. They buy too early and get trapped by the dominant sellers. The professionals don't guess the bottom. They look for the resistance ceiling to hold.
THE DOUBLE TOP ALERT BLUEPRINT
We are watching a clear breakdown alignment on EUR/CHF across both the weekly and daily timeframes. The market structure is heavily favoring a bearish continuation. Here is how we are planning our execution:
✅The Macro Picture: The weekly chart has printed a textbook Double Top pattern. Price action is holding below the 50 EMA, which is now acting as solid secondary resistance.
✅The Daily Shift: The daily consolidation floor has officially broken. That old support is now transforming into a potential new resistance zone for a retest.
✅The High-Probability Target: We are mapping out a slide toward the 0.91600 target zone.
✅The Execution Trigger: Do not short blindly. Wait for a pull-back and look for a clear bearish candlestick confirmation at the 0.91930 – 0.92105 resistance zone.
✅The Invalidation Point: A clean break and retest above the weekly resistance at 0.92260 – 0.92600 invalidates this bias, exposing a lower-probability move toward 0.93000.
❌Stop reacting to every minor bounce. Let the market hit your structural levels first.
Want the complete multi-timeframe analysis?
Read our full technical breakdown and market forecast here: https://t.co/UcmV6QwvkU
Risk Warning: Trading foreign exchange and derivatives carries a high level of risk and may not be suitable for all investors.
Are you stepping in front of a runaway freight train, or trying to short a record-breaking market? 📈 👇
Most retail traders look at an all-time high and think "it's gone up too far, it has to crash." They fight the trend and get wiped out. The professionals don't guess where the ceiling is. They ride the structural momentum.
THE MOMENTUM BREAKOUT BLUEPRINT
The DAX (GER30) is printing historic moves. The macro narrative is shifting, and the technical indicators are lining up for a continuation. Here is how we are structuring this setup:
☑️The Macro Shift: The ECB is pivoting away from bond-buying. They are moving to a data-driven policy using interest rates as their primary tool.
☑️The Breakout Trigger: Watch the 25680 critical resistance level. A clean breach of this level signals a continuation of the current record-breaking uptrend.
☑️The Support Floors: If we see a pull-back, the psychological support sits at 25438. The major structural floors are holding firm down at 25058 and 24872.
☑️The Momentum Indicators: The MACD is flashing a clear positive crossover. Meanwhile, the RSI is sitting at 64.97, meaning there is still plenty of room to run before the market becomes overbought.
Stop trying to predict the top. Let the market show you its strength and trade the trend.
Ready to capture the full trend?
Get our complete session breakdown and deep dive into the macro drivers here: https://t.co/53GM5hiocT
Risk Warning: Trading foreign exchange and derivatives carries a high level of risk and may not be suitable for all investors
Are you chasing breakouts only to get trapped on the wrong side of the market?
Most retail traders see a sudden drop, panic, and click sell at the absolute bottom. The professionals wait for the market to give away its hand.
THE "BREAK & RETEST" BLUEPRINT
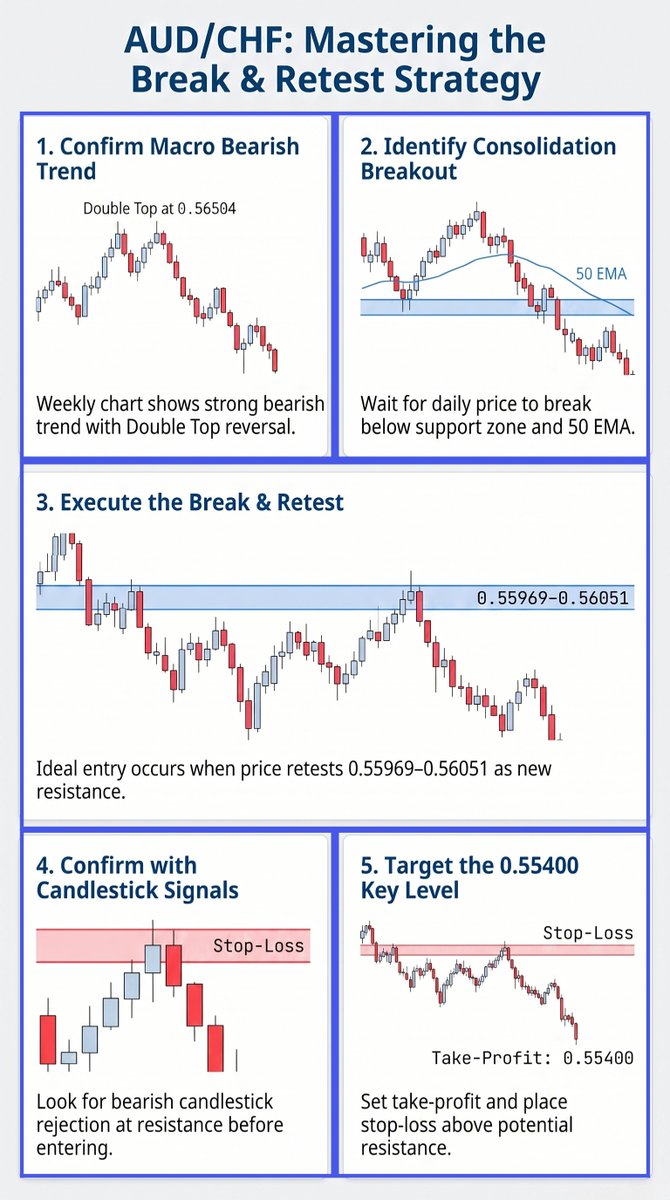
We are tracking a clean textbook setup on AUD/CHF. Stop guessing on momentum and start looking for structural validation. Here is the step-by-step execution:
✅The Macro Trend: The weekly chart confirms a heavy bearish trend following a Double Top reversal at 0.56504.
✅The Breakout: Daily price action has officially cleared the consolidation support floor and the 50 EMA.
✅The Trap Zone: Do not chase the move. Wait for a pull-back to retest 0.55969–0.56051 as the new resistance ceiling.
✅The Trigger: Look for a clear bearish candlestick rejection at this zone before executing your entry.
✅The Objective: Set your take-profit target at the 0.55400 key liquidity level, with a defined stop-loss safely above the resistance ceiling.
❌Stop trading on emotion. Let the structure do the heavy lifting.
Want to master this strategy on a live feed?
Read our full technical breakdown here: https://t.co/KIk6EaAKSm
Oil is flashing a massive warning sign. The geopolitical premium is gone. 🧠🥶
Fear held the energy market up. Now, the Strait of Hormuz is clearing. The US Dollar is surging on strong NFP data. WTI crude is getting squeezed from both sides.
How do you trade a market that just lost its biggest catalyst?
You track the technical pivots. Here is the exact WTI blueprint to watch this week:
• 🔄 TRANSIT NORMALIZATION: Erase the war premium from your bias. Supply entry passages are open.
• 📊 BEARISH MOMENTUM: Track the heavy downside expansion. RSI is oversold at 27.89.
• 🛑 STRUCTURAL PIVOTS: Lock your focus on the 69.913 critical pivot level. The next major floor is 65.99.
• 🎯 MACRO CONFLUENCE: Factor in the strong US Dollar. It creates a heavy, undeniable headwind for WTI.
Execute your fundamental market strategies with absolute precision. Open an ACY Securities Live Account today. Trade global oil, forex, and indices on MT4, MT5, or the ACY app.
👉 Claim your performance edge here: https://t.co/XRJE42mVG4
Build technical consistency without sacrificing your risk rules. Access our complete step-by-step market breakdowns for free on our website right now.
👉 Claim the free guide here: https://t.co/6Sy1Wcd2q4
---
Risk Warning: Trading involves significant risk of capital loss. Past performance does not guarantee future results. Ensure you thoroughly understand macro structural shifts before trading.
Here are 10 free MT5 scripts and indicators to stop manual errors from destroying your execution. 🧠🥶
Most retail traders leave 80% of their capital on the table because their platform configuration is stuck in the past. They face severe workflow friction, experience constant human calculation slip-ups under pressure, and let execution anxiety freeze their layout because they manually calculate risk sizes instead of automating their dashboard controls.
Platform optimization is the ultimate discipline filter. To win, stop overcomplicating your execution and turn your interface into a sleek machine.
• 🔄 RISK AUTOMATION: Use a Position Size Calculator to map exact lots by dragging a stop-loss line, pulling manual math entirely out of your routine.
• 📈 PANEL MODIFICATION: Speed up your trade workflow using one-click buttons built for instant breakeven rules, partial closes, and rapid exposure flatlining.
• 🛑 STRUCTURE VISUALS: Map structural session boxes to see London and New York overlaps, and apply Volume Profiles to target high-volume price levels.
• 🎯 METRIC TRANSFORMATION: Replace random pip stops with dynamic ATR volatility boundaries to give technical entries professional breathing room.
Execute your trading plans with clinical, institutional precision. Open an ACY Securities Live Account today to connect your custom indicators directly to rapid order processing on MT4, MT5, or the ACY app.
👉 Claim your performance edge here: https://t.co/XRJE42mVG4
---
Risk Warning: Trading financial derivatives involves high risk to capital. Past performance does not guarantee future results. Ensure you fully comprehend software parameters and risk management targets before trading.
They don't want you to know this: most retail day traders are mathematically engineered to fail before they even place a trade. 🧠🥶
Most retail traders leave 80% of their capital on the table because they treat the charts like an unregulated casino game. They let greed dictate their position sizes, ignore daily drawdown parameters, and drive their portfolio off a cliff because they never learned how to apply proper account brakes.
Read the full article here: https://t.co/XbfDVe6J87
Market edge means nothing without repeatable defensive protocols. To win, you must stop focusing on winning percentages and start automating your risk parameters.
• 🔄 PERCENTAGE PROTOCOL: Measure risk strictly as a fixed asset percentage rather than a dollar value to stabilize your technical equity curve.
• 📈 PROFILE PROFILE: Shift gears intentionally between a 0.5%–1% learning profile and a 1%–2% standard professional profile to stay in total control.
• 🛑 LOSS MITIGATION: Stop hunting immediate cash profits like an amateur; focus your routine entirely on reducing unnecessary stop-outs.
• 🎯 THE 1% EXECUTION RULE: Commit to a strict 1% risk-per-trade constraint to erase emotional revenge trading and survive sudden multi-asset volatility.
Execute your defensive risk plan with absolute institutional precision. Open an ACY Securities Live Account today to trade global forex, commodities, and stock indices with rapid order processing on MT4, MT5, or the ACY app.
👉 Claim your performance edge here: https://t.co/XRJE42mVG4
---
Risk Warning: Trading financial derivatives involves significant risk of capital loss. Past performance does not guarantee future results. Ensure you thoroughly understand risk profiles and structural capital preservation targets before deploying funds.
Reading market direction is easier than you think when you trade facts over emotions. 🧠🥶
Most retail traders leave 80% of their capital on the table because they trade blind breakout traps inside empty price zones. They ignore historical floor and ceiling levels, forcing chaotic entries right into hidden institutional order blocks designed to clear out retail positions.
Consistency doesn't require complex software. To win, stop guessing trends and start tracking verified price rejection.
• 🔄 FLOOR & CEILING RULES: Define clean Support levels where prices bounce and clear Resistance zones where prices fall.
• 📈 DEMAND VALIDATION: Isolate support entry points strictly where selling momentum weakens and buyers push price upward.
• 📉 SUPPLY VALIDATION: Target short positions exclusively where buying interest fades and sellers defend the zone.
• 🛑 REJECTION CONFIRMATION: Wait for explicit candlestick rejection patterns to print at your marked boundaries before triggering risk.
• 🎯 TREND CONFLUENCE: Multiply your win rate by filtering support and resistance trades through the 50 EMA and overall market structure.
Protect your capital while building mathematical consistency on your charts. Access our full step-by-step Technical Analysis Masterclass and price action cheat sheets for free on our website.
👉 Claim the free guide here: https://t.co/1D1Uyznoa8
---
Risk Warning: Trading financial derivatives involves significant risk of capital loss. Past performance does not guarantee future results. Ensure you thoroughly understand market structure and risk management rules before trading.
This might save you years of confusion: stop treating the stock market like a single, uniform wave. 🧠🥶
Most retail traders leave 80% of their capital on the table because they trade micro chart patterns completely isolated from macro reality. They buy random stock breakouts, entirely blind to the fact that institutional algorithms automatically reallocate billions of dollars across industries based on inflation metrics and central bank policy decisions.
The market moves in a highly repeatable, structured loop. To win, stop guessing breakouts and start tracking institutional rotation rules.
• 🔄 RECOVERY MOVERS: Isolate interest-sensitive sectors like financials, utilities, and homebuilders to spot the initial spark as interest rates drop.
• 📈 GROWTH EXPANSION: Target consumer discretionary and retail equities early to capture accelerating household spending surges.
• 🛑 MID-CYCLE PEAKS: Shift your technical trend focus toward manufacturing and industrial groups when product inventories begin depleting.
• 🎯 DEFENSIVE LAGGARDS: Track late-cycle indicators like healthcare and mining, which consistently peak right before a broad market downturn.
Access our complete step-by-step Sector Rotation Masterclass and technical guide for free on our website right now.
Read the free guide here: https://t.co/U6byWMACUm
---
Risk Warning: Trading financial derivatives involves significant risk of capital loss. Past performance does not guarantee future results. Ensure you thoroughly understand macroeconomic cycle parameters and structural risk management before trading.
Read this before you trade Gold: stop chasing raw intraday breakouts. 🧬🥶
Most retail traders leave 80% of their capital on the table because they trade spot gold (XAU/USD) with pure emotional panic. They watch a fast-moving green or red candle burst out of a range, hit buy or sell out of intense FOMO, and get instantly liquidated by an institutional sweep designed specifically to hunt their retail stop-losses.
To secure a repeatable trading strategy, stop acting on instinct and start executing strictly on confirmed displacement.
• 🔄 BIAS SETUP: Mark untapped Previous Day Highs/Lows, focusing your strategy exclusively inside the London and New York session Kill Zones.
• 🛑 THE LIQUIDITY TRIGGER: Wait for price action to execute a mechanical sweep of those exact structural boundaries to flush out retail order books first.
• 🏛️ THE FOOTPRINT REVERSAL: Confirm institutional intent via sharp displacement that prints a clear, unmitigated Fair Value Gap (FVG).
• 🎯 TECHNICAL EXECUTION: Set your execution entry at the 50% equilibrium point of the FVG, hide your stop behind the sweep wick, and target the opposing low.
Execute your technical gold setups with clinical, institutional precision. Open an ACY Securities Live Account today to trade global commodities and forex on MT4, MT5, or the ACY app with competitive pricing.
👉 Claim your performance edge here: https://t.co/XRJE42mVG4
---
Risk Warning: Financial market trading involves significant risk of capital loss. Past performance does not guarantee future results. Ensure you understand structural price imbalances and risk targets before deploying funds.
If you're buying standard chart breakouts, you should look for the institutional trap instead... 📉🔍
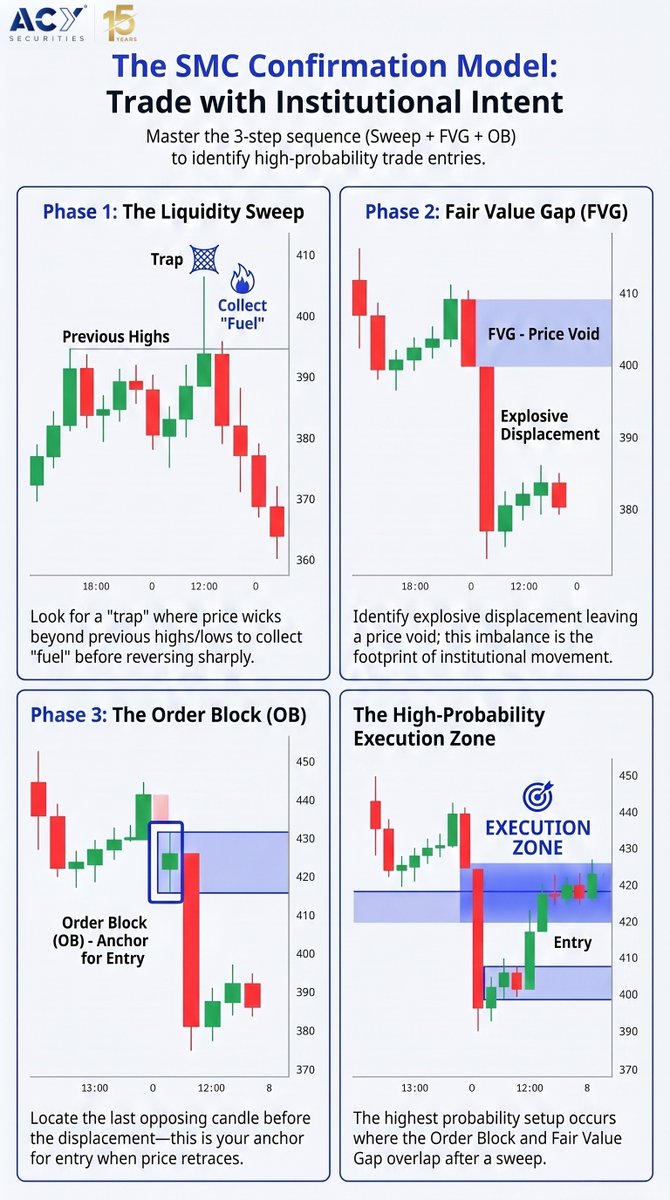
Most retail day traders aggressively buy or sell structural breakouts the moment a major asset prints a new high or low. They don't realize they are running directly into institutional liquidity pools. Large banks and automated algorithms intentionally engineer breakout traps to harvest your stop-losses, collecting raw fuel before sharply reversing the price action against you.
If you want to survive volatile multi-asset financial markets, you must learn to trade with institutional intent.
• 🪤 PHASE 1: Identify the trap zone where a candle wick surges beyond previous highs or lows to sweep order books and gather market fuel before a sharp reversal.
• ⚡ PHASE 2: Track explosive displacement candles that leave behind a structural imbalance or price void. This market structure footprint proves algorithmic capital has entered.
• ⚓ PHASE 3: Locate the last opposing candle built directly before that aggressive displacement move occurred. This is your mechanical anchor level for trade execution.
• 🎯 THE HIGH-PROBABILITY EXECUTION ZONE: Wait patiently for a clean structural retrace. Your highest probability setups happen exclusively when the retest of the Order Block overlaps the Fair Value Gap zone after a verified sweep.
When trading sensitive setups like FVGs, execution speed and infrastructure matter. Experience tier-one infrastructure, rapid order processing, and tight spreads.
👉 Explore trading tools and accounts with ACY Securities here:
---
Risk Warning: Financial market derivatives trading carries a high level of risk to your capital and is not suitable for all investors. Ensure you fully comprehend smart money concepts and structural technical analysis before deploying live funds.
MARKET ANALYSIS ALERT: Institutional gold sellers are aggressively defending a major structural line in the sand... 📉🔍
Most retail day traders are blindly buying gold (XAU/USD) momentum, completely unaware that they are running straight into a massive overhead supply zone. They see a fast-moving green candle and chase the breakout out of pure FOMO, right as algorithmic order blocks prepare to clear out retail stop-losses. If you do not map historical resistance levels and technical chart patterns, you are simply funding the next market drop.
• 🌍 A massive Head & Shoulders pattern is printing, backed by weekly and daily rejections at the 50 EMA and structural neckline to confirm bearish dominance.
• 🎯Sellers are heavily protecting the primary $4,377 resistance zone. Watch closely for price action rejections at the lower $4,323 line.
• ⚖️The high-probability bearish trend aligns perfectly with structural supply, while pushing a bullish move up to $4,500.00 remains a low-probability, counter-trend risk.
• 🪤Do not short prematurely. Anticipate a classic break and retest scenario inside the $4,323–$4,377 zone.
• ⚡ Wait for a formal pullback, look for concrete candlestick confirmation of seller defense, and enter short cleanly.
Stop letting execution slippage and wide retail spreads destroy your technical trade entries at critical resistance levels. Open a Live Trading Account with ACY Securities today to execute high-volume gold orders cleanly with ultra-tight spreads and rapid order processing.
👉 Launch your Live Account here: https://t.co/XRJE42mVG4
---
Risk Warning: Gold and derivatives trading carry a high level of capital risk and may not be suitable for all investors. Ensure you fully understand technical price action and risk parameters before deploying live funds.
We just found this out: memorizing chart patterns is actively wasting your mental capital. 🧬🥶
Most retail traders leave 80% of their capital on the table because they try to navigate volatile financial markets while suffering from complete emotional chaos. They let greed command their execution, chase low-quality entries out of pure boredom, and drain their limited willpower fuel tank before the real volume session even opens.
Consistency is built by following strict execution processes, never by chasing individual trade outcomes.
• 🔄 THE 90/10 RULE: Anchor your mind to the reality that trading is 90% psychology (discipline and emotion) and only 10% technical chart patterns.
• 🛑 RISK COUPLING: Detach your mind from money by thinking strictly in risk percentages instead of cash values on every position.
• 🏛️ REPS FILTER: Protect your mental capital; wait exclusively for a few high-quality setups instead of bleeding equity across average trades.
• 🎯 SYSTEM GPS: Treat your strategy as your driving navigation—never alter your stop-losses or profit targets because of short-term anxiety.
Execute your trading parameters with clinical, institutional precision. Open an ACY Securities Live Account today to trade global markets on MT4, MT5, or the ACY app with competitive pricing.
👉 Claim your performance edge here: https://t.co/XRJE42mVG4
---
Risk Warning: Trading involves significant risk of capital loss. Past performance does not guarantee future results. Ensure you understand structural and psychological execution risks before trading.
We just engineered an Engulfing Signal Cheat Sheet to fix your reversal timing for good... 🧠🛡️
Most retail day traders lose because they use technical indicators and candle shapes as blind buy or sell buttons. They spot a single green candle, assume a bottom is in, and throw random capital at the screen out of pure emotional speculation. They fail to realize that the engulfing candle is merely the tactical trigger—but macro technical context is your actual edge. If you execute trade setups without combining structure, you are trading against institutional volume.
To protect your account capital, stop hunting reversals in a vacuum. Learn to trade momentum shifts with explicit confluence.
• 📈 MOMENTUM POWER-SHIFT: Isolate the clean two-candle pattern where the second real body completely covers the first, signaling aggressive trend reversal.
• 🐂 BUYER DOMINANCE: For a bullish pattern, look for a larger green candle to completely engulf a red candle body to confirm buying pressure.
• 🐻 SELLER CONTROL: For a bearish pattern, verify that a large red candle body completely swallows the green candle to prove structural distribution.
• 🛑 NEVER TRADE IN ISOLATION: A clean pattern on its own is low probability; you must filter it through surrounding historical market context.
• 🎯 THE CONFLUENCE PROTOCOL: Dramatically increase trade probability by aligning your entry trigger with Key Support/Resistance, the 50 EMA dynamic line, or overall Market Structure.
Stop letting execution delay or wide retail spreads botch your fast-moving engulfing candle entries. Open a Live Trading Account with ACY Securities today to automate your risk processing on tier-one institutional infrastructure with ultra-tight spreads.
👉 Upgrade your execution accuracy here: https://t.co/XRJE42mVG4
---
Risk Warning: Financial market derivatives trading carries a high level of risk to your capital and is not suitable for all investors. Ensure you fully comprehend structural price action and technical risk metrics before deploying live funds.
We just engineered a institutional Macro-Cycle Cheat Sheet to decode who is actually funding the market... 📉🔍
Most retail day traders are completely blind to the macro tug-of-war behind their technical indicators. They treat the chart like a video game, trying to scalping trade Gold (XAU/USD) or major currency pairs while completely disconnected from the 9-month to 2-year business cycle or central bank interest rates. When high-impact events like the FOMC hit, algorithmic systems push prices against the prevailing trend solely to trigger retail stop-losses. If you don't map this institutional liquidity hunt, you are the yield.
Stop reacting to short-term candle flashes. Learn to align your technical execution with the broader macro-cycle to survive algorithmic manipulation.
Th infographic lays out the raw system parameters:
• 🏛️ 1. THE MACRO FOUNDATION: Primary trends are driven by underlying economic business cycles, meaning your technical bias must reflect fundamental investor sentiment.
• 🪙 2. THE MONETARY COUPLING: When central banks lower interest rates, non-yielding assets like Gold fundamentally gain structural value; never fight this primary momentum during major news cycles.
• 🪤 3. INTRADAY FALSE BREAKOUTS: Anticipate the trap. Institutional players manipulate price action against the core trend to engineer a liquidity hunt before the rational trend resumes.
• 📊 4. THE "BIG THREE" FILTERS: Remove guesswork by deploying a 50-period EMA for pure trend bias, tracking an ATR filter to widen stop-losses (1.5x–2x) against market whipsaws, and checking RSI for absolute exhaustion.
• 📐 5. STRUCTURAL EXHAUSTION: Let the post-news volatility settle entirely. Isolate your execution entry points strictly on pullbacks into key Fibonacci retracement levels (38.2%–61.8%) aligned with the primary trend.
Stop executing high-volatility macro strategies on lagging retail broker tech. Open a Live Trading Account with ACY Securities today to route your technical execution through tier-one institutional infrastructure, ultra-tight spreads, and competitive multi-asset pricing.
👉 Upgrade your execution accuracy here: https://t.co/CGpPCV7K1U
Not ready to deploy live capital under high-volatility news spikes? Protect your equity while building a systematic edge. Access our complete Market Cycle Model and Trend Master Execution Guide on our website right now for free.
👉 Claim the free strategy guide here: https://t.co/iKkXttvD1i
--
Risk Warning: Trading financial derivatives and spot forex carries a high level of capital risk and is not suitable for everyone. Ensure you fully comprehend global macro-cycles and technical risk parameters before deploying live funds.
Why trading the immediate interest rate news drop is a guaranteed way to lose money. 🏛️🥶
Most retail traders leave 80% of their capital on the table because they try to front-run central bank releases. They view a rate hike headline, hit buy or sell out of pure emotional panic, and get instantly liquidated. They fail to realize that smart money prices in the moves weeks in advance, using the actual live press conference to trap retail liquidity.
Stop acting on initial news flashes. To win, you must stop predicting headline numbers and learn to trade the actual policy tone.
The blueprint from "Top XAUUSD Gold Traders on Tradingcup This Week (6).jpg" fixes your fundamental protocol:
• 🔄 CENTRAL BANK CONTROLS: Rate hikes cool inflation and boost a currency, while rate cuts drive growth but can weaken the currency's value.
• 📊 THE FX & COMMODITY PULSE: Track yield flow—the US Dollar strengthens when it holds a higher return, while Gold rallies heavily as rates fall.
• 🎙️ PRESS CONFERENCE SNIPER: Disregard the raw release; wait for the official press conference language to confirm a hawkish or dovish stance.
• 📋 THE PRO CHECKLIST: Avoid the headline trap completely. Never execute on a rate change alone; wait for the policy statement and gauge what the market has already priced in.
Execute your fundamental news strategies with absolute precision. Open an ACY Securities Live Account today to trade global macro events with institutional-grade pricing and lightning-fast execution speeds.
https://t.co/CGpPCV7K1U
---
Risk Warning: Trading financial derivatives involves significant risk of capital loss and is not suitable for everyone. Ensure you understand structural and fundamental interest rate risks before trading.
Why trading index breakouts right now is an absolute mathematical coin toss. ⚖️🥶
Most retail traders leave 80% of their capital on the table because they try to front-run trends while major stock indices are locked in heavy consolidation. Right now, the DAX is trapped in a structural tug-of-war between stabilizing market sentiment and intense manufacturing cost pressure, causing violent reversals inside a strict sideways channel.
Stop forcing trades in the middle of dead zones. To win, you must stop guessing and wait for price action to hit a concrete line in the sand.
The blueprint from "DAX-Market.jpg" fixes your execution protocol:
• 🔄 TRADE THE CHANNEL: Isolate the sideways consolidation channel on your 2H chart instead of chasing short-term 5-minute ticks.
• 🛑 RESPECT THE FLOORS: Lock your primary support focus at 24229, and prepare for a downside extension to 23930 if it breaks.
• 🏛️ MANAGE THE CEILINGS: Monitor pivotal resistance at 24619.27, and demand a clean structural break before targeting 25227.
• 🎯 MOMENTUM FILTERS: Combine Bollinger Bands for overextension with RSI/Stochastics to confirm turning points near the range boundaries.
Execute your index strategy with institutional precision. Open an ACY Securities Live Account to trade the DAX with lightning-fast order processing and competitive spreads.
https://t.co/RWdYXpfGIu
Protect your capital while building systematic consistency during market consolidation. Access our full multi-asset technical analysis and economic calendar breakdown for free.
https://t.co/7al2ftGaOr
---
Risk Warning: Trading stock indices involves a significant risk of loss. Ensure you completely understand range-bound volatility and underlying global economic catalysts before trading.
The hidden reason 90% of traders fail has nothing to do with their charts... 🧠🔍
Most retail day traders lose because they fight an invisible battle against their own biology. They map clean support and resistance zones, but the moment a losing streak hits, their execution falls apart. They treat discipline like a mood that changes with their short-term P/L, draining their emotional bandwidth and capital.
To survive modern financial markets, you must transition to identity-based execution.
• 📉 DO VS. DON'T EXECUTION: Move from outcome-driven reward excitement to a process-driven trading system.
• 🏷️ LABEL EMOTIONS: Treat fear as a protective signal to preserve capital, not a trigger to cut winners early.
• ⚓ ANCHOR IDENTITY: Evaluate your success strictly by your trading plan and risk management metrics.
• 📓 THOUGHT JOURNAL: Maintain a journal to expose mental narratives and eliminate trades forced out of boredom.
• 🔭 WAIT FOR CONFLUENCE: Refuse to find patterns in randomness; wait for concrete structural parameters.
Stop letting lagging tech create execution hesitation. Open a Live Trading Account with ACY Securities today to automate your risk management on tier-one infrastructure with ultra-tight spreads.
👉 Launch your Live Account here: https://t.co/RWdYXpfGIu
---
Risk Warning: Financial market derivatives trading carries high risk. Ensure you comprehend behavioral and market risks before deploying live funds.
Buying the Gold dip right now is an absolute trap... 🛑🪙
Most retail traders see a dropping market and let intense FOMO convince them that it’s "too cheap to sell." They catch falling knives without structural validation, overleverage their accounts based on emotional anticipation, and get aggressively wiped out by institutional momentum.
If you want to protect your capital this week, stop fighting the macro flow. Start executing on systematic bearish continuation.
Look at the infographic to map your technical and fundamental parameters before you trade:
🗓️ 1. MONITOR THE CATALYSTS: Massive fundamental volatility is hitting the economic calendar. Track June 16 (Building Permits), June 17 (Retail Sales), and the crucial June 18 Fed Interest Rate Decision to gauge currency volume.
📉 2. IDENTIFY THE STRUCTURE: Stop guessing a bottom. Price is consistently forming clear "Lower Highs," while the 50 EMA acts as a dynamic moving ceiling, reinforcing intense downside pressure from above.
🎯 3. CHOOSE YOUR ENTRY ZONE: The critical daily resistance supply area is strictly defined between $4,323 and $4,377.
📐 4. EXECUTE THE RETEST: Wait for price to pull back upward to test that major daily resistance zone. Demand an explicit bearish candlestick rejection at the level before risking a single dollar.
📋 5. THE HIGH-PROBABILITY IDEA: Scale your risk metrics mechanically. Look for an entry near $4,323 on resistance rejection, rigidly enforce your stop-loss above the daily resistance zone, and target the lower structural liquidity pool at $4,072.50.
Ready to trade with direct institutional infrastructure? Don't execute high-volatility news events with standard lagging tools.
👉 Click here to launch your Live Account and claim your tier-one trading edge:
https://t.co/RWdYXpfGIu
Not ready to go live or trade with real capital under high volatility? Don't risk your funds blindly.
Stay inside the safety zone. We just published the complete, zero-signup Gold XAU/USD Price Action Technical Analysis & Forecast on our website. Read the step-by-step masterclass article for free to learn how to track 50 EMA continuation models like a professional allocator.
👉 Click here to unlock the free strategy guide and protect your data:
https://t.co/XZttlFGP23
---
Risk Warning: Trading gold, foreign exchange, and derivatives carries significant risk of loss and is not suitable for all investors. You do not own, or have any interest in, the underlying assets. Ensure you understand the structural risks before trading.