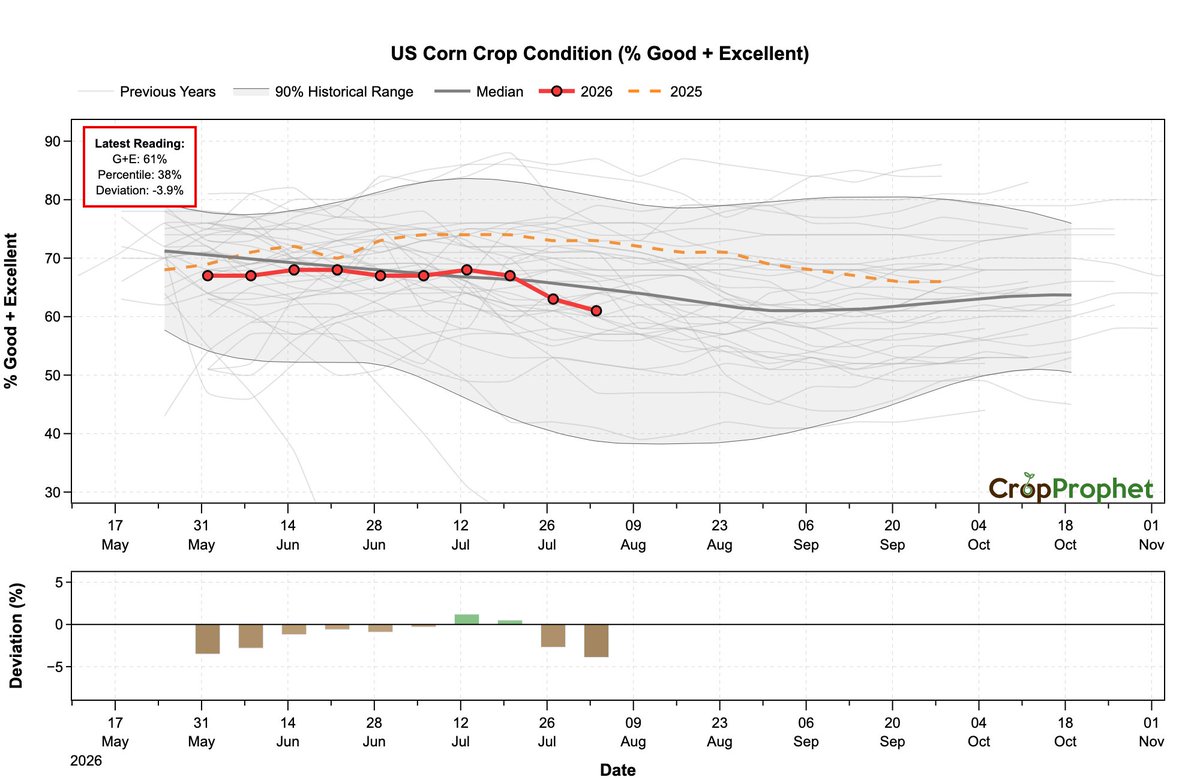
The U.S. corn condition rating declined this week, while the state data show substantially weaker conditions across the western Corn Belt.
The national corn crop rated Good or Excellent fell from 63% to 61%. The latest rating is 3.9% below the historical median and ranks in the 38th percentile.
Western Corn Belt deviations from the historical median:
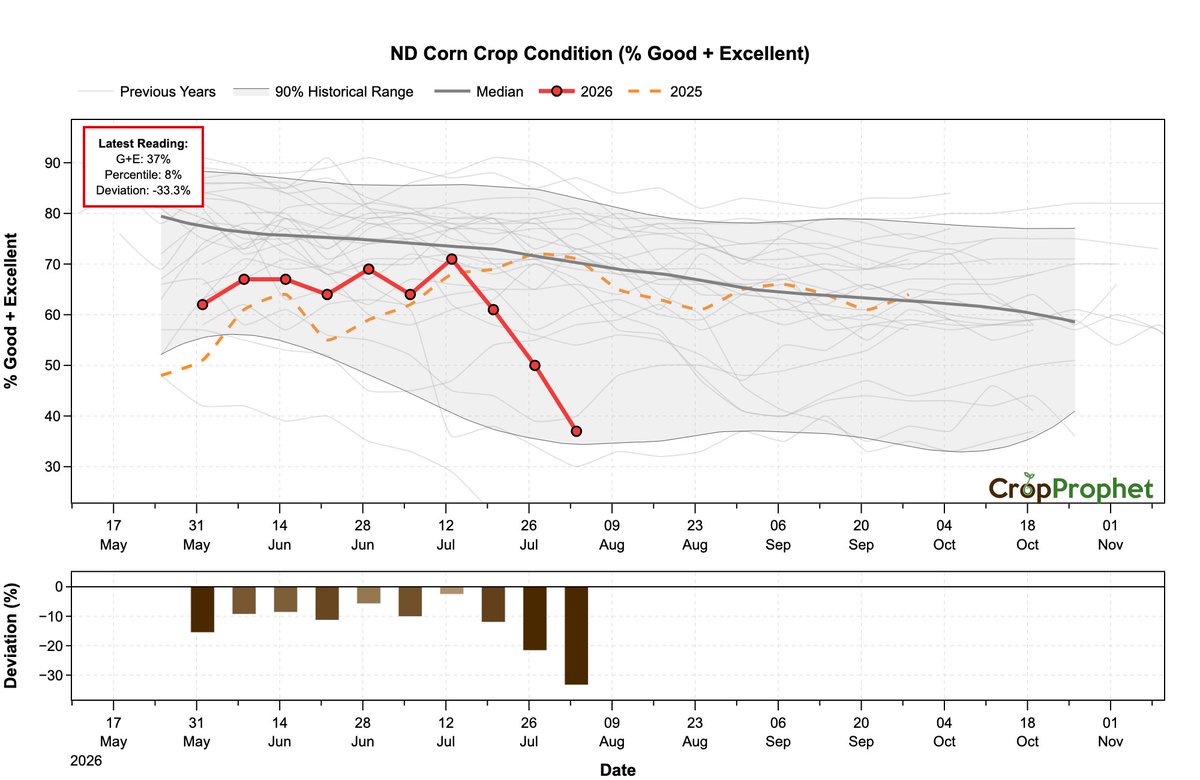
• North Dakota: −33.3%
• South Dakota: −20.7%
• Nebraska: −18.5%
• Kansas: −13.8%
North Dakota has recorded the sharpest recent decline. Its Good or Excellent rating fell from 71% on July 13 to 37% on August 3, placing the latest reading in the 8th percentile.
The regional difference is clear. Nebraska and South Dakota are well below their historical medians, while Iowa is 10.1% above its median.
Click the link in the comments below to get a risk-free trial of CropProphet. 👇
#OOTT #AgWx #Corn #CornBelt #GrainMarkets
Brazil’s soybean planting is running above its five-year average and well ahead of last year at this point in the season.
As the 2026/27 soybean crop progresses toward flowering, precipitation and temperature forecasts will become increasingly important for grain traders to monitor.
What are the today's 00z weather models showing?
Brazil soybean production-weighted precipitation forecasts (% of normal):
• ECMWF: 128.6%
• GEFS: 115.0%
• AIFS: 102.3%
Brazil soybean production-weighted average temperature anomalies (°F relative to normal):
• ECMWF: -0.7°F
• GEFS: -1.6°F
• AIFS: +0.3°F
All three models forecast near- to above-normal precipitation nationally, although regional differences are notable.
In Mato Grosso, for example, the ECMWF forecasts precipitation at 121% of normal, compared with 84% from GFS and 86% from AIFS.
As the growing season advances toward flowering, it will be important to monitor how these precipitation and temperature forecasts evolve across Brazil's soybean-producing regions.
See the attached maps for a closer look at the regional differences between the models.
Get a risk-free trial of CropProphet using the link in the comments below! 👇
#OOTT #AgWx #GrainMarkets #Soybeans #Soja #Brazil
Brazil’s 2026/27 soybean planting has reached 67%, with a +4.1% deviation from the CONAB five-year average as of November 6.
Bahia (+15%), Goiás (+14%), and Minas Gerais (+14%) show the largest positive deviations, while Paraná (-6%) is the furthest behind its five-year average among the states shown.
Brazil soybean planting progress by state:
(% planted | % deviation from CONAB 5-year average)
• Rio Grande do Sul: 23% planted | +3%
• Santa Catarina: 40% planted | +7%
• Paraná: 71% planted | -6%
• São Paulo: 90% planted | +1%
• Mato Grosso do Sul: 90% planted | +3%
• Mato Grosso: 96% planted | +3%
• Goiás: 74% planted | +14%
• Minas Gerais: 61% planted | +14%
• Bahia: 45% planted | +15%
• Tocantins: 35% planted | -2%
• Maranhão: 21% planted | +1%
• Piauí: 9% planted | -3%
See the maps and historical planting progress chart for a closer look at how the 2026/27 season compares with previous years.
#OOTT #AgWx #GrainMarkets #Soybeans #Soja #Brazil
Brazil’s 2026/27 soybean planting has reached 67%, with a +4.1% deviation from the CONAB five-year average as of November 6.
Bahia (+15%), Goiás (+14%), and Minas Gerais (+14%) show the largest positive deviations, while Paraná (-6%) is the furthest behind its five-year average among the states shown.
Brazil soybean planting progress by state:
(% planted | % deviation from CONAB 5-year average)
• Rio Grande do Sul: 23% planted | +3%
• Santa Catarina: 40% planted | +7%
• Paraná: 71% planted | -6%
• São Paulo: 90% planted | +1%
• Mato Grosso do Sul: 90% planted | +3%
• Mato Grosso: 96% planted | +3%
• Goiás: 74% planted | +14%
• Minas Gerais: 61% planted | +14%
• Bahia: 45% planted | +15%
• Tocantins: 35% planted | -2%
• Maranhão: 21% planted | +1%
• Piauí: 9% planted | -3%
See the maps and historical planting progress chart for a closer look at how the 2026/27 season compares with previous years.
#OOTT #AgWx #GrainMarkets #Soybeans #Soja #Brazil
Good point! One useful piece of context is how the models have performed recently. For Brazil soybean production-weighted precipitation, AIFS-ENS has had the lowest RMSE among AIFS-ENS, ECMWF, and GEFS for days 1-7 over roughly the past week. For days 8-14, GEFS has had the lowest RMSE of those three models.
That's based on a 21-day rolling window of forecast errors. Of course, recent performance doesn't guarantee which model will verify best this time, but it's useful context when comparing the different forecasts.
Data is from the Point-in-Time Weather Forecast API: https://t.co/YzO4xnhIb5
Mato Grosso’s soybean areas received just 61% of normal precipitation over the 30 days ending November 2. Now, the forecast models differ considerably on rainfall for the next two weeks.
Mato Grosso soybean production-weighted precipitation forecasts from today's 00Z models for November 6–20:
• ECMWF: 112% of normal
• AIFS-ENS: 79% of normal
• GFS ensemble (GEFS): 71% of normal
Why focus on Mato Grosso?
The state accounted for 28.3% of Brazil’s soybean production during 2020–2024, more than double Paraná’s 13.9% share, the second-largest in the country.
Brazil's national soybean production-weighted precipitation forecasts for the same period:
• ECMWF: 113.1% of normal
• AIFS-ENS: 82.8% of normal
• GEFS: 94.6% of normal
The timing of the forecast rainfall also matters. Days 1-7 are forecast to be considerably drier, particularly across northern Brazil and Mato Grosso, than days 8-14.
With Mato Grosso already coming off a notably dry 30-day period, the differences between the models and the timing of potential rainfall deserve close attention.
Request a risk-free trial of CropProphet using the link in the comments below!
#OOTT #AgWx #GrainMarkets #Soybeans #Soja #Brazil
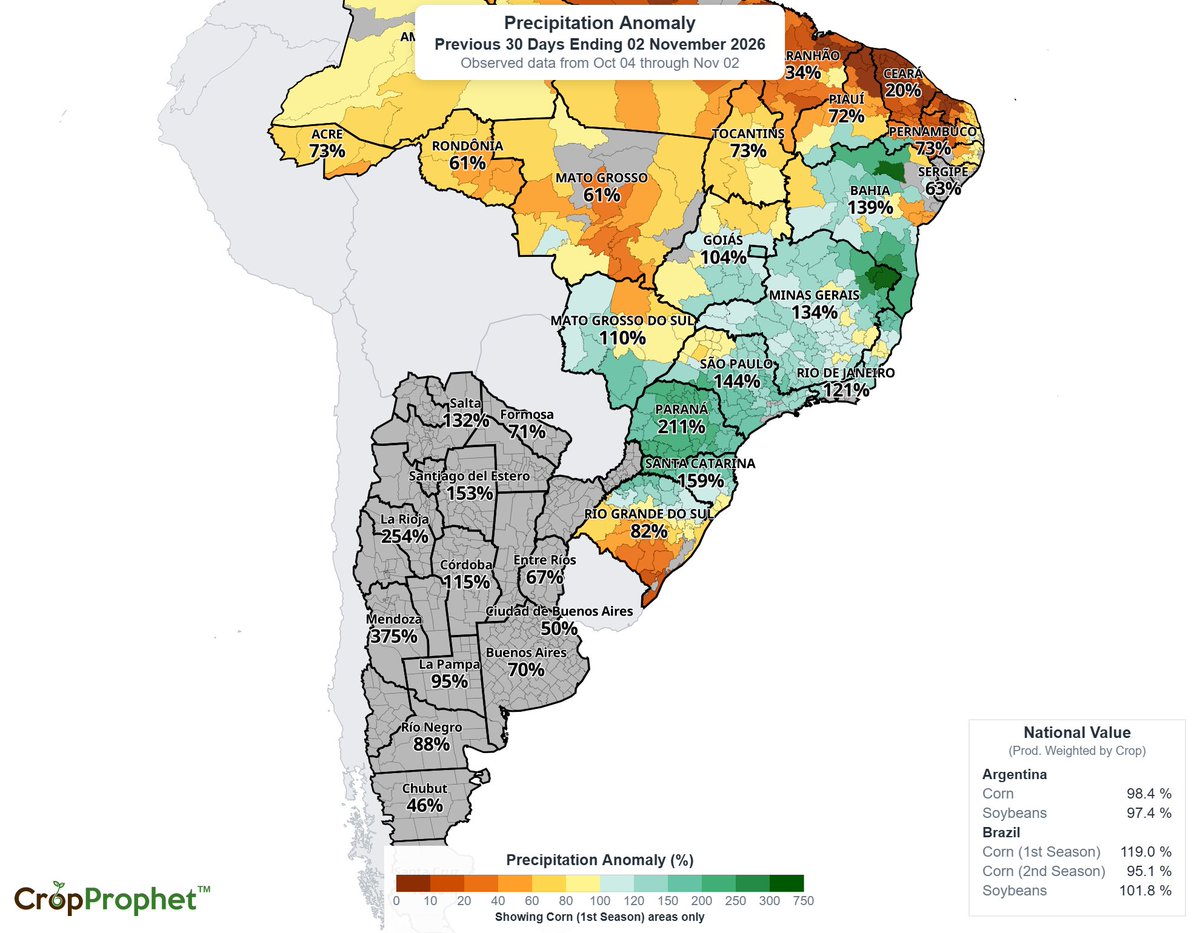
Brazil’s largest soybean-producing state has received just 61% of normal precipitation over the 30 days ending November 2, 2026.
Mato Grosso’s soybean production-weighted precipitation was 39% below normal during this period. First-season corn areas recorded the same precipitation deficit.
Why does this matter for soybeans?
Mato Grosso accounted for 28.3% of Brazil’s soybean production during 2020–2024, more than double the 13.9% share of Paraná, the country’s second-largest soybean-producing state.
The contrast is notable: while Mato Grosso received just 61% of normal precipitation, Paraná received 211% over the same 30-day period.
#OOTT #AgWx #GrainMarkets #Soybeans #Soja #Corn #CornBelt #Milho
Brazil’s largest soybean-producing state has received just 61% of normal precipitation over the 30 days ending November 2, 2026.
Mato Grosso’s soybean production-weighted precipitation was 39% below normal during this period. First-season corn areas recorded the same precipitation deficit.
Why does this matter for soybeans?
Mato Grosso accounted for 28.3% of Brazil’s soybean production during 2020–2024, more than double the 13.9% share of Paraná, the country’s second-largest soybean-producing state.
The contrast is notable: while Mato Grosso received just 61% of normal precipitation, Paraná received 211% over the same 30-day period.
#OOTT #AgWx #GrainMarkets #Soybeans #Soja #Corn #CornBelt #Milho
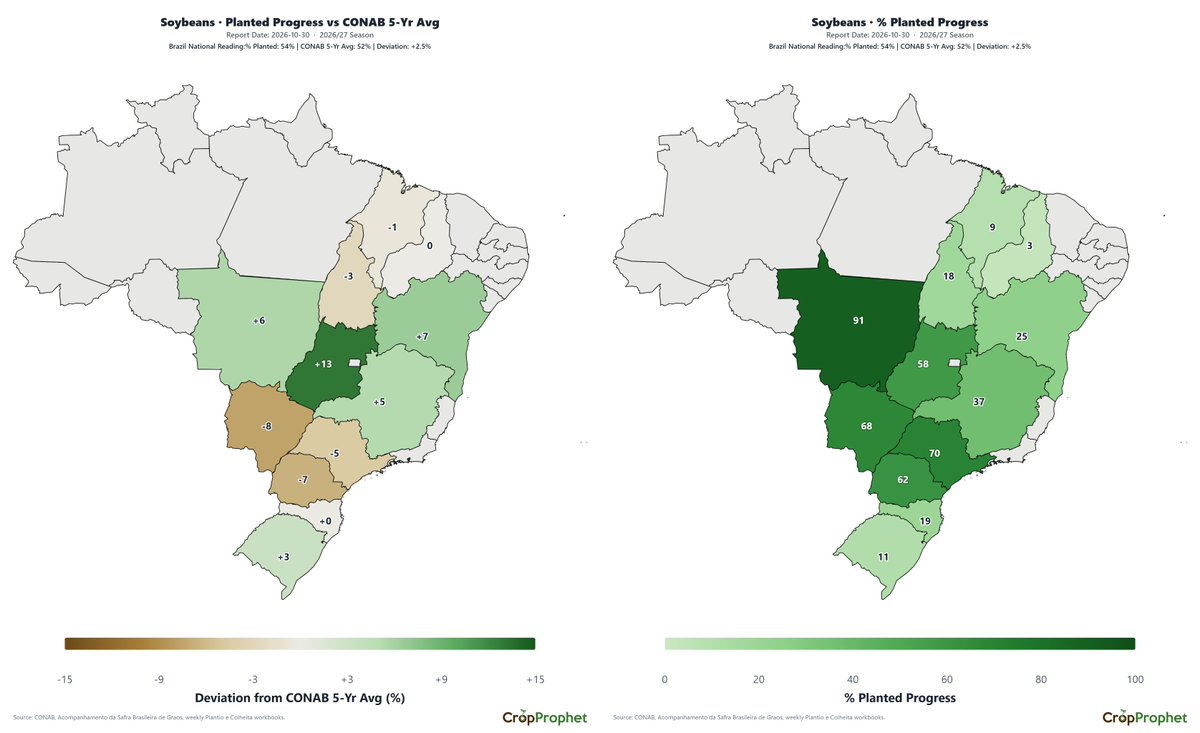
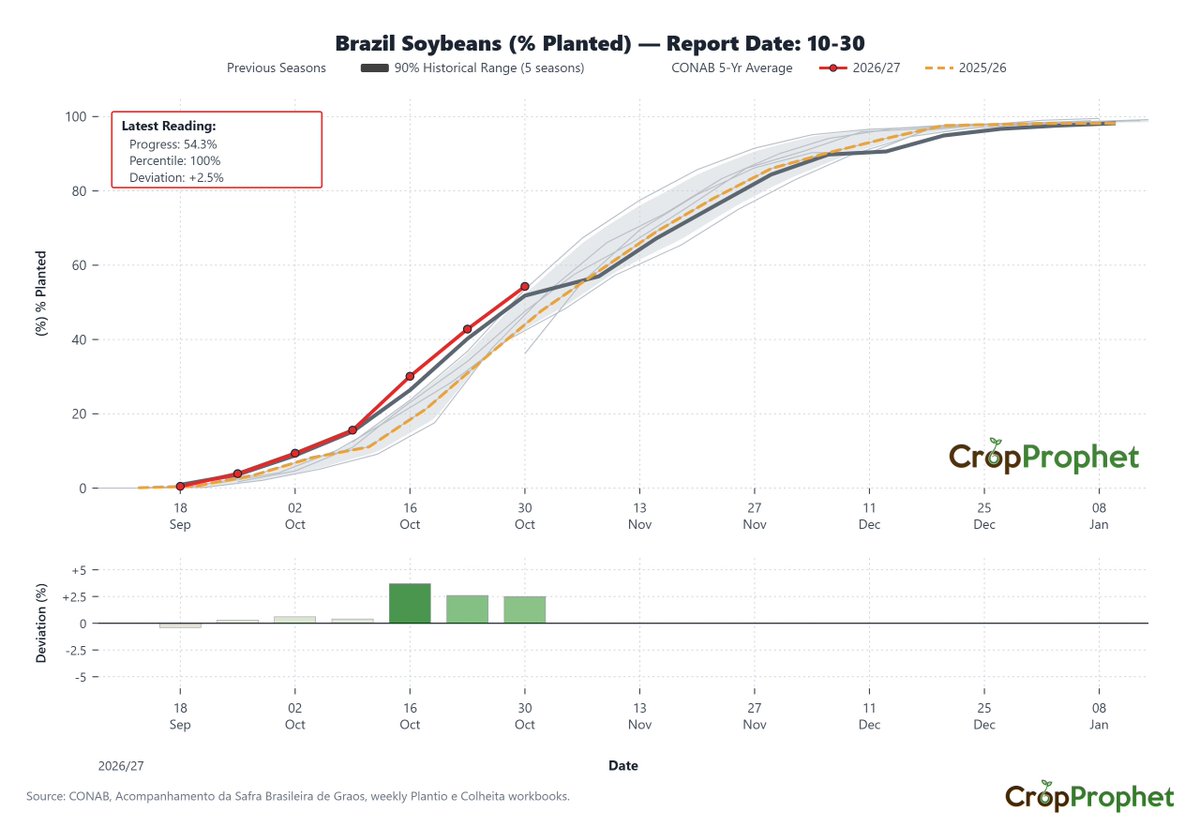
Brazil’s soybean planting reached 54.3% as of October 30, but state-level deviations range from +13% in Goiás to -8% in Mato Grosso do Sul.
Nationally, planting shows a +2.5% deviation from the CONAB five-year average.
State-by-state soybean planting progress
% planted | % deviation from CONAB 5-year average
• Mato Grosso: 91% | +6%
• Goiás: 58% | +13%
• Mato Grosso do Sul: 68% | -8%
• Paraná: 62% | -7%
• São Paulo: 70% | -5%
• Minas Gerais: 37% | +5%
• Bahia: 25% | +7%
• Tocantins: 18% | -3%
• Rio Grande do Sul: 11% | +3%
• Santa Catarina: 19% | 0%
• Maranhão: 9% | -1%
• Piauí: 3% | 0%
Mato Grosso, Brazil’s largest soybean-producing state, was already 91% planted, with a +6% deviation from its five-year average.
While Brazil is ahead of its historical planting pace nationally, the state-level data show notable differences across producing regions.
#OOTT #AgWx #Soybeans #Brazil #Soja #GrainMarkets
What does the recent U.S. soybean harvest tell us about the impact of August weather on yields?
Looking at 40 years of data (1986–2025), one weather variable stands out: August high temperatures.
🌡️ August Temperature: Soybean yields relative to trend have a negative correlation with August highs (r = -0.55). Cooler Augusts have generally been associated with above-trend yields.
🌧️ August Rainfall: Rainfall also matters, but the relationship is weaker (r = +0.36). Wetter Augusts have generally aligned with stronger yields.
The takeaway for grain traders?
August heat has historically shown a stronger relationship with U.S. soybean yield deviations than August rainfall.
With the 2026 soybean harvest fresh in mind, it's a useful reminder that not all weather variables carry the same weight when evaluating yield potential.
At CropProphet, we quantify these weather-yield relationships to help market participants better assess crop production risk.
#Soybeans #GrainTrading #CropProphet #Agriculture #WeatherAnalytics #OATT
Weather models differ considerably on Brazil’s precipitation forecasts, with GEFS and AIFS forecasting less rainfall than ECMWF.
For October 26 to November 9, the production-weighted precipitation forecasts show:
• Brazil soybeans: GEFS 88.1% | AIFS 77.5% | ECMWF 106.5% of normal
• Brazil first-season corn: GEFS 111.3% | AIFS 87.8% | ECMWF 121.3% of normal
But which model has been more accurate recently?
The 14-day rolling precipitation RMSE charts show that AIFS has generally recorded lower forecast errors than GEFS, GFS, and ECMWF in recent runs, particularly for days 8–14.
With these differences in precipitation forecasts, which model should grain traders give more weight to?
Grain traders, use the link in the comments to request a risk-free trial of CropProphet! 👇
#OOTT #AgWx #GrainMarkets #Corn #CornBelt #Soybeans #Milho #Soja
Could excessive early-June rainfall have contributed to weaker corn yields in parts of Illinois and Iowa?
In central and western Illinois and east-central and southeast Iowa, three-day rainfall totals reached up to 4 inches, with many counties recording one of their five highest early-June three-day totals since 1981.
These areas also recorded the largest declines in CropProphet's corn yield forecasts among Iowa and Illinois districts between June 1 and October 15.
By comparison, central and west-central Iowa did not experience similarly heavy early-June rainfall at the county level, and corn yield forecasts in those areas finished above trend.
CropProphet's June 16 and June 30 commentaries which are sent to customers had already documented declines in county-level yield forecasts in areas affected by excessive rainfall.
The GIF tracks observed precipitation, expressed as a percentage of normal, alongside county-level corn yield forecasts relative to trend throughout June 2026.
#OOTT #AgWx #GrainMarkets #Corn #CornBelt
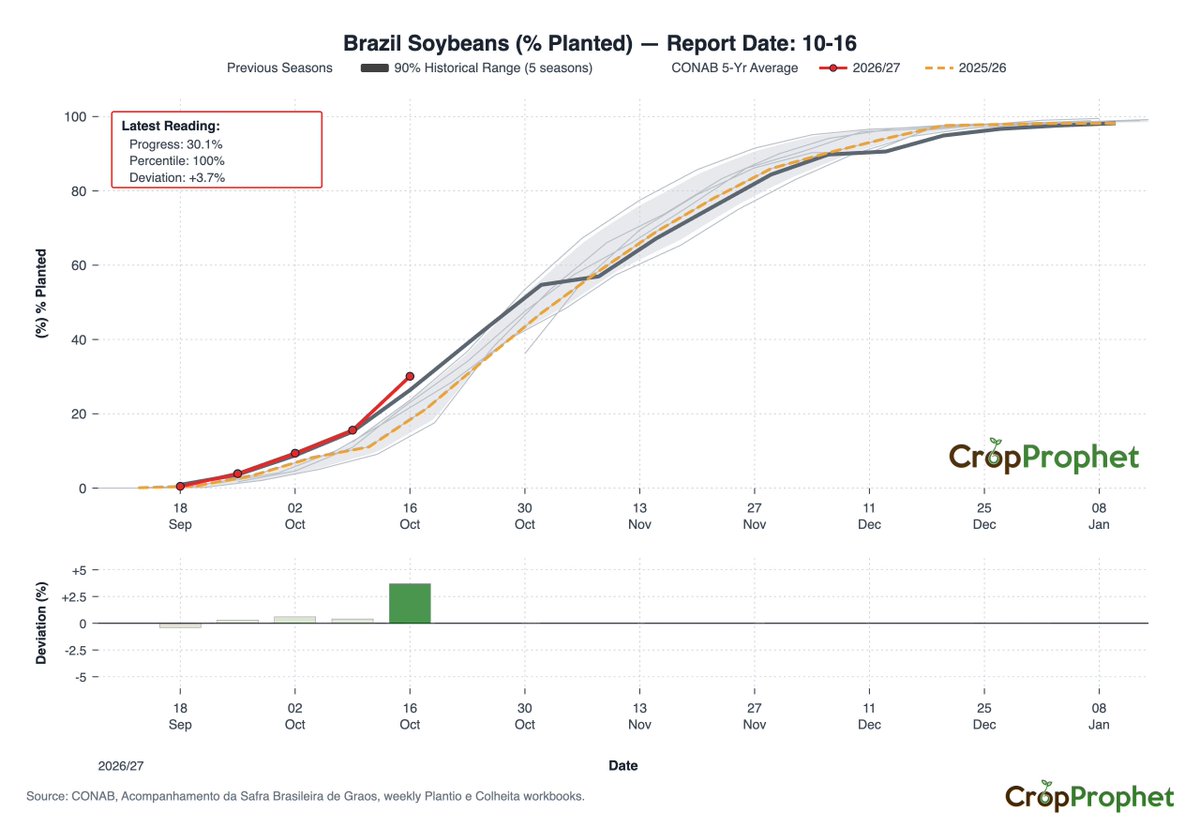
Brazil’s soybean planting has reached 30%, up from 16% last week, with Mato Grosso leading at 61% planted.
As of October 16, national planting progress for the 2026/27 season is 3.7% above CONAB’s 5-year average.
Brazil soybean planting progress by state:
% Planted | % Deviation from CONAB 5-Year Average
• Rio Grande do Sul: 1% | +1%
• Santa Catarina: 11% | +1%
• Paraná: 39% | -1%
• São Paulo: 35% | -6%
• Mato Grosso do Sul: 28% | -7%
• Mato Grosso: 61% | +13%
• Minas Gerais: 11% | 0%
• Goiás: 26% | +7%
• Bahia: 14% | +8%
Mato Grosso has the highest reported planting progress at 61%, running 13% above its 5-year average.
Meanwhile, Mato Grosso do Sul (-7%) and São Paulo (-6%) are behind their respective historical averages.
#OOTT #AgWx #Soybeans #Soja #Brazil #GrainMarkets