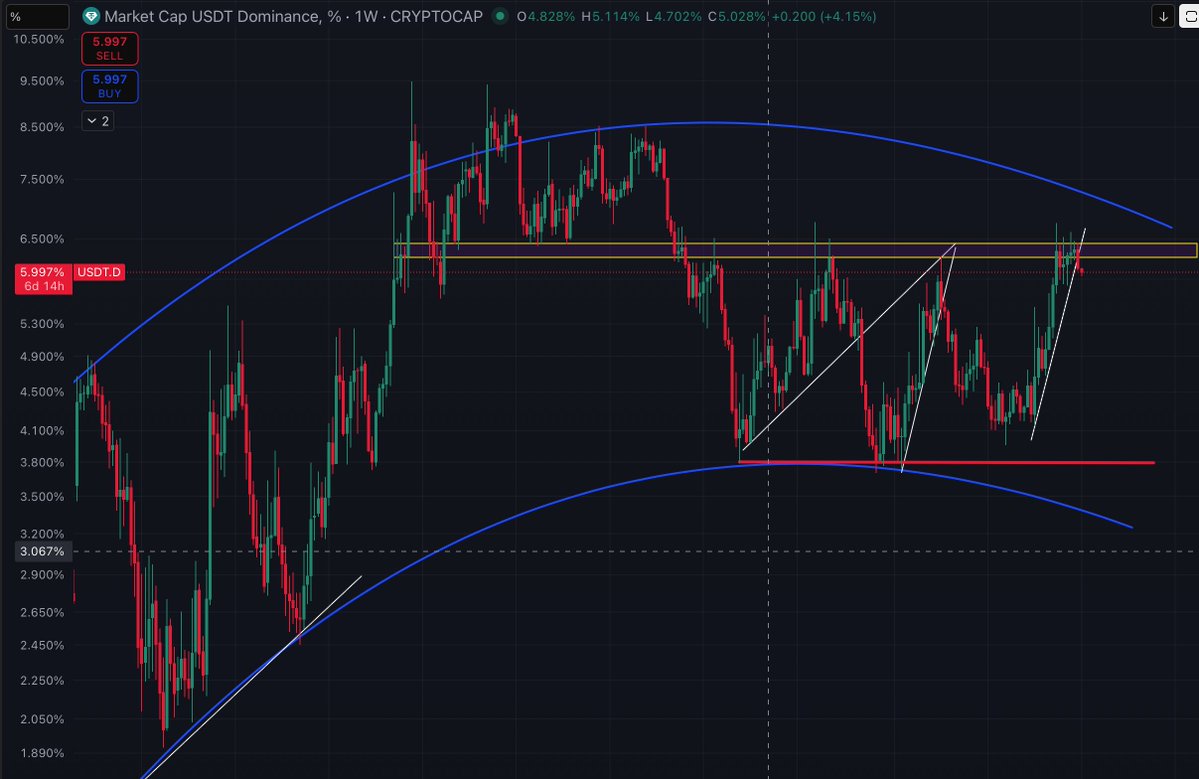
USDT DOMINANCE CHART:
How does USDT.D movement affect the movement of Bitcoin price?
1. Rising USDT Dominance → Often Bearish or Cautious for Bitcoin
It usually means:
*Traders are selling BTC into USDT
*Investors are moving to stablecoins to reduce risk
*Capital is sitting on the sidelines
2. Falling USDT Dominance → Often Bullish for Bitcoin
When USDT dominance declines, it suggests:
*Traders are deploying USDT into BTC
*Fresh capital is entering the market
*Risk appetite is increasing
Since Nov, 2023, the 6.2% - 6.4% area (USDT.D) has been a very strong resistance and every breakedown from that level led to a big bullish move on the BTC price
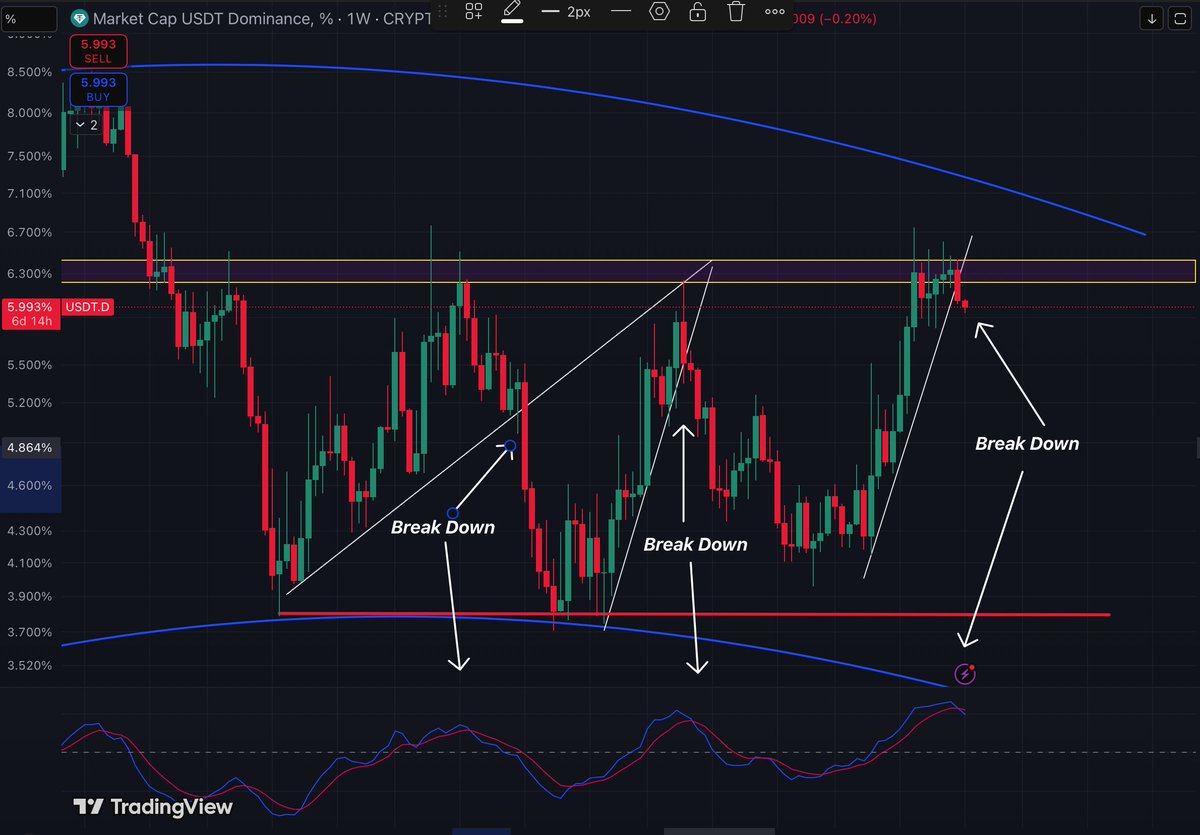
FRAME 2: Right now USDT.D is bearish and looking at the chart on frame 2, every time the ascending trend line broke to the downside with a brearish cross on the TSI indicator, BTC do have a big pump.
Currently, the ascending trendline is broken and the TSI is also bearish.
BIG Moving for BTC is on the way
@Faith181107@YahayaCrypto On the daily, USDT.D will find resistance in this yellow box. It means BTC could find trouble breaking down below $60k in the next few days.
@Faith181107@YahayaCrypto If u get used to USDT.D, it well help u know the overall direction of BTC on a daily or weekly. And Majority of ALTS follow the direction of BTC.
@Faith181107@YahayaCrypto I run analysis on USDT.D
* It's simply a USDT dominance
* It works in opposite direction. When USDT.D is going up, BTC will go down. And when USDT.D is going down, BTC is going up.
This is my little secret i used to know the overall direction of BTC