If we study #Bitcoin on the monthly timeframe, a clear behavioural pattern appears after every major bull market top.
Bitcoin macro cycles continue to show a repeating rhythms. not identical, but structurally similar after each major all-time high.
In 2017, BTC topped near 20K and then entered a prolonged correction that lasted about 13 months, with an 80% drawdown and multiple failed relief rallies before a true bottom formed. It wasn’t a quick crash and recovery it was a long distribution and accumulation process.
In 2021, BTC topped again near 69K and followed a very similar path. The decline stretched roughly 14 months, printed a 75%+ drop, and included several strong bounces that trapped late buyers. The real reversal only started once price reclaimed strong macro support.
Now in the 2024–2025 structure, BTC pushed into a new ATH zone around 126K and rejected near long-term trendline resistance.
Across all three cycles, the pattern is consistent: parabolic move into highs → rejection → multi-month corrective phase → relief rallies → base building at major support.
A corrective bounce toward 90K–100K is still possible and wouldn’t be unusual similar counter-trend rallies happened in past cycles but that would more likely be a relief move or lower high rather than an immediate launch to new highs.
The most important area to watch, in my opinion, is the $55K–$45K support zone. This region aligns with prior breakout structure and higher-timeframe demand and would be a logical place for deeper re-accumulation and the foundation of the next long-term uptrend.
Based on historical structure, I’m not expecting new ATHs soon. Markets typically need both time and price correction before the next major expansion phase begins. Patience around macro support has historically offered better risk-reward than chasing late-stage highs.
Currently holding all my coins.
$TAO
$FET
$LTC
$ZEC
As shared previously, several of our targets have already been achieved.
$ZEC $400,500,600 ✅
$TAO $250,300,350 ✅
$FET $200,250 ✅
I'll continue holding my positions and look to accumulate more during market dips.
If we study #Bitcoin on the monthly timeframe, a clear behavioural pattern appears after every major bull market top.
Bitcoin macro cycles continue to show a repeating rhythms. not identical, but structurally similar after each major all-time high.
In 2017, BTC topped near 20K and then entered a prolonged correction that lasted about 13 months, with an 80% drawdown and multiple failed relief rallies before a true bottom formed. It wasn’t a quick crash and recovery it was a long distribution and accumulation process.
In 2021, BTC topped again near 69K and followed a very similar path. The decline stretched roughly 14 months, printed a 75%+ drop, and included several strong bounces that trapped late buyers. The real reversal only started once price reclaimed strong macro support.
Now in the 2024–2025 structure, BTC pushed into a new ATH zone around 126K and rejected near long-term trendline resistance.
Across all three cycles, the pattern is consistent: parabolic move into highs → rejection → multi-month corrective phase → relief rallies → base building at major support.
A corrective bounce toward 90K–100K is still possible and wouldn’t be unusual similar counter-trend rallies happened in past cycles but that would more likely be a relief move or lower high rather than an immediate launch to new highs.
The most important area to watch, in my opinion, is the $55K–$45K support zone. This region aligns with prior breakout structure and higher-timeframe demand and would be a logical place for deeper re-accumulation and the foundation of the next long-term uptrend.
Based on historical structure, I’m not expecting new ATHs soon. Markets typically need both time and price correction before the next major expansion phase begins. Patience around macro support has historically offered better risk-reward than chasing late-stage highs.
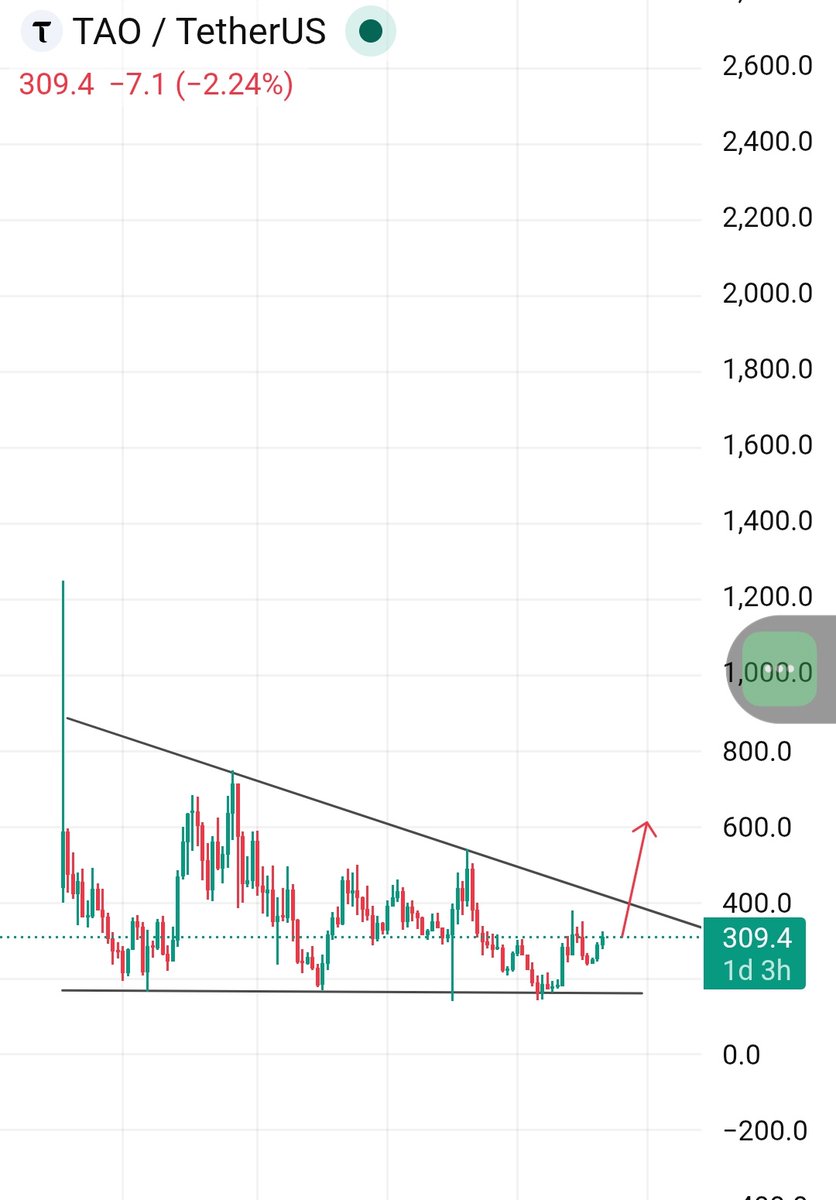
$TAO is still holding its bullish trendline perfectly and looks ready to start another wave from here.
A move toward $350-$400 looks highly possible in coming days.
$ZEC road to $700 🚀
Called it at $200, and now it’s trading near $700 ✍️
Patience and trust in the analysis paid off beautifully.
$200 to nearly $700, What a move for @Zcash holders.
Re-buying $ZEC from this level.
Chart is showing strong support around the $200 level and looks ready to take off from this demand zone.
A move toward the $300–$400range could be possible in the coming weeks.
$eth $dent $resolv $dego $baby
$LTC is currently testing and holding a very important support area on the daily timeframe.
Expecting a reversal from here towards new highs is likely possible in the coming days.
@litecoin send it.
Many people start shorting $LAB when $SKYAI began dumping.
But instead of dropping, $LAB started pumping to liquidat shorts.
Remember, shorting is riskier than longing especially on highly volatile tokens.
I’m not doing leverage trading this is just advice for leverage traders
My watchlist right now 👀
$ZEC — See you above $700
$TAO — See you above $400
$LTC — See you above $100
$FET — See you above $0.3
Just need some patience before the next major moves 🔥
I gave you the bottom on $ZEC before the massive 220% pump.
I gave you the bottom on $TAO before the breakout that delivered a 120% move.
I gave you the bottom on $FET before the rally that surged over 80%.
Now it’s $LTC turn before the real move begins.
I gave you the bottom on $ZEC before the massive 220% pump.
I gave you the bottom on $TAO before the breakout that delivered a 120% move.
I gave you the bottom on $FET before the rally that surged over 80%.
Now it’s $LTC turn before the real move begins.
As mentioned before, The market is slowly turning green and money is starting to rotate back into altcoins.
Many alts appear to have formed their bottoms and are now showing early signs of strong reversals
we could see a broader altseason like recovery in the coming weeks.
Most midcap and lowcap altcoins are still trading near their all-time lows, showing that a large part of the market remains undervalued and still hasn’t joined the upside movement.
Meanwhile, #TOTAL2 is holding a major rising trendline that has been respected since 2020. Every touch of this level has led to a strong upside move.
We’re currently seeing another bounce from this support zone and the next big move in the alts might already be loading.
I gave you the bottom on $ZEC before the massive 220% pump.
I gave you the bottom on $TAO before the breakout that delivered a 120% move.
I gave you the bottom on $FET before the rally that surged over 80%.
Now it’s $LTC turn before the real move begins.
Re-buying $ZEC from this level.
Chart is showing strong support around the $200 level and looks ready to take off from this demand zone.
A move toward the $300–$400range could be possible in the coming weeks.
$eth $dent $resolv $dego $baby