#GIVEAWAY#ALERT
30,000 members is the goal. And we’re getting closer every day.
27K+ strong. 2,731 to go.
If we hit 30,000 before Q1 ends:
🎟 3 Private Club Giveaways Worth $690 each
🎁 1 Lucky Subscriber Wins $500
Share with friends https://t.co/cBmxri0fPQ
#RENDER is still under the larger Broadening Wedge , so the macro trend has not fully flipped yet. But short term, price is building a clean ascending channel with higher lows, showing buyers are slowly gaining control.
RSI is also holding an upward trendline, which supports the idea of improving momentum. The key breakout zone is around 2.30 - 2.50. If price breaks and holds above that area, RENDER could open a stronger move toward 3.50+.
But if price loses the lower ascending channel support, the setup weakens and a pullback toward 1.80 - 1.60 becomes possible.
Right now, this is a bullish short-term structure fighting against macro downtrend resistance. Break above 2.50 is the real confirmation.
#XLM has finally delivered a decisive breakout after months of trading below the descending trendline. The recent impulsive move not only broke the downtrend but also reclaimed the key 0.24 - 0.25 resistance zone, which previously acted as major supply.
The current structure suggests this move is more than just a temporary spike. Price has shifted market structure bullishly, and the reclaimed resistance zone is now expected to act as support on any pullback.
The most important area to watch is the 0.18 - 0.20 demand zone highlighted on the chart. A healthy retest of this region would strengthen the bullish continuation case and provide confirmation that the breakout is holding.
Key levels ahead:
• 0.24 - 0.25 reclaimed breakout zone
• 0.29 - 0.30 next major resistance
• 0.52 higher timeframe target if momentum continues
The hidden strength in this chart is that the breakout occurred after a long accumulation period near the lows. Those types of breakouts often have more follow-through than short-term momentum pumps.
As long as XLM remains above the reclaimed structure and demand zone, the broader bias remains bullish, with buyers now targeting significantly higher levels in the coming weeks.
#FET is showing one of the strongest recovery structures among AI-related coins right now. After spending months inside a major descending channel, price has finally pushed into the long-term resistance trendline and is attempting a breakout.
The key bullish development is that FET has been forming higher lows since March, creating a rising support trendline while repeatedly attacking the descending resistance. This type of compression often appears before a larger directional move.
Price is now testing the critical 0.25 - 0.27 resistance zone. A confirmed breakout and hold above this region would signal a potential trend reversal rather than just another relief rally.
Key levels to watch:
• 0.25 - 0.27 immediate breakout zone
• 0.35 first major upside target
• 0.50+ higher timeframe resistance
• 0.80 long-term bullish objective if momentum accelerates
The most important support remains around 0.19, which is also where the rising trendline currently sits. As long as that level holds, bulls maintain control of the structure.
For now, FET is at a decision point. A successful breakout from the macro downtrend could mark the beginning of a much larger recovery phase after months of accumulation. 🚀
#WLD is showing one of the stronger recovery structures here after breaking out from the local falling wedge and reclaiming important value areas. Price has now pushed through the previous consolidation zone around 0.34 - 0.38, while volume expansion also supports the move.
The RSI on the daily timeframe is also showing strength, pushing into the upper region while maintaining higher lows. That suggests momentum is accelerating rather than fading, although short-term cooling after the sharp move would be normal.
The highlighted 0.30 - 0.32 zone now becomes the key support area. If price retests and holds this region, it would strengthen the bullish continuation setup.
Upside levels to watch:
• 0.44 - 0.45 first resistance zone
• 0.52 - 0.58 major supply area
• Longer-term move could extend toward the macro descending trendline if momentum remains strong
As long as WLD stays above the reclaimed structure, the current move still looks like continuation rather than a temporary spike. The key truth here is that price has not fully escaped the larger macro downtrend yet, but buyers are beginning to take control of the shorter-term structure.
#SCR experienced a heavy breakdown earlier this year after rejecting from the major supply zone around 0.082 - 0.088, but price is now showing signs of stabilization inside a rising structure on the 12H timeframe.
The market recently reacted strongly from the ascending trendline near 0.042 - 0.043, which is currently acting as the key support zone. Buyers stepped in aggressively there, preventing further downside continuation.
At the same time, price still remains below the local resistance around 0.055 - 0.056, making this the key breakout level bulls need to reclaim for stronger continuation.
If SCR manages to hold the ascending support and break above the upper trendline resistance, the market could push toward:
0.055
0.066
Potentially revisit the higher supply zone near 0.082+
However, if support fails, the ascending structure would weaken and price could revisit the lower demand region around 0.040 again.
For now, SCR is trading inside a compression range, and the next breakout from this structure will likely decide the next major directional move.
#NOT recently broke out from the long-term descending structure with strong momentum, but instead of instantly continuing higher, price is now cooling off into a healthy retracement zone around the 0.5 – 0.786 Fibonacci area.
This pullback is important because the market is currently retesting previous breakout structure while still holding above the ascending support trendline. As long as price remains above the 0.00046 – 0.00047 region, the bullish structure remains intact.
The rejection from the upper resistance near 0.00066 caused short-term profit taking, but the overall structure still looks constructive after months of compression inside the macro channel.
If buyers continue defending the highlighted demand zone, NOT could build momentum for another expansion toward:
0.00066
0.0010
Potentially higher if volume returns strongly.
However, losing the current support area would weaken the breakout structure and could drag price back toward the lower range again.
For now, this looks more like a retest after breakout rather than a full trend reversal.
#PENGU recently pushed into the major descending resistance and got rejected right below the long-term trendline, showing that sellers are still defending the macro structure.
Right now, price is pulling back into the 0.5–0.786 Fibonacci retracement zone, which is acting as the key demand area in the short term. This orange box is the most important region to hold if bulls want continuation.
What makes this setup interesting is that the market already created a strong impulsive move from the range low near 0.0060, meaning current weakness still looks more like a corrective retest rather than a full bearish breakdown.
If buyers defend this support zone and reclaim momentum, PENGU could attempt another breakout toward:
0.0105
0.0140
Potentially 0.0160+ if the macro downtrend finally breaks.
But if price loses the highlighted demand area, the market could revisit the lower support around 0.0060 again before any larger upside continuation.
For now, this is a critical reaction zone and the next move from here will likely decide whether PENGU transitions into a larger reversal structure or remains trapped inside the macro downtrend.
#4USDT
Price is still trading under a long-term descending trendline, but the market is now compressing tightly above the 0.0094 support zone, which has been defended multiple times.
Recent price action shows weakening bearish momentum, with volatility shrinking as price approaches the apex of the structure.
What’s happening:
Macro downtrend still intact
Strong horizontal support holding around 0.0094
Lower highs continuing under descending resistance
Compression phase forming near breakout point
Bullish scenario:
A breakout above the descending trendline could trigger a recovery move toward:
0.0158
0.0195
Potentially 0.0235 if momentum expands strongly.
Bearish scenario:
If support at 0.0094 breaks, the structure weakens significantly and price could revisit the lower demand area around 0.006 – 0.0062.
Right now, this looks like a high-pressure compression setup where the market is approaching a decisive move after a long downtrend phase.
#TURBO has been trading inside a long-term descending channel, but recent price action is starting to show a structural shift.
After forming a rounded base near the channel lows, price created an ascending structure with higher lows and is now pressing against the key resistance zone around 0.00115 – 0.00120.
What’s happening:
Bullish accumulation forming near the bottom of the channel
Higher lows continue to build pressure
Price attempting breakout from short-term ascending triangle structure
The major level to watch is 0.00146 resistance. A breakout above that zone could trigger strong momentum expansion.
Bullish scenario:
If buyers hold the ascending support and break above 0.00146, TURBO could accelerate quickly toward 0.0020 – 0.0029.
Bearish scenario:
Failure to hold the current structure may lead to a retest of the 0.00088 support zone and potentially continuation inside the broader downtrend channel.
Right now, TURBO is sitting at a compression point where volatility expansion looks close, and the structure is leaning bullish while support continues to hold.
#CELR has been trading inside a long-term descending channel for months, but the structure is now starting to shift.
Price recently near the channel upper trendline and is now pushing upward with higher lows, approaching the key descending resistance around 0.0031 – 0.0033.
What’s happening:
Bullish structure forming from the bottom of the channel
Short-term ascending trendline holding well
Price compressing into major resistance
The highlighted green area above marks a large HTF FVG zone, which could become the next target if breakout momentum continues.
Bullish scenario:
A clean breakout above the descending resistance could trigger expansion toward 0.0045 – 0.0055, with potential continuation into the higher FVG zone afterward.
Bearish scenario:
If rejected from current resistance, price may retest the 0.0024 – 0.0025 support area before another attempt higher.
Right now, CELR is sitting at a critical breakout point, and momentum is slowly favoring the bulls after a long downtrend phase.
#KAS is showing strong momentum after respecting the lower trendline of the macro descending channel and pushing upward into key resistance.
Price has now reclaimed the short-term ascending support and is attempting to break above the major descending trendline that has controlled the market for months.
What’s happening:
Higher lows continue to form
Bullish pressure increasing near resistance
Price testing the key breakout zone around 0.036 – 0.039
Bullish scenario:
A confirmed breakout and hold above the descending resistance could trigger a strong expansion toward 0.045, followed by a potential move into the 0.06+ region.
Bearish scenario:
If price gets rejected from this resistance zone, a pullback toward 0.033 – 0.030 support is possible before another breakout attempt.
Right now, KAS is sitting at a major decision point, and the structure is starting to shift bullish after months of downtrend compression.
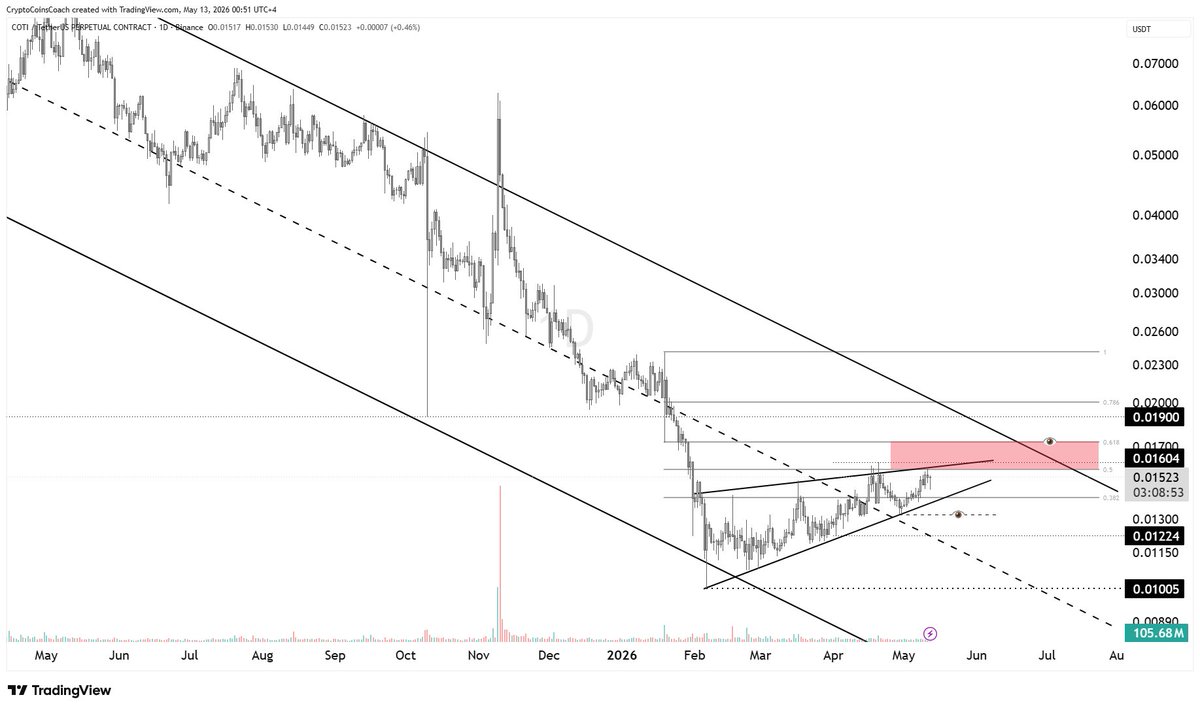
#COTI is still trading inside a macro descending channel, and the current move looks like a relief rally into resistance rather than a confirmed trend reversal.
After forming a base near the lows, price has pushed up and is now testing a confluence zone:
Descending trendline resistance
Fibonacci 0.5 – 0.618 area
Horizontal supply zone around 0.0155 – 0.0165
What’s happening:
Higher lows forming short term
Price compressing into resistance
Momentum slowing as it approaches supply
Bullish scenario:
A clean breakout and hold above 0.0165 could shift structure and open a move toward 0.019 – 0.021 and after 0.025.
Bearish scenario:
Rejection from this zone is likely, which could send price back toward 0.013 → 0.012 support, and potentially continue within the larger downtrend.
Right now, this is a decision zone, where price is testing strong resistance inside a broader bearish structure.
#USELESS has finally broken out of its long-term descending channel, shifting the structure from bearish to early bullish.
After months of compression inside the channel, price formed a base (highlighted range) and then pushed strongly upward, reclaiming momentum.
What’s happening:
Clean breakout from descending channel
Strong impulse move with volume expansion
Range accumulation acting as a solid base
Key levels:
Immediate support: 0.05 – 0.06 zone (previous range top)
Current momentum level: ~0.079
Higher resistance targets: 0.15 → 0.40 HTF zones
Bullish scenario:
If price holds above the breakout zone and flips it into support, continuation toward 0.15 is likely. Breaking that opens a larger move toward 0.40 macro resistance.
Bearish scenario:
If price fails to hold above 0.05, it could fall back into the previous range, weakening the breakout structure.
Right now, this is a classic accumulation → breakout transition, and momentum is clearly favoring the upside.
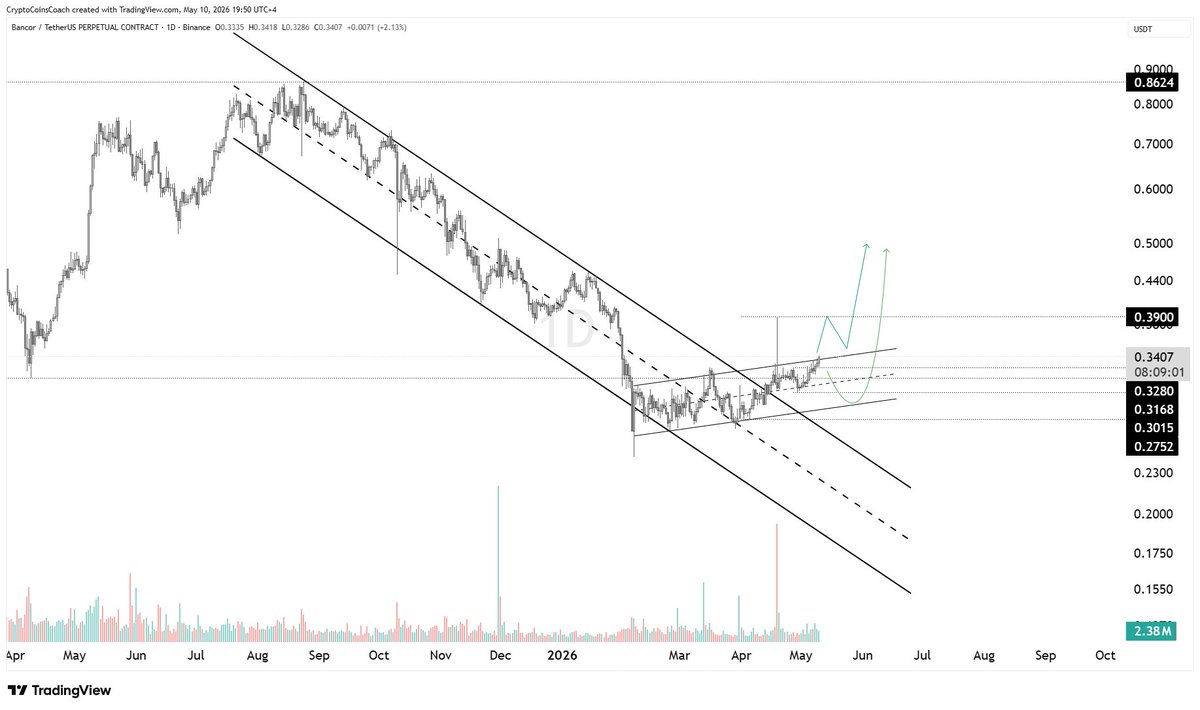
#BNT has been trading inside a clear descending channel for months, but the structure is now shifting.
Price recently broke above the channel resistance and is now consolidating above it, forming a small ascending structure. This is a key transition from bearish control into early bullish momentum.
The current zone around 0.328 – 0.338 is acting as a support flip area after the breakout.
What’s happening:
Downtrend channel is broken
Price holding above previous resistance
Higher lows forming → bullish pressure building
Bullish case:
If BNT holds above this breakout zone, continuation toward 0.39 is likely. A clean push above that level can open the path toward 0.45 – 0.50.
Bearish case:
Losing the 0.32 support would signal a fake breakout and could drag price back into the channel.
Right now, this looks like a classic breakout + retest setup, with momentum slowly building for a move higher.
#BNT #Trading #Crypto #Market
#HEI broke out of a falling wedge 👀
Momentum shifting after months of downtrend.
Now testing 0.10 resistance.
Hold breakout = 0.15 → 0.29 possible 🚀
#HEI#Trading#Crypo#Market#Analysis@Coach
#QTUM is showing its first serious breakout attempt after months inside a major descending channel.
Price has pushed above the local compression range and is now testing the broken structure around 0.91–0.92. This area is important because holding above it would confirm strength and keep the bullish reversal setup alive.
If QTUM holds this zone, the next targets are 1.00 and 1.17. A clean break above 1.17 would open room for a stronger trend shift.
But if price falls back below 0.85, the breakout attempt becomes weak and the broader downtrend can take control again.
Right now, this is a breakout validation zone.
✨Do You Know?
💡 Ethereum began as a gamer’s frustration 🎮
Vitalik Buterin was annoyed that his favorite character in World of Warcraft was nerfed. The feeling of helplessness sparked an idea: build a system where no one could unilaterally change the rules. That spark turned into Ethereum, now powering NFTs, DeFi, and DAOs. What began as a gamer’s gripe transformed into the bedrock of Web3.
🎯 A game glitch led to the decentralized future.
Powered by — https://t.co/jbJfQPFO7V
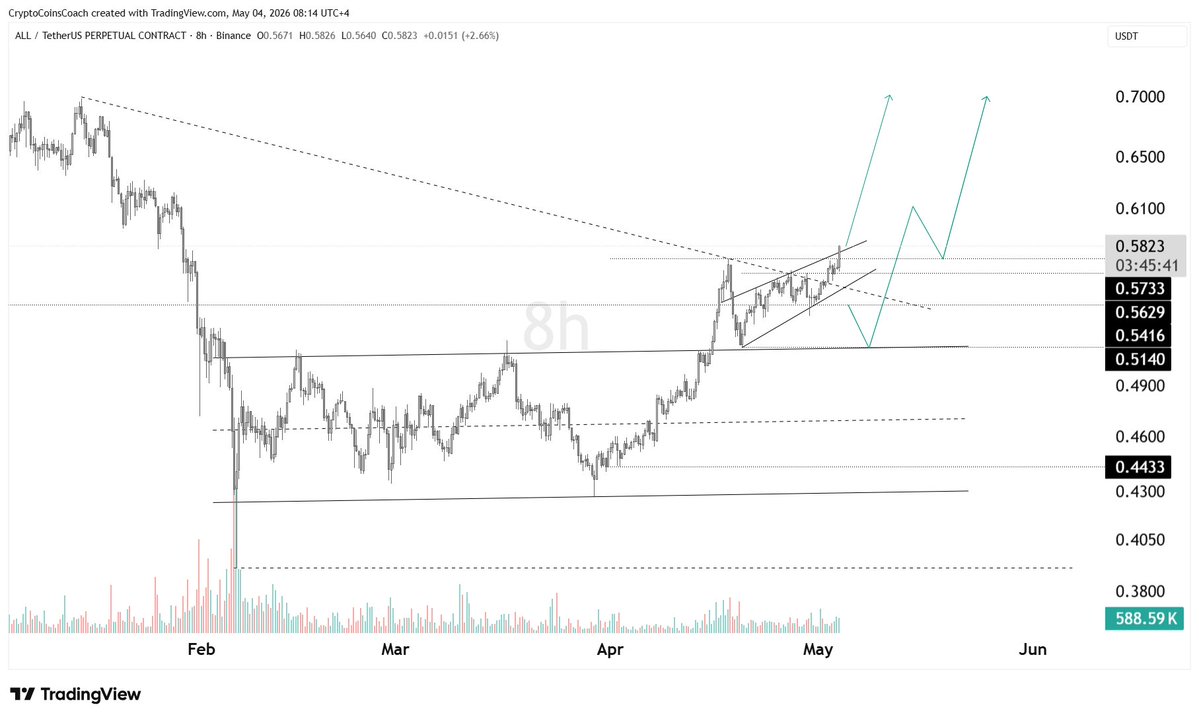
#ALL pushed above the 0.57 resistance and broke out of its local structure, but it’s now sitting right under the higher timeframe descending trendline. This is a key confirmation zone. If price holds above 0.57, we can expect continuation toward 0.62–0.70. But if it drops back below and loses that level, it likely turns into a fake breakout with downside back toward 0.54–0.51.
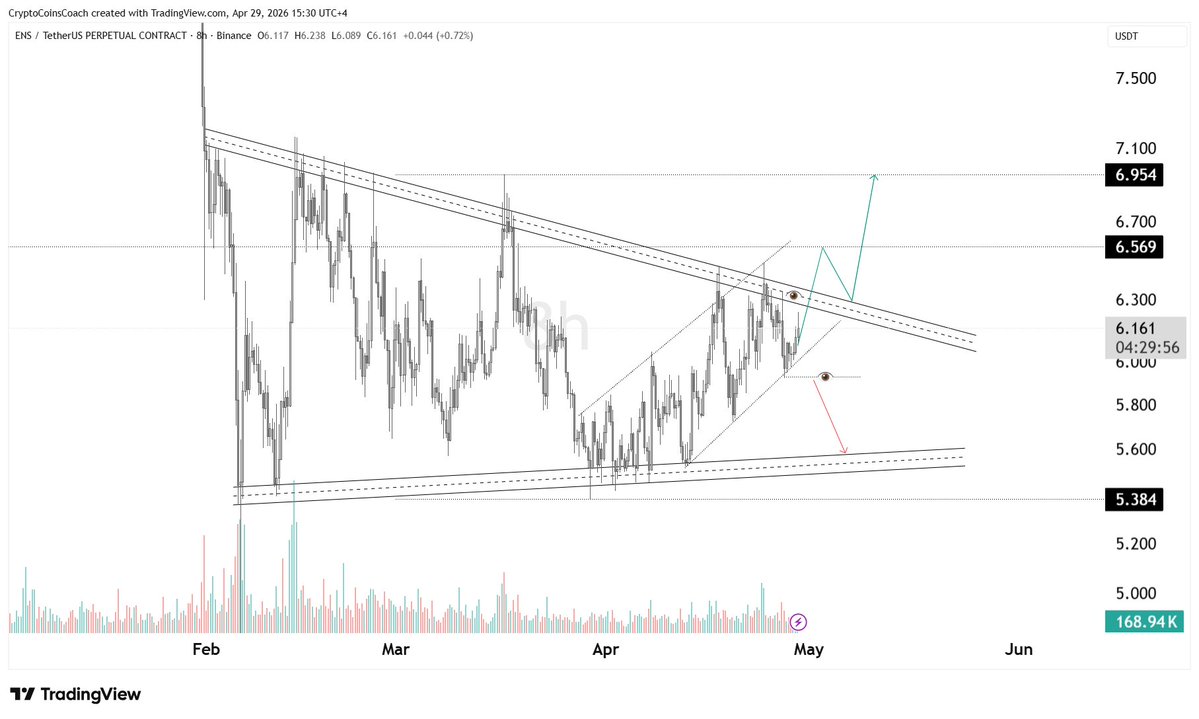
#ENS is moving inside a broad range with a descending top trendline, and recently formed a short-term ascending channel pushing price upward. Now that local structure is running straight into macro resistance, which is the key point here.
What’s happening:
Price respected the range low (~5.3–5.4) multiple times
Built a higher low structure → short-term bullish pressure
But now it’s hitting the descending trendline + horizontal resistance (~6.2–6.5)
So this is a classic trendline compression against HTF resistance.