Why the bottom for $BTC is not in
Bitcoin's Realised Price is the average cost basis for all holders
Currently it is 53.6k
Bitcoin has NEVER bottomed in a cycle without trading below the Realised Price
2011 → BTC bottomed at $2.1, about 58% below the Realised Price of $5
2015 → BTC bottomed at $152, about 49% below the Realised Price of $300
2018 → BTC bottomed at $3.2k, about 47% below the Realised Price of $6k
2022 → BTC bottomed at $15.4k about 34% below the Realised Price of $23.3k
58%, 49%, 47%, 34% – see a pattern forming?
My prediction for the next Bitcoin bottom is the Realised Price minus 20-30%
In other words → 37.5k-42.8k
Bookmark this because I know I'm right
Update: LAB continues market manipulation on CEXs via MM up to $5.7B mkt cap ($14B FDV) at top 22 ranking.
Disappointing to see exchanges allow it to continue as we all know how it ends when the hidden supply unlocks from OTC, private sale, airdrop, etc finally occur since insiders control nearly the entire float.
Just is a question of whether the vesting terms are changed yet again by the team.
Retail traders get baited in due to top CEX listings, trending lists, & high market caps which create the illusion of safety.
As stated before I do not advise trading these types of tokens.
-CLARITY now unlikely to pass next month
-Iran deal isnt real
-Saylor is selling with STRC + MSTR below nav and Saylor's $2b cash buffer is 70% gone on buy backs
-Coinbase premium is grossly negative
-Equities will continue to absorb liquidity from crypto markets as AI/robotics/Space are more exciting than crypto atm
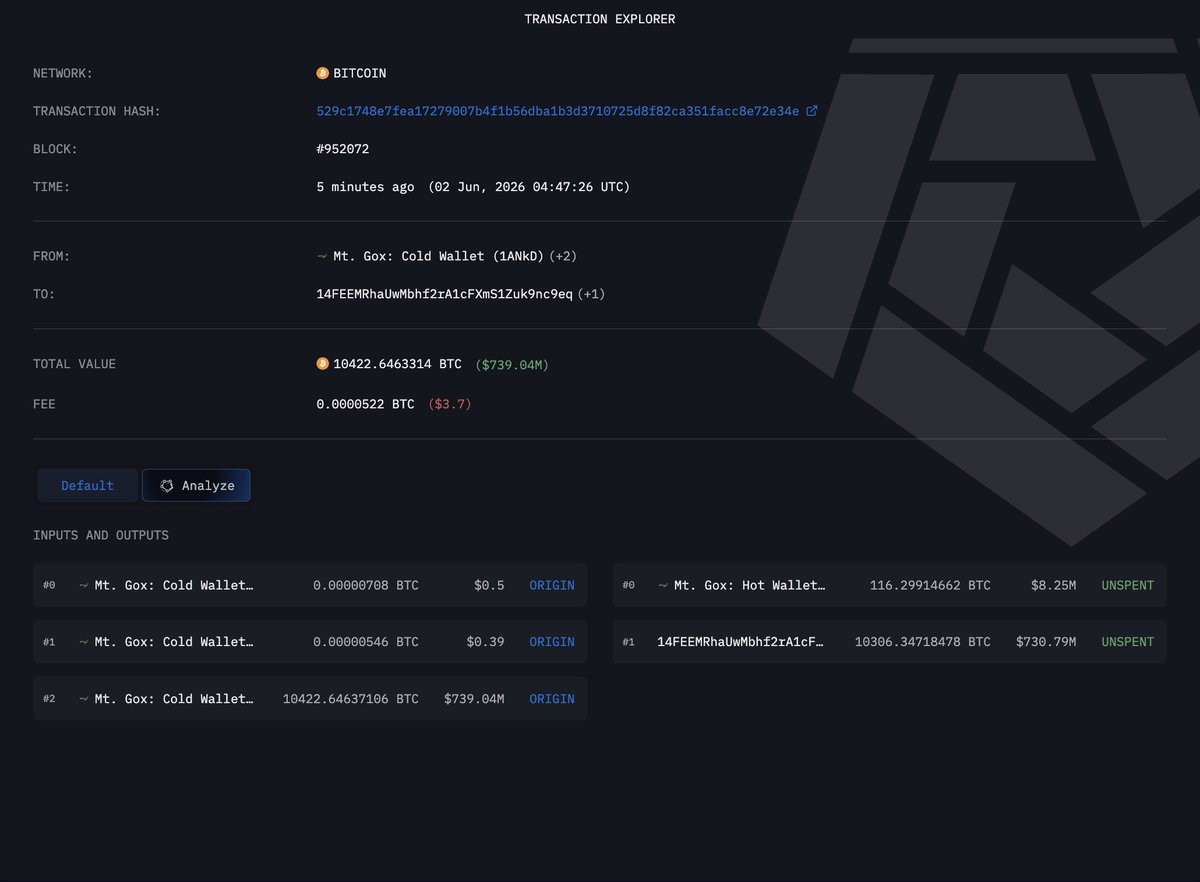
Looks like Michael Saylor’s @Strategy about to sell bitcoin:native
On-chain data shows Strategy deposited 411.48 BTC, worth around $30.3M, into Coinbase Prime.
Evidence: https://t.co/otl6nSyowb
Meanwhile, on @Polymarket odds that MicroStrategy sells BTC before Dec. 31, 2026 have now reached 90%: https://t.co/ckaCR8QvJR
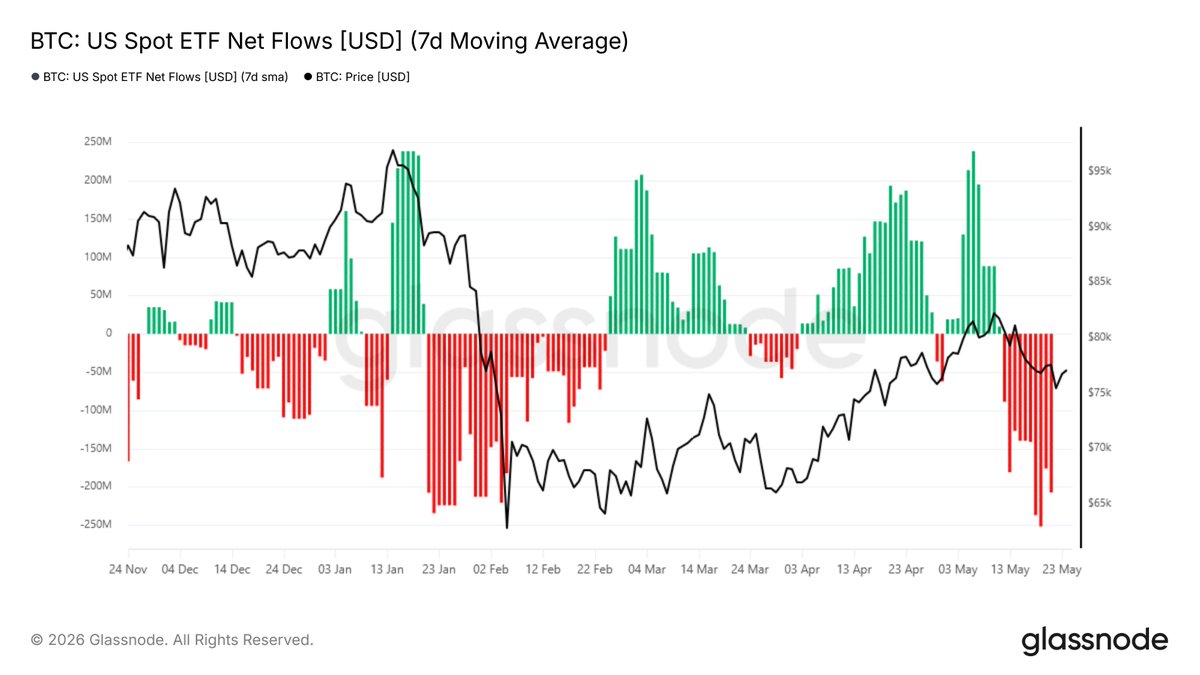
Since May 7, US Spot ETFs have recorded net outflows on nearly every trading day, a persistent institutional sell signal now running for more than two weeks.
This steady drip of outflow continues to add to the supply side without a visible demand offset.
📉https://t.co/jPIsg0lksD
We've been tracking zcash:native since its MVRV crossed back above 1.0. At 1.59 right now with price at $632.88 and realized price at $367.50, here's the exact 6-step framework we use to read this setup:
1. MVRV at 1.59 — the network is in aggregate profit but nowhere near euphoria. Historical ZEC tops printed MVRV above 3.5. We're in the "constructive mid-range" where trends extend, not reverse.
2. NUPL sits in "Optimism" territory — the phase between breakeven and greed. Last time ZEC entered Optimism with this momentum profile, price ran another 40-60% before hitting the Belief/Euphoria transition.
3. Price is +7.19% in 24 hours and trading well above the 200-day moving average. Trend structure is unambiguously bullish on this timeframe.
4. Derivatives confirm the bid: Open Interest rising on both daily and weekly basis. Long/Short ratio at 0.56 with more short liquidations in the last 24h — classic short squeeze mechanics feeding the move.
5. HERE'S THE WARNING SIGN: Active addresses and transaction count dropped sharply on the week. Price is outrunning network activity. This rally is being driven by repricing and derivative flows, not organic usage expansion.
6. The read: when MVRV is constructive but on-chain activity diverges negatively, the move is real but fragile. It continues until leverage gets flushed or usage catches up. We're watching the Active Address trend as the key confirmation/invalidation signal.
Our take: ZEC at 1.59 MVRV with declining on-chain activity is a derivative-led repricing — profitable to ride but dangerous to chase. The move holds as long as OI keeps building. The moment funding flips extreme positive and addresses don't follow, that's your exit signal.
Full ZEC metrics → https://t.co/kceAGxNAc2
How to Track ZCash Transactions
Zcash is a privacy-focused cryptocurrency built on Bitcoin’s codebase, using zk-SNARKs to hide transaction data on-chain.
Our research team wrote a guide on how Zcash works, why most ZEC activity is still traceable, and how to track it with Arkham. Check it out below:
$BTC
Bitcoin formed a local low this week, but the rally so far looks like a 3-wave pattern. That's not enough to get excited about yet.
A break above $78,960 is what's needed to signal this is more than just a wave (4) and that a test of the May highs could follow.
$ZEC
The current rally appears to be the expected fifth wave inside the larger wave C of circle wave B, with the structure still supporting additional upside from current levels.
Leading Scenario: As long as the market remains above the highlighted micro support region between roughly $490 and $451, the structure continues to favor additional upside extension, with the next larger upside target region located near $800.
Risk Scenario: A sustained break below the highlighted support region near $490 would provide the first stronger indication that a larger top may already be forming.
Key Support Levels: $490 / $451
Key Resistance Levels: $556 / $640 / $800
Bottom Line: ZEC still appears to be unfolding the expected fifth wave inside the larger wave C of circle wave B, with the structure allowing for a move toward roughly $800 next. A break below $490 would provide the first stronger warning that a larger top may already be in place.
Bitcoin rejected at the 200-day MA.
The setup mirrors March 2022: a sharp bear market rally into the 200-day MA, followed by rejection and renewed downside.
Historically, failure to reclaim the 200-day MA confirms the bear trend remains intact.
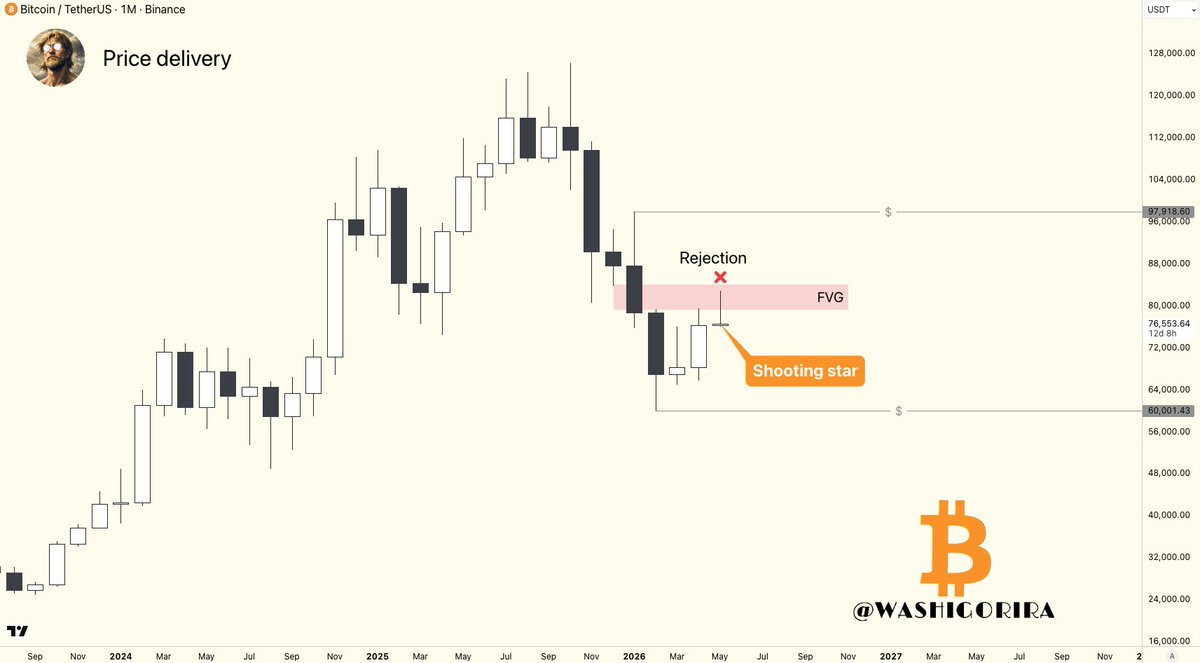
#Bitcoin Monthly warning ⚠️
May candle is shaping up as a shooting star, so far. Buyers got rejected hard at the monthly FVG.
Not a sign of strength.
Still 10 days to go before May ends.
IF it closes like this, June could get ugly.