$BTC Weekly Chart
Looking back on things I kept saying that the RSI downtrend line compared with price was a major warning sign and something to keep an eye on. Well, it has played out.
Where do we go from here? I think we have more downside coming. How much? See my chart. It might be one of those hit 56k and bounce hard from there but IMO, I would take profits quick.
A bounce is coming soon, but how much and can it sustain?
Anything below 56k brings 50k, which to me, is the next support zone.
Good luck all
$BTC Daily Chart
After the huge breakdown, this seems like an area for some consolidation to determine the next move. RSI is getting oversold here, so maybe a bounce is coming soon.
Still a lot of overhead resistance to be cautious of.
My green downtrend line on the RSI has still been the magic indicator for me.
Tip to newbies......higher price and lower indicator is NOT good.
$SPX Daily Chart
This is really starting to remind me of 1999-2000 again. I lived through it. I was told my mentor (stoxx) that the markets are going to keep rising up. He said and I quote "all gaps get filled". I thought he was a crazy old man. Well, low and behold a year later, the markets filled those gaps.
Now, when do these gaps get filled is anyone's guess, but this market feels strange right now.
Let's see what happens, but my guess is that something big is coming. Good or bad, I have no idea.
Be careful and have stops if you are trading out there.
bitcoin:native Daily Chart
The RSI downtrend line has been magical showing the tops on this one.
The pattern here does not bode well for bulls right now. What really needs to happen for them short term is a double bottom. This would most likely be a relief rally IMO.
Next major support if this breaks this area is 55,000. After that, 45,000.
Good luck all
bitcoin:native Daily Chart
We are getting to a crossroads here. Possible 50/200 ma cross coming. Now, what does this mean? Nothing for the next few days. Just something to watch.
Price has held the 78.6/38.2 Fib confluence (very strong support). There is still some Fib confluence support below as well.
Also watching that RSI downtrend line that I have had in place for a very long time.
Hope this helps and good luck.
bitcoin:native
$BTC Daily Chart
Reversing strong off major resistance.
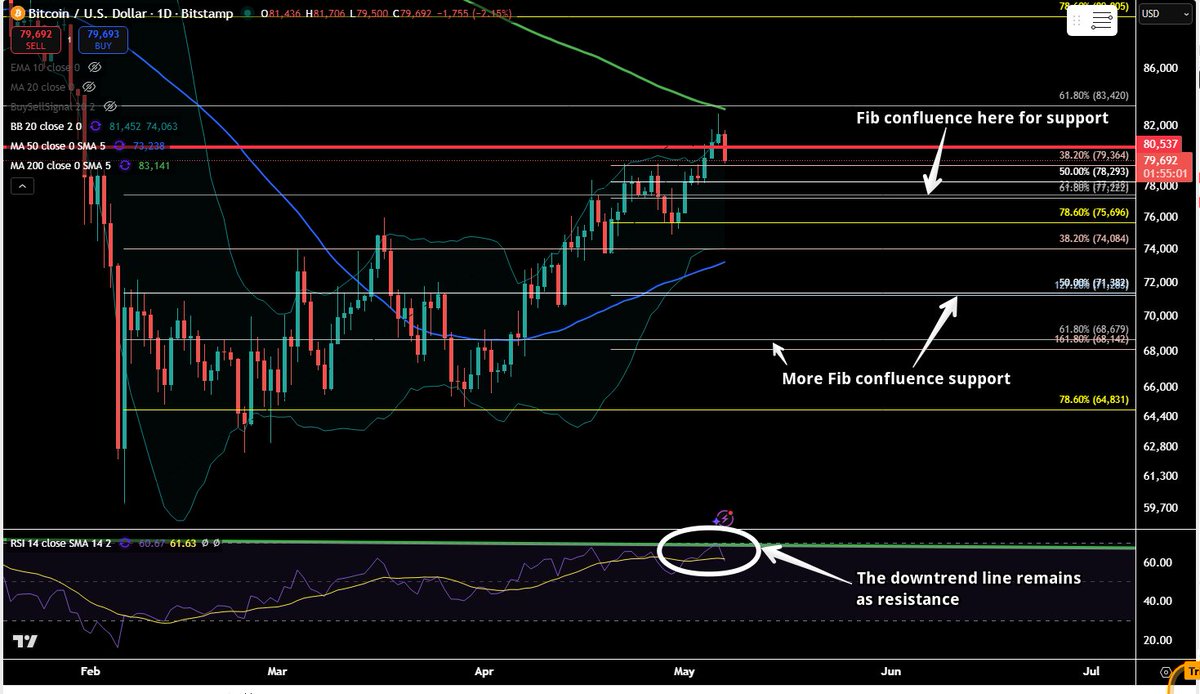
Now we look to support levels. There are quite a few. There is Fib confluence at 77,222 area as well as the 38.2 Fib retrace (which it is testing now). There is also more Fib confluence support just under 72,000.
Please note how the RSI indicator still has not broken the downtrend line. That has been the biggest thing for me so far.
IMO, not a good idea to just "buy the dips". Wait till price confirms on the shorter time frames.
Good luck
#Bitcoin #BTC
$BTC Daily Chart
Please see my previous posts where I called this area as a resistance point.
The key now is to see is old resistance can hold as new support. If not, please see the retracements I have outlined as some support levels.
The downtrend line (divergence) on the RSI is still concerning to me right now and my biggest case for not going full BULL right now.
@CryptoTice_ C'mon man. It is way too early to predict stuff like this.
Here is my take. And I'm not promising the moon or a dump to lows to my friends. Just giving them sound advise from the bull or bear side. All I know is charts.
Crude Oil Weekly Chart
Still looks bullish on the outside looking in. But, my guess is that it goes a lot lower. Or at the minimum it consolidates to the circled area before it decides which direction to go.
The negative divergence on the RSI gives me pause on any further bullish movement.
But, we are in a volatile political environment, so keep your heads up. Major support sits at $80.00
#OILUSD
Crude Oil Weekly Chart
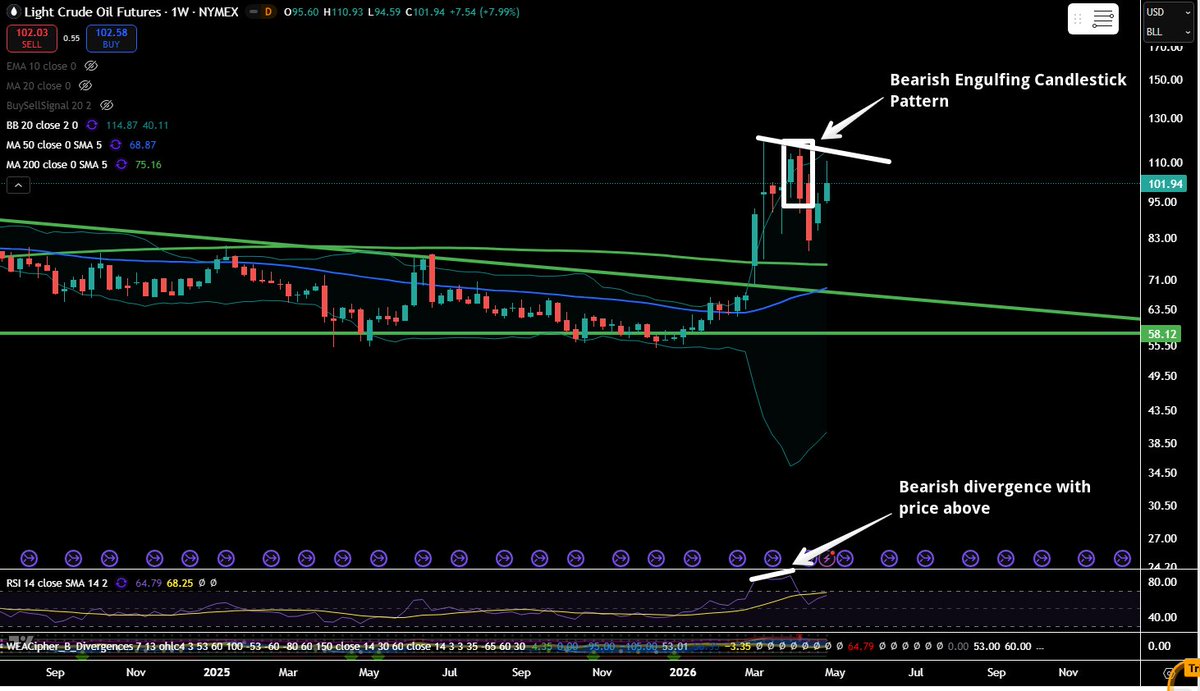
I know everyone is worried about gas prices right now, but this is a chart you should watch.
Please see the bearish engulfing candle pattern I have outlined. Those are usually hard to overcome.
It looks bullish from the outside, but when you break it down, there is a possible divergence developing with the RSI. There actually was a bearish divergence that happened with price. A break above to new highs obviously negates this. I'm looking for lower prices here in the near future.
Bitcoin Daily Chart
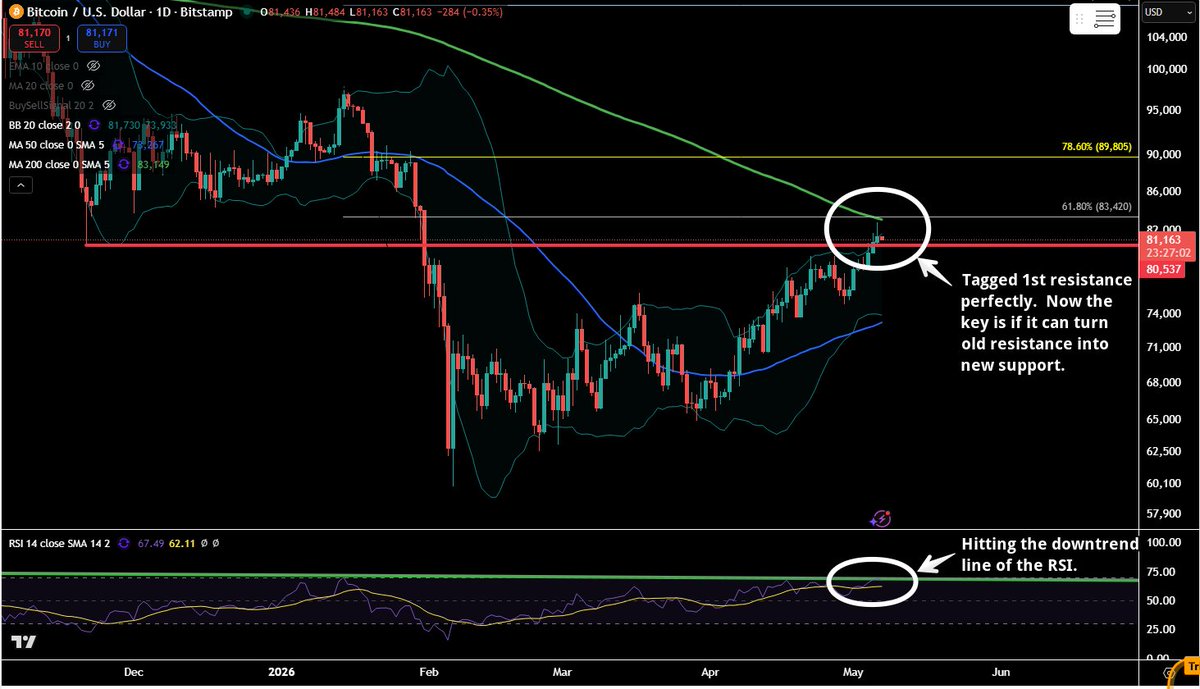
Amazingly enough, price has done what I predicted in previous posts. The key now is if it can hold that old resistance (red line) and make it new support. If it does, it is off to the races.
If it doesn't, we need to be watching for supports down below. Tomorrow, I will draw retracements to the downside, just in case.
My one concern here as I look at both bull and bear sides, is the RSI downtrend line. It is overextended and still has not broke the downtrend line.
Good luck to all.
#Bitcoin #BTC
Bitcoin Daily Chart - Update
So far, it is doing pretty much what I thought. Next step is to see what happens at the 200 dma and 61.8 Fib retrace.
As I said last night, I expect some rejection at the 200dma/61.8 Fib, but it doesn't always have to hit the "exact" number, just so everyone is aware. Be on alert and have stops, just in case.
If the 61.8 Fib retrace breaks, your next target is the 78.6 at $89,805.
Safe trading everyone!
Bitcoin Daily Chart
Pretty impressive day for Bitcoin today. The key going forward is if it can break the red line resistance and then hold it as new support.
It would almost make perfect sense for it to break right above and test the 61.8 Fib retrace and also the 200 dma then come down and retest that red line. I'm also still watching the RSI to see if it can break that downtrend line as well.
Let's see what happens.
Bitcoin Daily Chart
Pretty impressive day for Bitcoin today. The key going forward is if it can break the red line resistance and then hold it as new support.
It would almost make perfect sense for it to break right above and test the 61.8 Fib retrace and also the 200 dma then come down and retest that red line. I'm also still watching the RSI to see if it can break that downtrend line as well.
Let's see what happens.
Crude Oil Weekly Chart
I know everyone is worried about gas prices right now, but this is a chart you should watch.
Please see the bearish engulfing candle pattern I have outlined. Those are usually hard to overcome.
It looks bullish from the outside, but when you break it down, there is a possible divergence developing with the RSI. There actually was a bearish divergence that happened with price. A break above to new highs obviously negates this. I'm looking for lower prices here in the near future.
DOGEUSD Weekly Chart
The old cult favorite. Showing signs of life here with a rounding bottom.
If you are the risky type, I would recommend having a stop just under the lows I have outlined and taking some off the table at the 200 dma (green line) at .13. If it gains strength, look at the Fib retrace lines. The 23.6 Fib is at .1757, etc.
For the record folks, I do NOT own any of these altcoins, so there is nothing in it for me. I just love looking at charts. If I do buy something, I will disclose it.
One thing I'm noticing as I go through these altcoin charts is that most look like they are trying to bottom and establish a bottom. That does NOT mean the bottom is and it does NOT mean they go to the moon tomorrow. When dealing in the markets, most people do not have the patience. Define your strategy and decide if you are a swing trader, day trader and adjust from there.
But, if they can establish and hold a base at support levels, it is a good sign and an area where people can start taking positions slowly, IMO.
LINKUSD Weekly Chart
This one is showing some relative strength now.
The key is to hold that uptrend line and low from early in the year.
Bollinger Bands are working on getting tighter. Still think this one takes a while to get going.