Futures trader focused on capturing volatility. I trade price action, not predictions. Markets can move both ways, so I look for opportunities in rising and fal
SOL/USDT Perpetual — 1-hour chart
The immediate bias is bearish, but price has just reached a support zone, so opening a SHORT here could expose the trade to a temporary rebound.
Immediate support: approximately 114.8–115.3. The current price in the screenshot is around 115.27. Watch for the 1-hour candle to close below the zone; a brief wick under it alone is less convincing.
Nearby resistance: approximately 116.0–116.8, then 117. The 119–120 area is a more significant resistance zone, while 121–122 remains the swing-high area.
RSI 14: 36.68: momentum is weak, but RSI is not yet below 30. A rebound is possible; RSI alone does not confirm a trend reversal.
TP levels shown: TP1 around 111.8, TP2 around 109.6, and TP3 around 105.6. These are indicator projections, not guaranteed targets. TP3 is particularly far away and should not be treated as a certain forecast.
Scenarios to watch
Further downside: A clear 1-hour close below 114.8–115, followed by a failed retest, would support bearish continuation. The indicator’s TP1 could then be a level to watch, not a guaranteed target.
Rebound: If price recovers 116.8–117 and holds above it, immediate bearish pressure would weaken. The next areas to monitor would be around 119–120. A more convincing structural shift would require reclaiming 120–121, rather than just one green candle.
#SOLUSDT #TechnicalAnalysis #CryptoTrading #BearishBias #SupportAndResistance
BTCUSDT Technical Analysis | 4H
BTC is trading near $85,897 after a strong recovery from the $76,000 area. The chart shows a short-term range after the rally, with price moving between roughly $83,000 and $87,200. The latest candle is pulling back from the upper part of that range.
Key levels
Resistance: $86,400–$87,200
Near support: $84,800–$85,000
Stronger support: $83,800–$84,000
Lower support: $82,500–$83,000
RSI is 59.46, neutral but leaning toward positive momentum. MACD is above zero, suggesting the recovery still has some momentum, though resistance has not been cleared.
A sustained 4H close above $87,200 would strengthen the bullish continuation case. Rejection there followed by a break below $84,800 would increase the chance of a move toward $84,000, then $83,000.
Bias: Neutral to slightly bullish while BTC holds above $84,800, but it remains range-bound until resistance breaks.
#BitcoinAnalysis #CryptoTrading #PriceActionTrading #SupportResistance #TradingView #MarketOutlook #RiskManagement
bitcoin:native
SOLUSDT Technical Analysis | 4H
SOL is trading near $120.69 after recovering from around $100 and reaching a recent high near $124. Price is now consolidating, with the short-term structure neutral to slightly bullish.
Key levels
Resistance: $121.50–$122.20
Major resistance: $123–$124
Near support: $119–$120
Stronger support: $116.50–$117.20
RSI is 52.89, indicating neutral momentum. MACD is slightly positive, but does not yet show strong upside acceleration.
A sustained 4H close above $122.20 could open a retest of $123–$124. If SOL remains between $119 and $122.20, consolidation may continue. A 4H close below $119 would weaken the structure and put $116.50–$117.20 in focus.
Bias: Neutral to slightly bullish while price holds above $119, but a clear breakout is still needed for stronger upside confirmation.
#Solana #CryptoTrading #Altcoins #PriceActionTrading #ChartAnalysis #MarketOutlook #RiskManagement
Hype usd
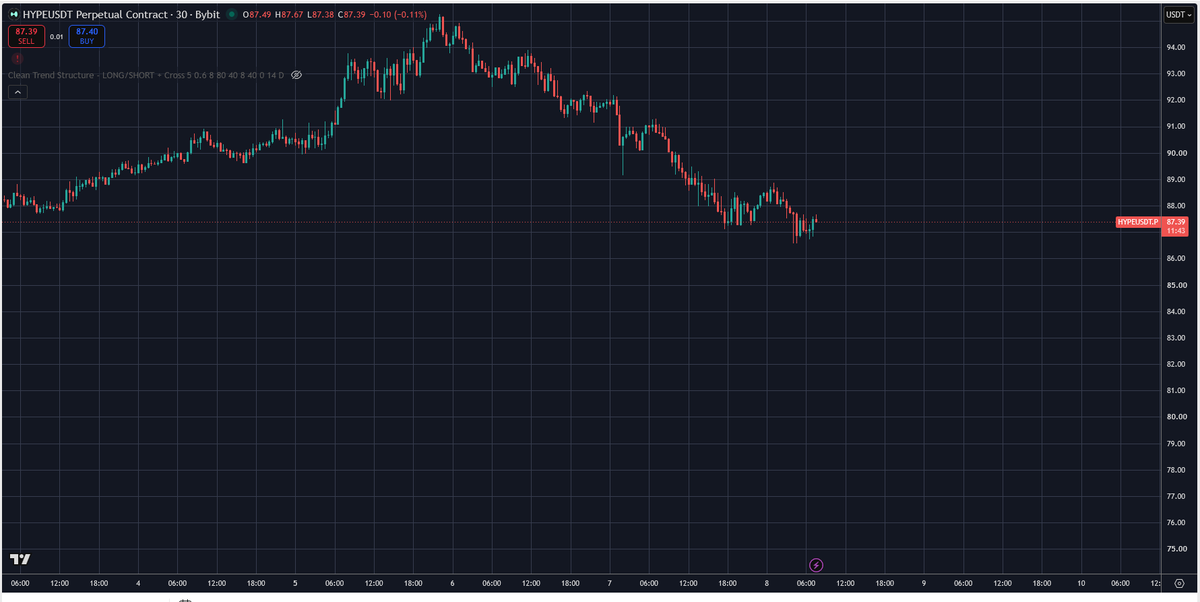
The chart is showing a clear bearish structure after a failed recovery. The key support zone is around 87.90–87.00. If price breaks and closes below this area, the bearish scenario becomes much more credible.
The market is currently in a validation phase. I am not calling a full reversal just because the price has made a local top; I am focusing on structure. A valid bearish continuation requires:
a clean break below support
rejection on retest
continued downside pressure
no reclaim of the broken zone
Key levels:
Resistance: 90.00–91.00
Support: 87.90–87.00
Bearish targets: 84.00, 82.00, 80.00
The most important thing is that the breakdown below support must be respected. If the price falls under 87.90 and holds there as resistance, the downside move has a strong technical case.
Short setup:
Entry: after breakdown and failed retest
Stop loss: above 90.00
TP1: 84.00
TP2: 82.00
TP3: 80.00
This is a structural short, not a random bearish opinion. The market only confirms the move when support breaks and stays broken.
#Crypto #CryptoTrading #TechnicalAnalysis #MarketStructure #Breakdown #SupportBreak #Bearish #ShortSetup
z cash
Bearish structure is becoming more relevant if price breaks below the key support zone around 1,280 and keeps closing under it. This is the critical level that defines whether the recent recovery remains valid or fails.
Short entry:
after confirmed breakdown below 1,280
or on a failed retest back into the broken support
ideal entry zone: around 1,260–1,270
Stop loss:
above 1,300–1,320
Target levels:
TP1: 1,200
TP2: 1,100
TP3: 1,000
This is a structural short, not a random bearish idea. The breakdown of support is the trigger. If the level holds as resistance after retest, downside continuation becomes much more likely.
#TradingView #MarketStructure #SupportResistance #BreakdownTrading #Short
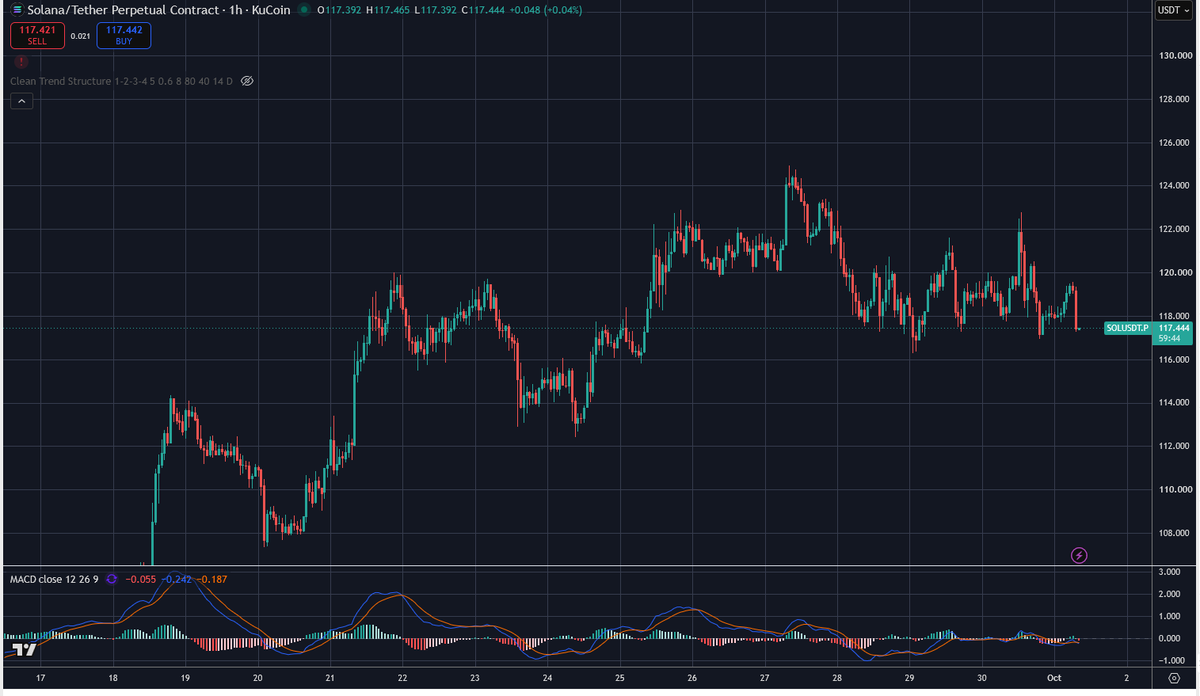
SOLUSDT Perpetual | KuCoin | 1H
Price in the screenshot: approximately 117.70 USDT.
Market Structure
SOL has been making lower swing highs since rejecting the 124–125 area. Recently, price has mostly ranged between 117 and 120, with a sharp spike toward 122.7 that was quickly sold off. The latest 1H candle is strongly bearish and has brought price back to the lower edge of that range.
RSI is 43.18, neutral with a slight bearish tilt. MACD is close to zero, so momentum is weak and doesn’t yet confirm a strong reversal.
Key support: 117.0–116.8
Nearby resistance: 119.2–120.0
Higher resistance: 120.7, 121.7, 122.7
LONG Scenario
Confirmation: 1H close above 120.0, followed by a successful retest of 119.5–120.0.
Invalidation: price closes below 118.7 after the retest.
TP1: 120.7
TP2: 121.7
TP3: 122.7
SHORT Scenario
Confirmation: 1H close below 116.8, followed by a failed attempt to reclaim 116.8–117.3.
Invalidation: price reclaims and closes above 118.0.
TP1: 114.7
TP2: 113.5
TP3: 112.7, near the prior swing-low area.
Conclusion: SOL is testing support, so shorting immediately risks entering right above a potential bounce zone. I’d wait for a confirmed break below 116.8 for the short scenario, or a reclaim above 120.0 for the long scenario. Levels are approximate and based on the screenshot.
#Solana #SOL #SOLUSDT #CryptoTrading #TechnicalAnalysis #PriceAction #Altcoins #Bybit #Perpetuals #Trading
BTCUSDT Perpetual | Bybit | 1H
Price shown: approximately 83,485 USDT.
Market Structure
After rallying toward 87,000, BTC formed lower swing highs and moved into consolidation. The latest spike toward 85,500–85,600 was rejected sharply, bringing price back below 84,500. Short-term pressure remains slightly bearish.
RSI is 45.89, neutral with a mild bearish tilt. MACD is close to zero, suggesting weak momentum and no strong directional confirmation.
Key range: approximately 82,700–84,500. Price is currently inside this range, so there is no clear entry signal at this level.
LONG Setup
Confirmation: 1H close above 84,500–84,700, preferably followed by a successful retest.
Invalidation: price falls back below 83,900 after the breakout.
TP1: 85,050
TP2: 85,500–85,650
TP3: around 86,000, only if price breaks decisively above the rejection zone.
SHORT Setup
Confirmation: clear rejection from 84,400–84,700, followed by a move back below 84,000.
Invalidation: 1H close above 85,100.
TP1: 83,500
TP2: 82,900
TP3: 82,600, near the recent support zone.
Conclusion: At 83,485, BTC is in the middle of its range, so the risk/reward for an immediate entry is unattractive. Watch for a confirmed breakout above 84,500–84,700 for the bullish setup, or a rejection from that zone for the bearish setup. Levels are approximate and based only on the screenshot.
#Bitcoin #BTC #BTCUSDT #CryptoTrading #TechnicalAnalysis #PriceAction #TradingView #Bybit #CryptoMarkets #FuturesTrading #RiskManagement
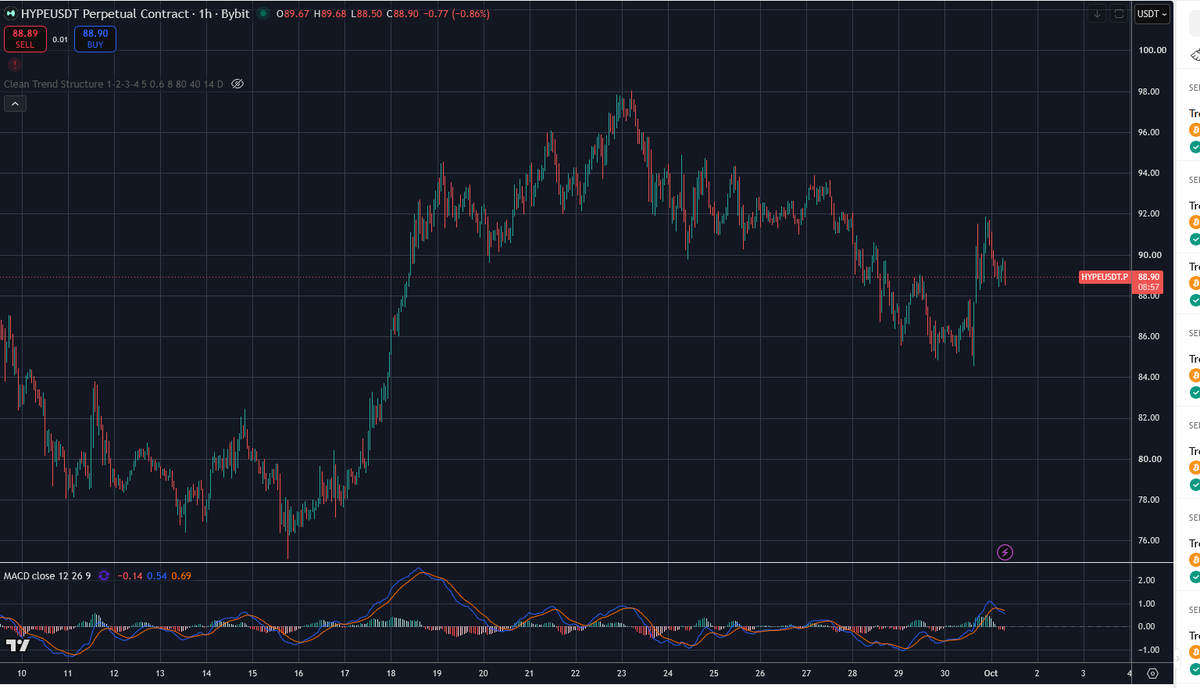
The price in the screenshot is approximately 88.89. After rising from around 85 to 92, it was rejected and entered a correction. RSI is neutral near 51, while MACD suggests that bullish momentum is weakening.
The 88.40–89.70 range is the decision zone. As long as price stays within it, direction remains unconfirmed.
LONG Scenario
Confirmation: 1H candle closes above 89.70, ideally followed by a successful retest.
Invalidation: 1H candle closes below 88.35.
TP1: 91.00–91.20
TP2: 91.80–92.10
TP3: around 93.00, only if price breaks convincingly above 92.
With an entry near 89.70, TP1 offers an approximate 1:1 risk/reward ratio; TP2 offers around 1.6–1.8:1.
SHORT Scenario
Confirmation: 1H candle closes below 88.40, followed by a failed retest of 88.40–88.90.
Invalidation: price recovers and closes above 89.70 on the 1H chart.
TP1: around 86.50
TP2: 85.00–85.20
TP3: around 84.60
Conclusion: Wait for confirmation outside the 88.40–89.70 range. A break above favors the bullish scenario; a break below favors the bearish one. These levels are approximate and based only on the screenshot.
#HYPEUSDT #CryptoTrading #TechnicalAnalysis #PriceAction #Hyperliquid #RiskManagement
BTC: $82,500 Is the Most Important Level to Watch
BTC is trading around $83.3K after being rejected from the $84.4K–$84.8K resistance zone. Price is consolidating near support, while RSI around 45 reflects neutral-to-soft momentum.
Bullish scenario: A 1H close above $83.8K, followed by a reclaim of $84.3K–$84.5K, would improve the short-term structure.
TP1: $84.8K
TP2: $85.2K
TP3: $86.4K
Bearish scenario: $82,500 is the key level to watch. A confirmed 1H close below it would weaken the structure and bring these downside targets into focus:
TP1: $82.2K
TP2: $81.3K
TP3: $80.5K
Until BTC reclaims resistance, the rebound remains unconfirmed. Let price action around $82,500 define the next move.
#BTC #Bitcoin #Crypto #TechnicalAnalysis #MarketStructure #PriceAction #CryptoTrading #RiskManagement
SOL/USDT | 1H
SOL is trading near $118.35 after a sharp rejection from the $124–125 area. The rebound from around $116 has yet to confirm a bullish reversal. RSI is near 47, while MACD remains below zero, though selling pressure may be easing.
Bullish scenario: A 1H close above $119.6 would be the first recovery signal. Holding above $120.7–$121.2 would strengthen the setup.
TP1: $120.7–$121.2
TP2: ~$123.3
TP3: $124.5–$125.0
Bearish scenario: A close below $117.2 would put $116.2–$116.4 support back in focus. A confirmed break below that zone could open the way toward:
TP1: ~$115.3
TP2: ~$113.7
TP3: ~$111.9
For now, the short-term structure remains cautious until SOL reclaims $119.4–$121.2. $116.2–$116.4 is the key support zone. These are conditional chart levels, not guaranteed outcomes.
#SOL #Solana #Crypto #TechnicalAnalysis #MarketStructure #PriceAction #CryptoTrading #RiskManagement
HYPEUSDT | 1H Technical Analysis
HYPE is trading around 87.61 after a strong rejection from the 96–98 zone. Price has broken below nearby support, and the current move looks like a short-term rebound rather than a confirmed bullish reversal.
Momentum: RSI is approximately 44.7, below the neutral 50 level. MACD remains below zero, although selling pressure may be easing.
Key levels
Immediate resistance: 88.6–89.3
Next resistance: 90.5–91.0
Major resistance: 93.5–94.0
Nearby support: 86.8–87.0
Recent swing support: 85.5–86.0
If that support breaks, watch approximately 84.5, 82.5, and 80.5
Bearish scenario: Rejection from 88.6–89.3, followed by a 1H close below 86.8, would keep downside pressure in play and could lead to a retest of 85.5–86.0. A confirmed close below that zone would strengthen the bearish continuation case.
Recovery scenario: A 1H close above 89.3 would be the first sign of improving momentum. Reclaiming and holding 90.5–91.0 would provide stronger confirmation of a recovery toward 92–94.
Bottom line: The short-term bias remains cautious to bearish until price reclaims 88.6–89.3. The immediate support zones to watch are 86.8–87.0 and 85.5–86.0. Levels are approximate and based on the chart provided, not live market data.
#HYPE #HYPEUSDT #Crypto #TechnicalAnalysis #MarketStructure #PriceAction #CryptoTrading #RiskManagement
9:08 AM
6s
HYPEUSDT 4H Technical Analysis
HYPE is trading around 88.8 after a strong rejection from the 93.5–94.0 resistance zone. The short-term structure remains bearish, with selling pressure still active.
Momentum
RSI: approximately 36.4, showing bearish pressure without extreme oversold conditions.
MACD: negative, confirming weakening momentum.
Key levels
Immediate resistance: 90.0–91.0
Major resistance: 92.3–92.8
Higher resistance: 93.8–94.0
Immediate support: 88.0
Lower supports: 86.6 and 85.0
Bearish scenario: If price remains below 90.0–91.0 and loses 88.0, downside targets are:
TP1: 88.0
TP2: 86.6
TP3: 85.0
A confirmed 4H close below 88.0 would increase the probability of further downside.
Bullish scenario: For a recovery, HYPE needs to reclaim the 90.0–91.0 zone:
TP1: 92.3
TP2: 93.0
TP3: 93.8–94.0
A strong 4H close above 94.0 would improve the structure and could open the way toward 95.0–96.0.
Conclusion: The bias remains bearish while HYPE trades below 90.0–91.0. The 88.0 level is the key support to watch.
Below 88.0: bearish continuation
Between 88.0 and 91.0: decision zone
Above 91.0: potential recovery
Above 94.0: stronger bullish confirmation
#HYPE #HYPEUSDT #Crypto #CryptoTrading #TechnicalAnalysis #MarketStructure #PriceAction #Trading #Altcoins #RiskManagement
SOL/USDT Technical Analysis, 2H
SOL is trading around 122.98 in the chart. The broader 2H structure remains constructive, but price was rejected near 124.3–124.5 and is now pulling back. The reaction at support will be key.
Momentum
RSI is around 59.8, positive but not overbought.
MACD remains slightly positive, though momentum has cooled after the recent rally.
Key levels
Near-term resistance: 123.2–123.5
Major resistance: 124.3–124.5
Immediate support: 121.75–122.0
Lower supports: 119.8–120.0, then around 119.5
Bullish scenario: If 121.75–122.0 holds and price reclaims 123.2–123.5, SOL could retest 124.3–124.5. A 2H close above that resistance would strengthen the continuation setup.
TP1: 125.2
TP2: 126.3
TP3: 127.4
Bearish scenario: A 2H close below 121.75–122.0 would weaken the structure and could open a move toward:
TP1: 120.0
TP2: 119.5
TP3: 118.0
For now, this looks like a pullback within a still-constructive structure, not a confirmed reversal. 121.75–122.0 is the immediate decision zone.
#SOL #Solana #Crypto #TechnicalAnalysis #MarketStructure #Trading
$USDT.D remains in a constructive structure as long as it holds above the key support zone around $6.30–$6.35. This is the level that keeps the bullish continuation intact.
If buyers maintain control and push through the next resistance around $6.50–$6.55, the upside targets are:
TP1: $6.60
TP2: $6.75
TP3: $6.80+
On the other hand, if price loses the $6.30–$6.35 support and closes below it, the structure weakens and downside targets become:
TP1: $6.20
TP2: $6.10
TP3: $5.90–$5.80
This is a classic market structure setup:
support holds = continuation
support breaks = sentiment turns risk-off
In simple terms, a rising USDT dominance usually signals that capital is rotating back into stablecoins, which often puts pressure on risk assets like BTC and alts.
#USDT #Crypto #Bitcoin #MarketStructure #TechnicalAnalysis #Trading #RiskOn #RiskOff #Macro #CryptoMarket
bitcoin:native remains structurally constructive as long as it holds above the key support band around $80K–$81K. The current market is defining itself by level retention rather than narrative, and that is the framework we should respect.
If buyers continue to defend this zone and reclaim momentum through the $84.5K–$85K area, the next upside objectives are:
TP1: $88K
TP2: $90K
TP3: $92K–$95K
However, if price loses the $80K–$81K support and closes below it, the bias shifts quickly:
TP1 downside: $78K–$79K
TP2 downside: $75K–$76K
TP3 downside: $72K–$73K
This is a classic structure-driven setup:
support holds = continuation
support fails = sentiment changes
resistance is where conviction gets tested
The important point is that the market is still rewarding clean structure, confirmation, and disciplined execution — not hype.
#BTC #Bitcoin #Crypto #CryptoTrading #MarketStructure #TechnicalAnalysis #Trading #Macro #RiskManagement #Bullish #Bearis bitcoin:native
solana:So11111111111111111111111111111111111111112 is currently trading around 116.2 and is sitting right on the key support zone between 116.0–116.3.
If this level holds, the bullish structure remains intact and the next upside targets are:
TP1: 118.0
TP2: 119.0
TP3: 121.0
However, if price loses this support and closes below 116.0, the next downside support area becomes 114.5–115.0, followed by 112.5–113.0.
This is a classic structure-based setup:
support holds = continuation bias
support breaks = shift in sentiment
118–119 remains the key resistance zone to watch
The market is driven by levels, confirmation, and risk control — not hype.
#Crypto #SOL #TechnicalAnalysis #Trading #MarketStructure #RiskManagement
solana:So11111111111111111111111111111111111111112