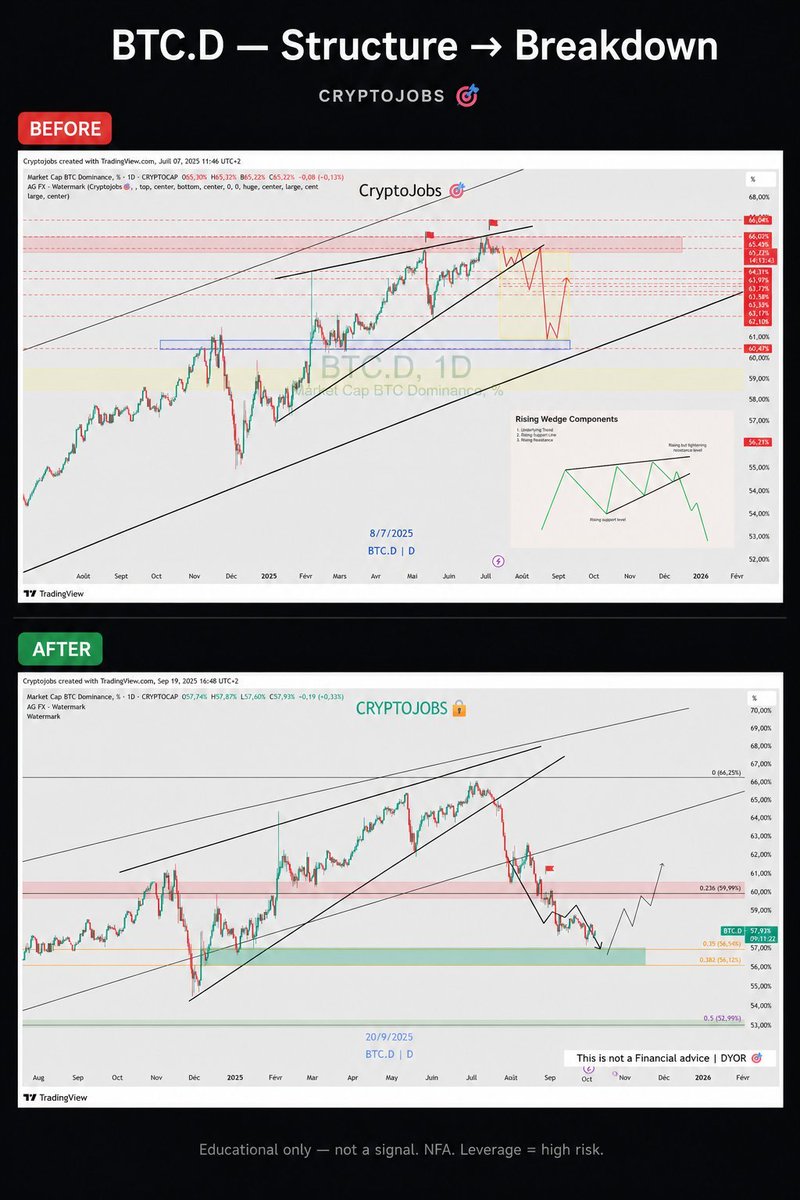
BTC.D rising wedge → breakdown. Called on the chart.
Ichimoku + market structure since 2017.
Binance Top 20 Creator. Public TA is free.
Follow if you trade structure.
Reply “MAP” for the free hub. 👇
Educational only. NFA. DYOR.
Im out of bitcoin:native
Previous setup invalidated. I accept losses RN.
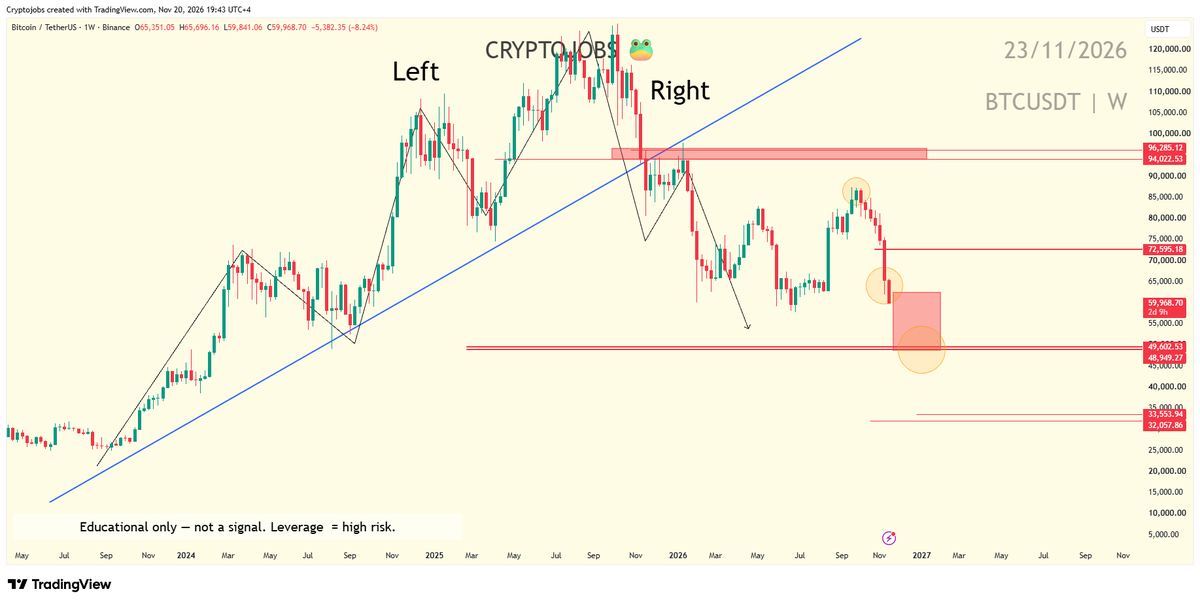
Looks like a 🚨crash toward 52k - 48k could come if we don't see any bull reaction at 60ki!
Cautious with leverage. Don't gamble at the opposite of the main momentum with high funds. NFA. 🚨
#BTC
Market bleeding. Is the bottom in, or will $BTC dump toward 60K? 🔴
Live today at 15:00 UTC: key levels and swing strategy on $BTC, step by step.
Drop your coin in the chat and I check it live 👇
Educational only, NFA. https://t.co/WcFgsAkyXB
@Cointelegraph "Just above" is about 16% here. Glassnode puts realized price near $53,500 with $BTC around $61,900, and the June low at $58,500 sits in between. Lose that floor and the average holder test gets real.
Market bleeding. Is the bitcoin:native bottom in, or do we dump toward 60K?
I go live today at 15:00 UTC.
Key levels, swing plan, and your coins checked live.
Drop your ticker below 👇
https://t.co/WcFgsAl6N9
@Cointelegraph Worth noting: that record is a Sept 30 snapshot. At $61,900 the same 356,491 BTC is worth about $22B. Advisors hold 40.5% of it, per Galaxy. If that slow money sits through Q4, $BTC has a sturdier base than price shows.
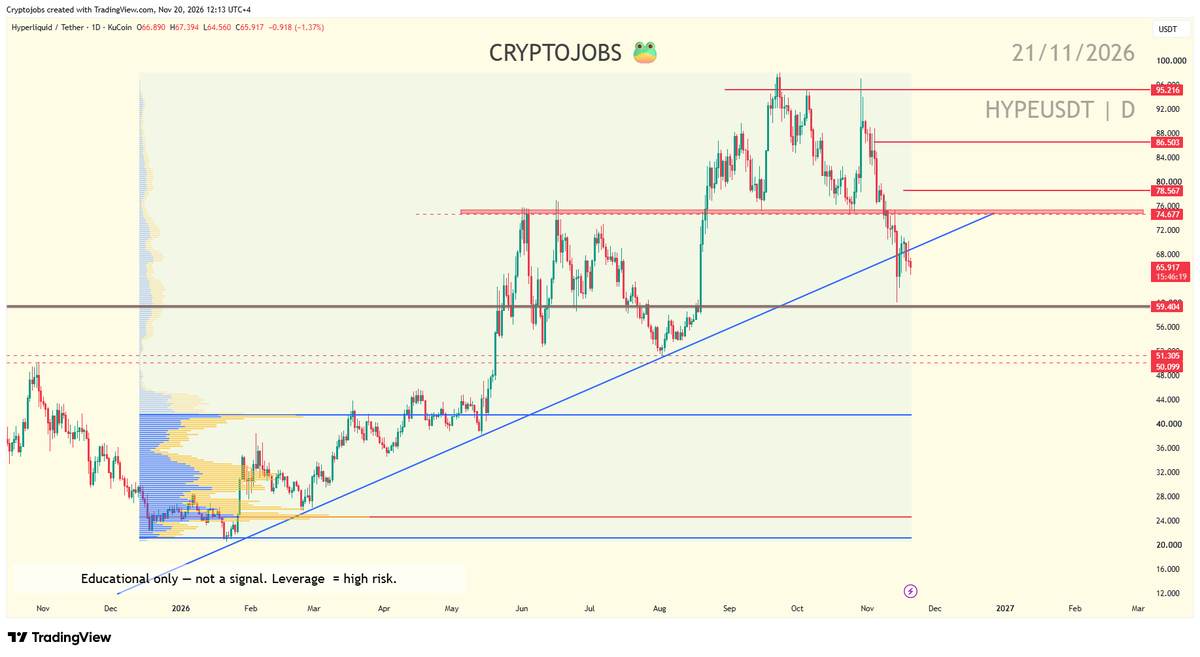
hyperliquid:native analysis
H1: sideways phase between 70.50 and 64.70.
Lower support: 62.30 zone and LL at 60.00.
Higher timeframe: bias remains bearish under the 75.00 area, previous key support.
If 59.50 doesn't hold, 50.00 to 48.00 could be next (weekly SSB).
To sum up: bearish correction ongoing on the weekly, a new low looks likely next.
Bulls must clear and push above 75 then 80.0.
As long as the weekly low at 60.00 holds, we could see another bull wave.
My take: a correction looks likely next. Above the LL, the 75 to 78 area could be seen.
Short term: sideways.
near:native update: same outlook.
Daily remains pretty bearish under the downtrend, especially the 3.480 to 3.500 mark.
Key demand zone I see: 2.450 to 2.400. Hard to say yet if bulls react above the previous weekly low.
If the double bottom holds and BTC reacts, we could see a solid bull reversal.
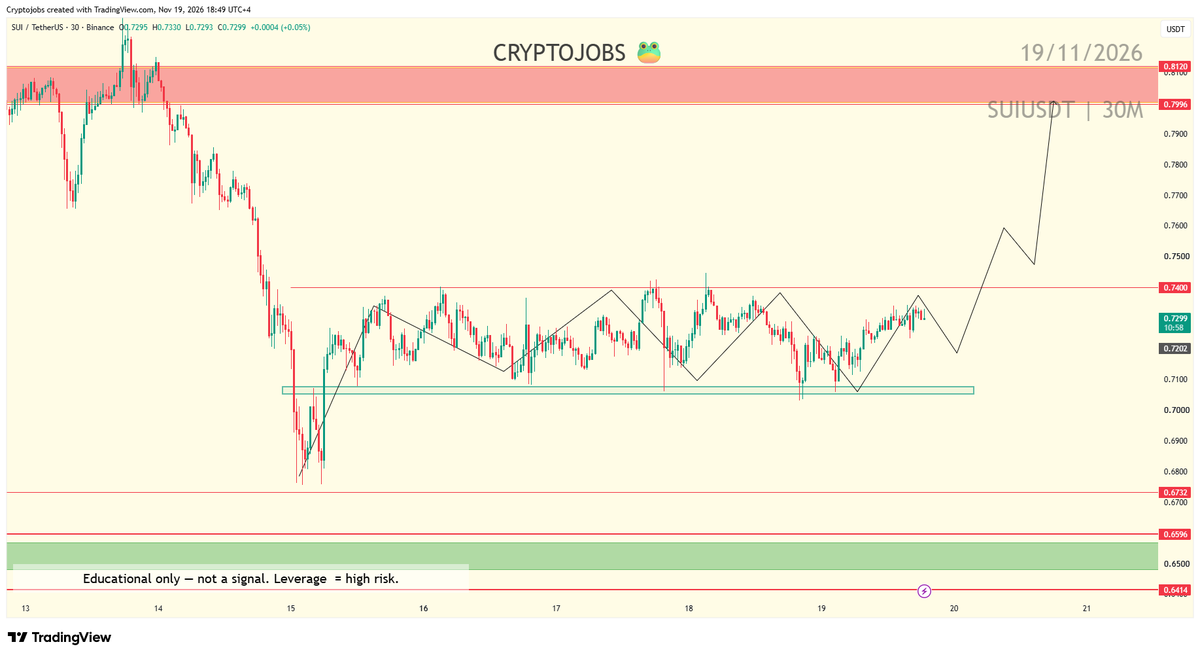
Levels and possible view in the chart 📊
Chart request time 📊
For the next 1.5 hours I'm reviewing your charts.
Drop your ticker and timeframe in the comments, I'll share my view on the structure and key levels.
Coming up: LIVE tomorrow at 13:00 UTC.
Which chart do you want me to look at first?
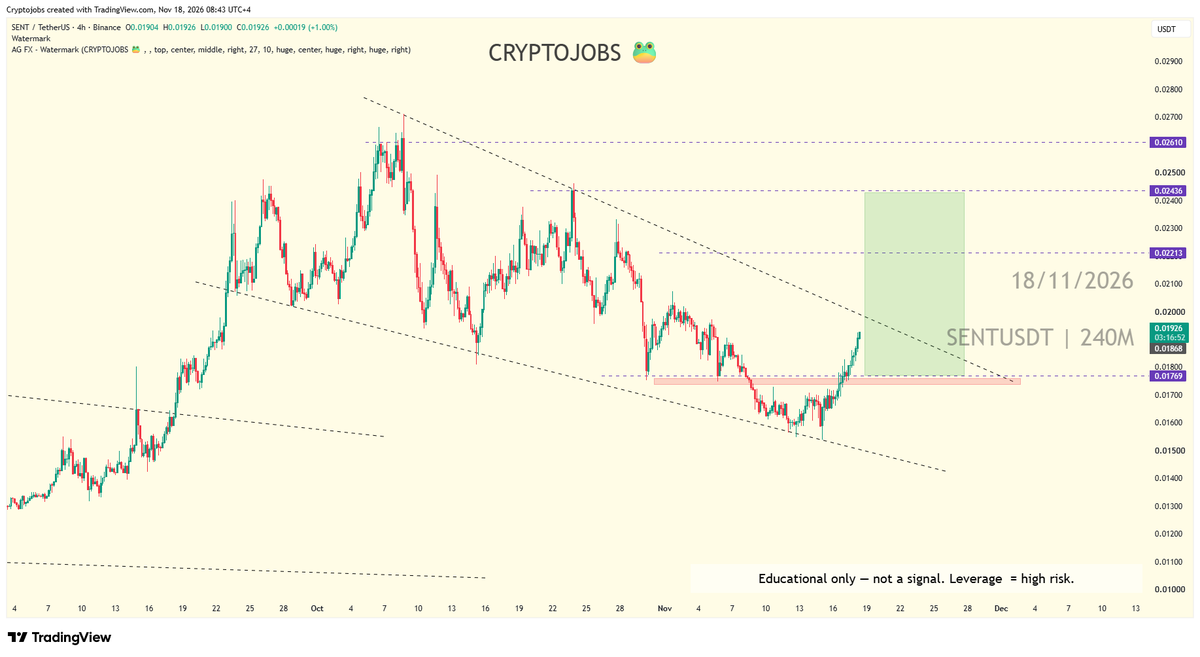
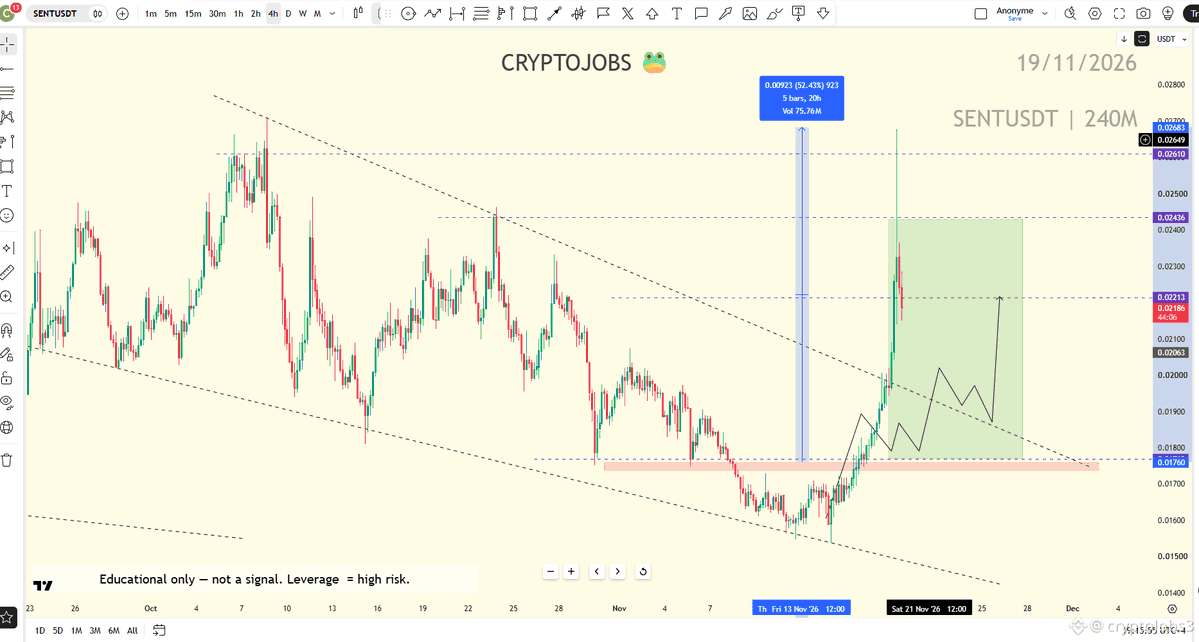
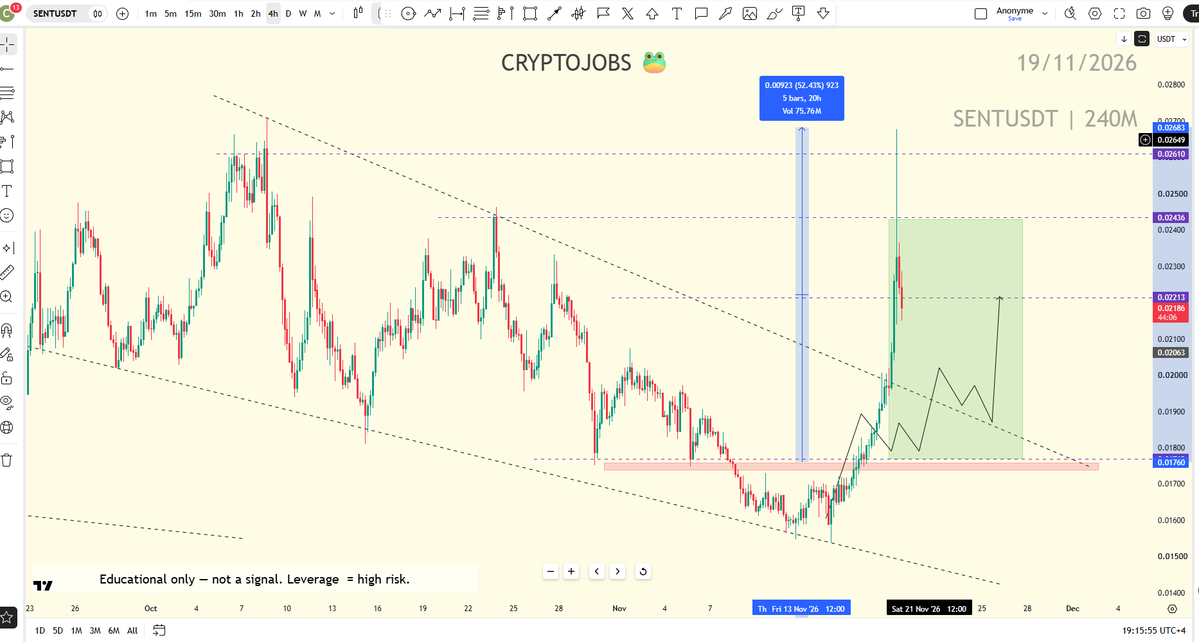
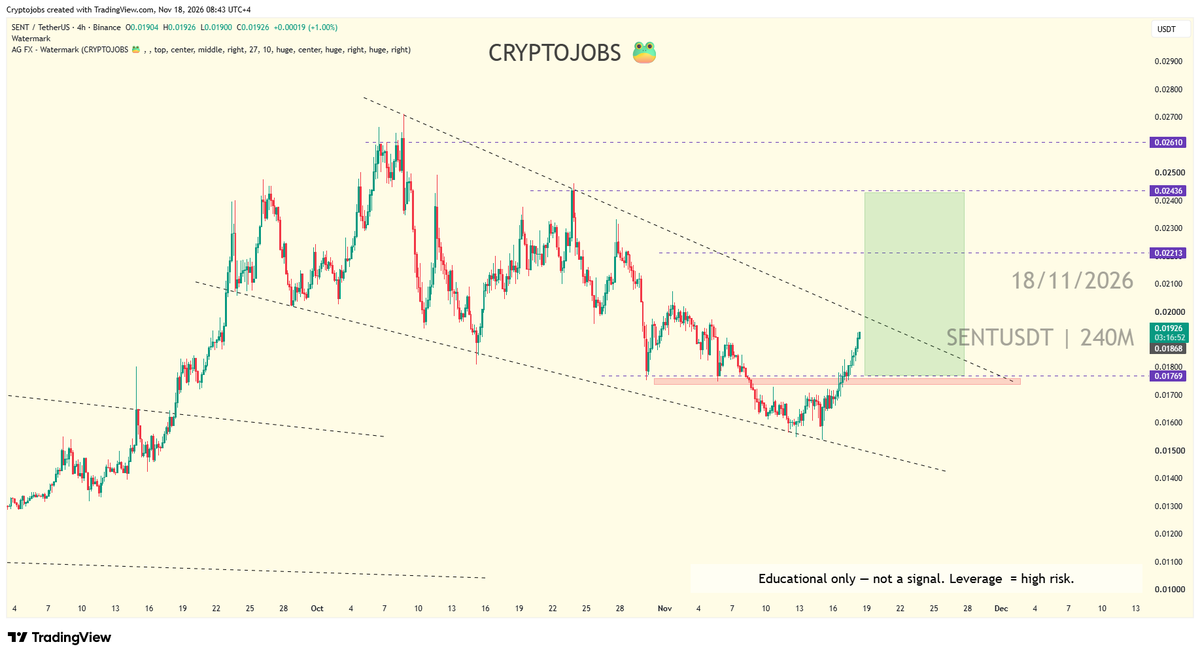
This ethereum:0x56a3ba04e95d34268a19b2a4474dc979babdaf76 setup was shared in the group on 18/11, before the breakout.
Members had the entry zone, the targets and the invalidation on the chart.
Today all 3 targets were tagged.
Setups like this go to the group first.
Free group: reply "MAP" 👇
VIP: full setups, live updates and early entries.
Educational only. NFA. DYOR.
BTC.D rising wedge → breakdown. Called on the chart.
Ichimoku + market structure since 2017.
Binance Top 20 Creator. Public TA is free.
Follow if you trade structure.
Reply “MAP” for the free hub. 👇
Educational only. NFA. DYOR.
It looks like bull reversal is in for ethereum:0x56a3ba04e95d34268a19b2a4474dc979babdaf76
A clean break and consolidation above 0.01930 (current resistance), could lead to a strong buy volume inflow 📈
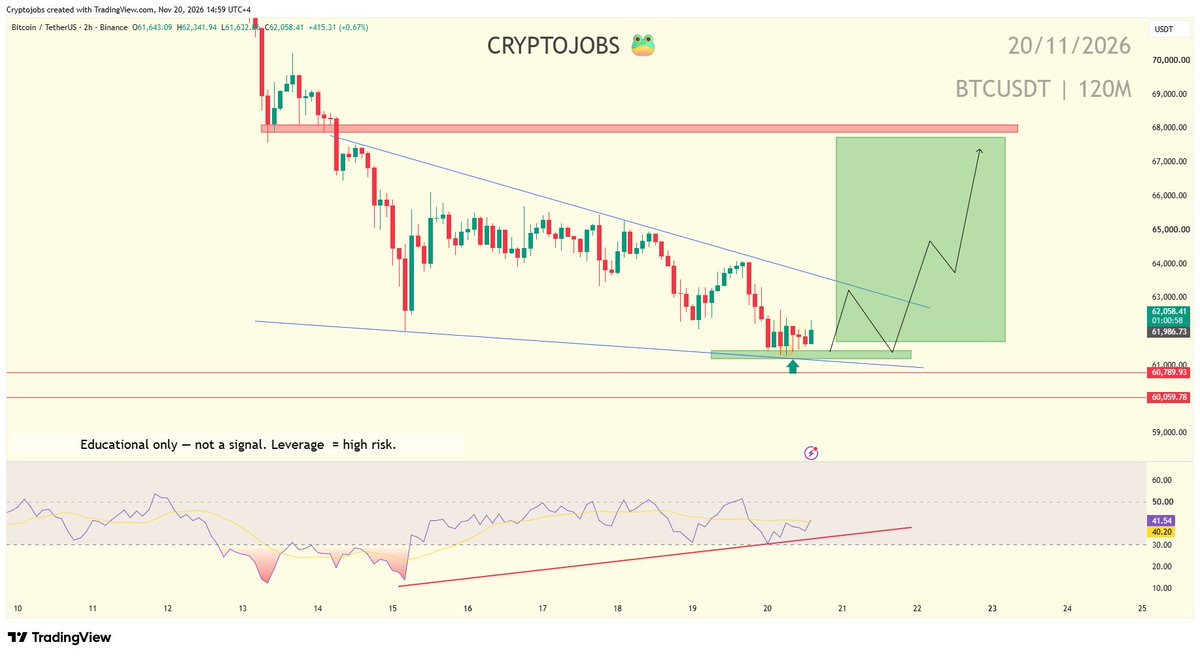
bitcoin:native hit my TP2. Same I remain bullish above LL. 62,000 = key level I mentionned weeks ago.
For my bull correction toward 68,000, even 70,000 make sense.
Then we could see a bearish trend continuation and new low toward 60,000.
High risk, NFA