$BTC downtrend continues.
Today's weekly candle close will be the lowest of this bear market and the MACD will print a bearish crossover. (pending)
Signaling, the bottom is not in.
KRİPTODA BÜYÜK OLAY..!
Bu son üç kez olduğunda, Bitcoin patlama yaptı.
2012 → 15$ 'dan 1k$'a
2016 → 400$ 'dan 20k$'a
2020 → 9k$ 'dan 69k$'a
BUGÜN PARABOLİK BİR YÜKSELİŞE BAŞLIYORUZ..! 🚀
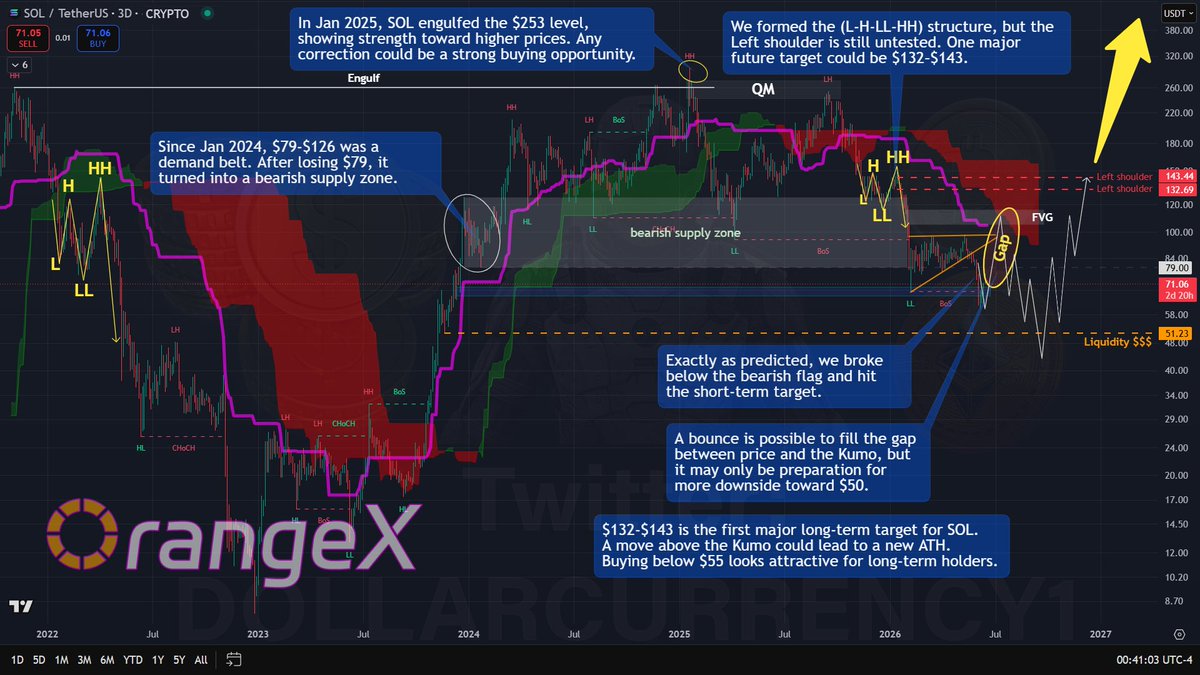
$SOL below $55 remains my favorite long-term accumulation zone.
My first target is $132-$143, and a Kumo breakout could open the door to a new ATH. 🚀
Sign Up For https://t.co/GYMKKFfWO8 Get Up To 5,940 USDT:
https://t.co/rihm5vYY0y
#SOL
EVERYONE IS BEARISH ON BITCOIN AND CRYPTO RIGHT NOW.
THIS IS THE PERFECT TIME FOR BITCOIN TO GO PARABOLIC.
SILVER PUMPED 600% AFTER ITS FINAL CAPITULATION.
IMAGINE WHAT BITCOIN WILL DO.
A PARABOLIC MOVE IS STARTING SOON.
WE WILL SEE ALL PRICES 5X FROM NOW
GIGA BULLISH
Bitcoin just touched the Rainbow ALL IN ZONE.
2018:
All in zone.
5x rally.
2020:
All in zone.
22x rally.
2023:
All in Zone.
8x rally.
2026:
All in zone.
4x rally ?
Scale in here. Go heavier deeper.
$BTC's Daily RSI level is yet again at an area where it has coincided with many of the previous bottoming regions.
It got here quickly due to the relentless and quick sell off we've seen the past 2 weeks with yesterday and today being down -10% alone.
Keep in mind, these are no guaranteed signals or anything. Often price hovers around this area or sweeps the low again taking the liquidity.
But these levels do generally mean it is worth it to start paying attention again.