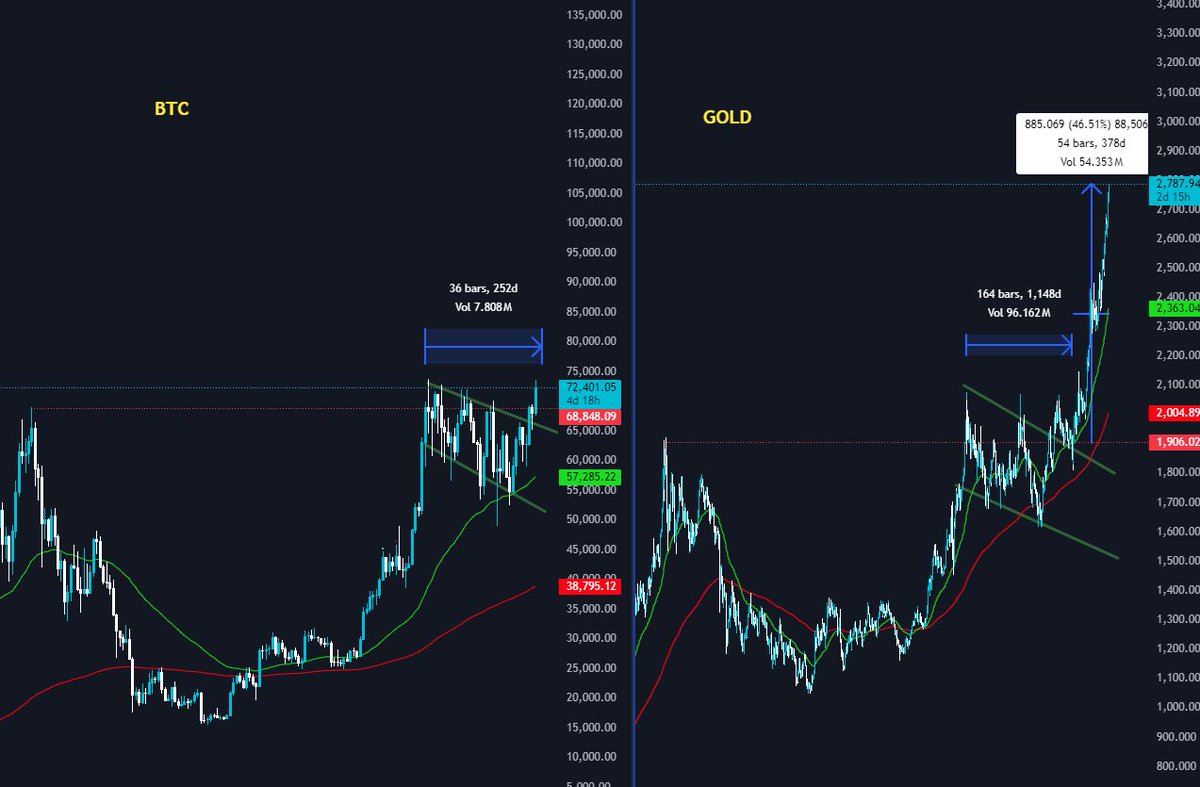
#btc and #gold side by side
both store of value assets
one digital one physical
both the same chart structure
#bitcoins futures is written in golds chart and its very bullish
LINK — the $8.268 level called weeks ago is being tested right now. 🙈
Hold it → range stays intact, $7.144 is the floor
Lose it → $7.144 next, and in the current bear market $5.689 becomes a real possibility
Still ranging between $7.144 and $10.859 — 113 days and counting.
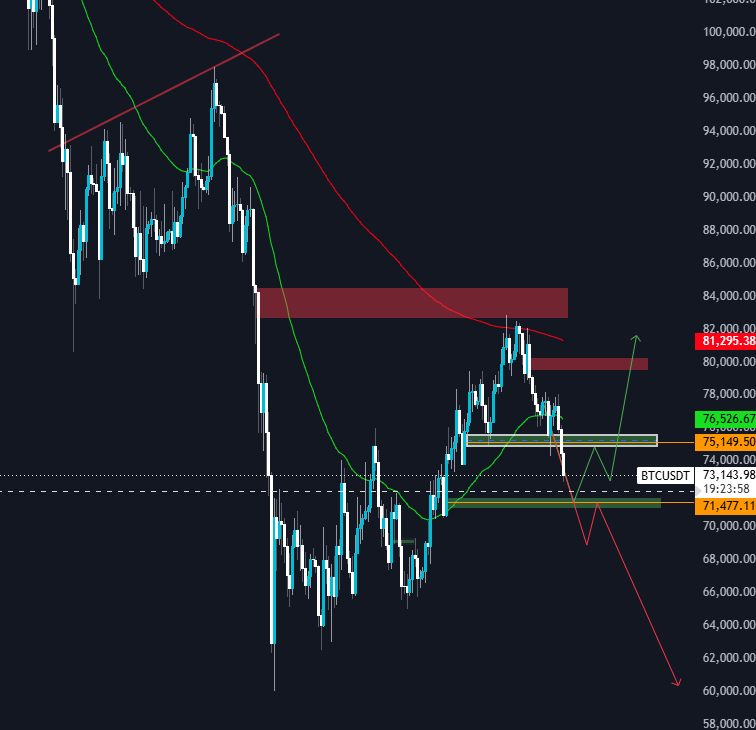
$BTC holding above $73K — but the structure remains bearish.
Most likely scenario: a move toward $71,477 before any real recovery.
Two levels bulls need to reclaim:
📍 $76K — first resistance
📍 $78,787 — confirms recovery
Below both — still bearish. No bulls confirmed yet.
Watching closely. 👀
$LINK couldn't hold the support zone. Fast drop to $8.80. 📉
Next level to watch: $8.268
Lose that → $7.144 bottom of the range comes into play
The bigger picture: LINK has been ranging for 113 days between $7.144 and $10.859.
No breakout yet — and it doesn't look like one is coming anytime soon.
Range is the game until price proves otherwise. 👀
BTC at strong support at the daily chart
If we don't stay above the $75'500 we will continue to go down towards $71k
Staying above will bring us back to $80k
$LINK bounced from the expected support zone. 🎯
Now pushing toward the $10.30 resistance.
This is the level that matters next.
Break and hold above $10.30 → very bullish signal, $10.86 and beyond opens up
Rejection here → back to consolidation in the $9.60 range
$11.293 would be next resistance at 200 EMA(red line)