I talk about funding all the time, so it's about time I explain it for you guys.
Like + Bookmark this to come back to it later. (repost it if you want bonus points :) )
To monitor funding: https://t.co/NEniatwxBi
Funding is a peer to peer mechanism to keep the price of the perpertual future price close to the spot price.
In traditional finance, futures trading is used in commodity trading to lock in prices to hedge against unforeseen problems and they usually have a date that you have to close the trade by. (quarterly is the most common.)
In crypto, 'futures' are perpetual, meaning there is no end date that you have to close the trade and they can stay open indefinitely, but the way that they work is through this peer to peer funding mechanism. (the exchange only makes money on market buys/sells (a taker fee) and NOT on the perp trading funding.
It's a ratio of longs to shorts and when the ratio of longs is higher, they pay funding (positive in red) to the short traders and when the ratio of shorts is higher, they pay a funding fee (negative in green) to the long traders.
In parabolic bull markets, this funding rate can get very extreme as long traders are a much higher ratio and on leverage, but this sets up for a 'long liquidation' and the same is also true when shorts get over confident they set themselves up with a 'short squeeze' to the upside.
A neutral funding rate is .01.
Funding is paid every 8 hours on some exchanges and every 24 hour hours on other exchanges.
The higher the funding rate, the more likely a leverage flush is, because leverage traders can't sustain the constant fees unless price is moving to cover the cost.
A common practice in bull markets is to take a 1:1 delta neutral hedge where you buy X amount in spot and short X amount on perpetual futures. This allows you to be hedged where you collect the funding rate, which can get anywhere from 20-70% per year in returns and is the basis of Ethena's protocol.
Currently, funding is COMPLETELY flat, which is great for bulls if we can continue our march higher. It means that we won't see another leverage reset for a while and it allows prices to continue to grind higher.
In fact, some of our favorite assets are starting to trend negative, meaning there are more shorts than longs, which means that we've got fuel to move higher if we can break key resistances.
Overall, use funding as a metric for a traffic light. The more red = the more likely a sell off is coming. Usually this ranges from .7-.9% in daily funding.
Sometimes, funding can be skewed with VC unlocks coming on a coin where someone knows big selling is coming so they hedge out their position with a big short and funding can be negative for a while until the selling is completed. (this is only learned with experience.)
- Fibonacci levels / extra insights -
I want to spend a "few" words on this fantastic tool adding more thoughts on it.
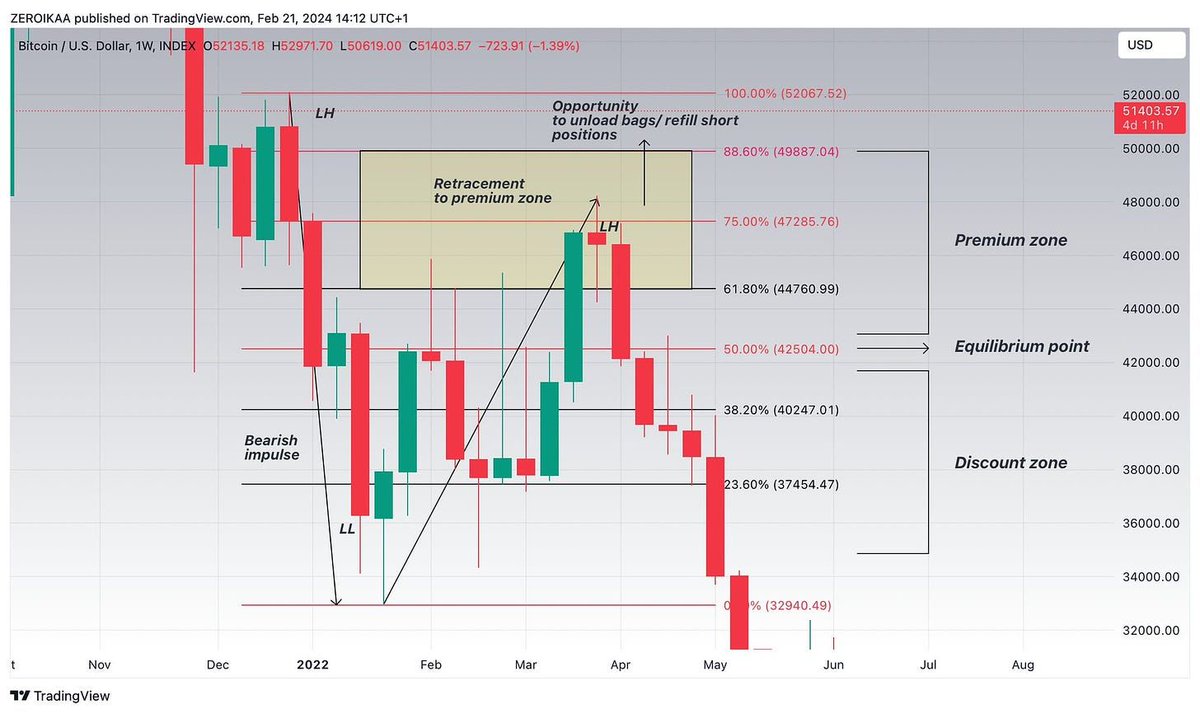
Starting quickly with the basics, the primary function of this tool isn't so much to determine where the price might go (though that is a secondary objective), but rather to identify the most interesting zones for buying and selling.
In this context, the key concept to understand is the division that emerges using Fibonacci levels: premium, equilibrium, and discount.
Essentially, for less experienced users:
- Below 0.5 Fibonacci -> Discount levels -> SM are more interested in buying.
- Above 0.5 Fibonacci -> Premium levels -> SM are more interested in selling.
- At 0.5 -> SM have less interest in buying or selling at an intermediate price.
This is an essential yet often overlooked aspect, and it's the reason why the majority of investors get caught off guard: they buy at premium levels and sell at discount levels, it's that simple.
However, I’m not here to repeat well-worn concepts, but rather to share my experience and provide an explanation of these numbers from an "operational" perspective.
Fib numbers:
- 0.236
- 0.382
- 0.5
- 0.618
- 0.786
- 0.705
The 0.236 and the 0.382 are the "weakest ones" and while they're present in the classic sequence, they usually don't offer significant pullback areas where to put your eyes on, that's why I rarely use them as confluence.
The 0.5 is the equilibrium and while many people put their attention to other levels, there's a reason why this is called "equilibrium", and is because it represents the midpoint of a price move, (50%) acting as a balance point between buying and selling forces in the market.
Do not underestimate this level, it is one of the most important numbers of the sequence, if not the most important.
The 0.618 instead is one of the most "looked" ones because of the GP but this doesn't make it less reliable and constitutes a solid fib level.
The 0.786 is the "deep retracement" based on the fact that the price has retraced 78.6% of the initial move, representing the "final chance" for the trend to hold before reversal.
Between these 2, there's the 0.705 which is pretty uncommon and, at the same time, interesting.
The 0.705 Fib level is in fact called "algorithmic fib" as most institutional traders and HFT algorithms set entries and exits based on this number often front-running those who wait for the 0.618 or the 0.786, that's why is highly sensitive to price action. (Chris Lori perfectly explains it if you're interested)
Remember that Fibonacci levels alone matter but they don't matter at the same time.
If they don't match significant liquidity areas is not very wise to long/short exclusively depending on the "raw number", otherwise everyone would be rich, don't you think?
Use Fib numbers as confluence: no confluence, no valid trade.
👁️Extra:
When I look for retracements, I have a "personal box preference" with these settings: (88.60/75/61.80).
This is an extra setup that often helps me to individuate an "ideal zone" on pullbacks as you can see from the example above.
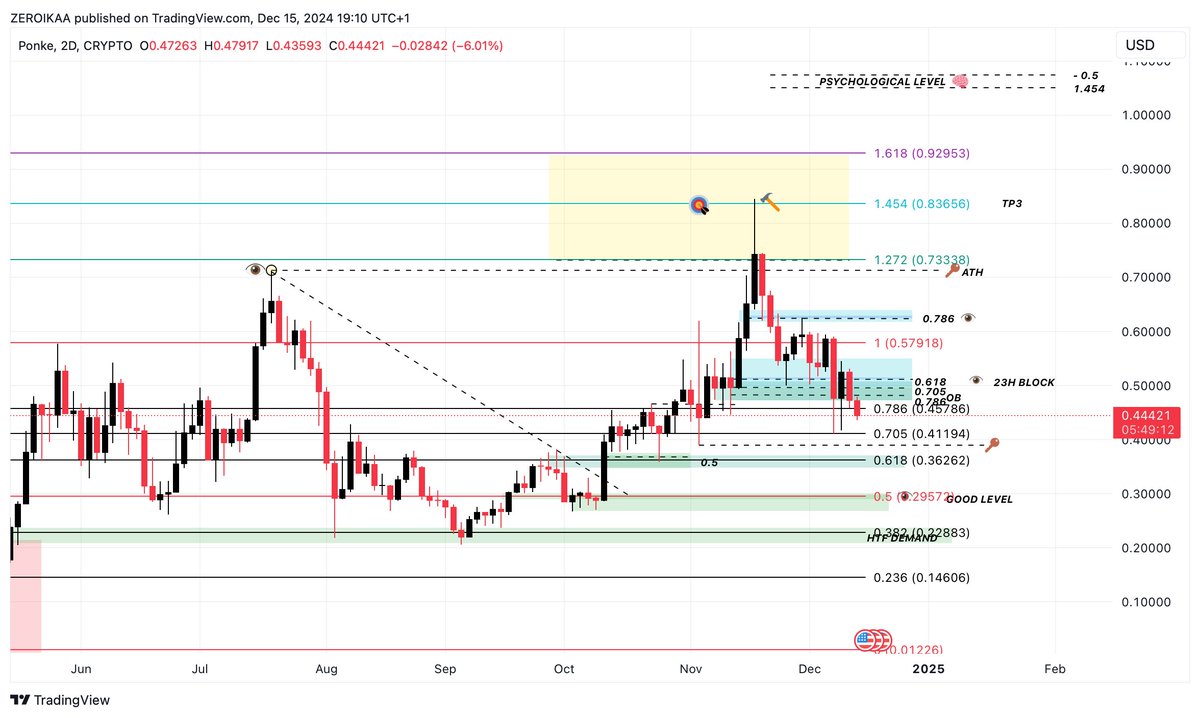
- Targets in an uptrend -
When the price goes into price discovery or when I have to calculate macro targets I utilize a blend of Fib levels that you probably already saw me sharing: 1.272 + 1.454 + 1.618.
This is a combination I studied during these years and that helped me a lot spotting local tops.
Here's an example where I used it for calculating the local top on PONKE in late November and where you can clearly see a powerful rejection and downtrend from that area:
This applies even for retracements in a downtrend and you'll notice over time and by implementing it how powerful this zone can be, especially if aligned with liquidity areas.
At the same time, by applying this method, you'll be able to see what most still don't understand: how much prices work on math and numbers as they're pushed by algorithms and not by fundamentals.
Wicks that extend toward accurate Fib numbers will truly open your eyes on this world.
To add more confluence, these settings match the negative Fibonacci sequence, therefore making it even more reliable.
The more confluences you add to the recipe, the more the dish will be tastier.
March List of the 13 Top Bullrun Signals (updated and documented):
- People are consistently adjusting their targets to increasingly higher levels.
A few months ago, 90/100K seemed outrageous, but now these are considered highly conservative targets due to the influx of institutional capital, Trump's strong pro-BTC stance, and his inauguration at the White House.
Targets like 200K+ are starting to appear more frequently on my X feed.
- Taking profits is not yet entirely frowned upon, but those who are trimming positions or adopting a more conservative approach feel hesitant because "there’s much, much more" left in the tank.
As a result, most prefer to keep their entire portfolio allocated.
- Yes, your hairdresser is already discussing which crypto to buy.
I personally already received multiple messages coming from external crypto people, aka retail asking me what to buy to multiply money in a short-time period because “Wow, Bitcoin is almost at 100K, amazing” and “Which will be the next Bitcoin?” 👁️
- Advertisements are becoming increasingly frequent: this week alone I’ve seen three on public TV, mostly promoting platforms but not exclusively.
National news programs are talking about Bitcoin’s “incredible rise” and how it has shows no signs of slowing down.
Whether it’s print news, television or online outlets, Bitcoin is a hot topic especially following Trump’s presidential victory and his apparent “inclination” toward crypto.
- Although we haven’t yet reached the level of public interviews aimed at large-scale promotion of Bitcoin, figures like Michael Saylor, Max Kaiser and Anthony Pompliano are becoming more “vocal” 🗣️🔊 on social media.
They’re constantly updating BTC’s price highlighting its intrinsic value, which they argue aligns perfectly with the U.S. debt problem and should therefore be adopted as global reserve to “save us”.
- Few people are actually considering the potential downside and are instead focused solely on the upside. As mentioned earlier, Bitcoin is nearing $100K, and institutional capital is driving it "to the moon," along with ETFs.
People are more afraid of being left out than of facing potential losses, and many are increasing their exposure in anticipation of a massive boom in the sector.
- Users are increasing significantly on cryptocurrency exchange platforms, and Coinbase is currently the second most downloaded finance app in the United States. It is climbing the ranks and has entered the top 70 most downloaded apps globally on the App Store.
- Crypto YouTube videos are increasing in views, nowhere near 2021 levels but the spike is notable, fast approaching March highs. (source @benjamincowen )
- Celebrities didn't start to advertise or promote crypto projects yet, but more and more "influential people" are talking publicly about this space like, for example, Andrew Tate that often write his posts alluding to this space
- Memecoins volumes are out of the roof but quite differently from the last bullrun where they marked the absolute top since this cycle there's a whole narrative behind them.
However, the volumes around dogs, cats and other animals are definitely 🚀
- Money giveaways didn't start yet, people are not gifting uncle's sam paper randomly
- During the past 90 days, Google Trends show a huge increase in researches for "Bitcoin" worldwide,
- "Portfolio screenshotting" ain't yet an Olympic sport but if we scroll through Instagram and other social media we can see some kids starting to flex their SOL wallets full of memecoins and double-digit gains
Conclusion:
Retails are definitely here and we're fast approaching euphoric stages.
Maybe Christmas dinner will be the perfect moment to discuss about their amazing investments to their families. 🎄🎅🎅🎅
70/100? 👁️
Altcoin season nadejdzie szybciej niż myślisz 🔜
Wieloryby już przygotowywują środki, aby wypompować kolejne 100x na low-capach 💯
Na szczęście można sprawdzić PRZED największą pompą co kupują używając kilku prostych narzędzi
Poradnik w komentarzach 🧵⬇️