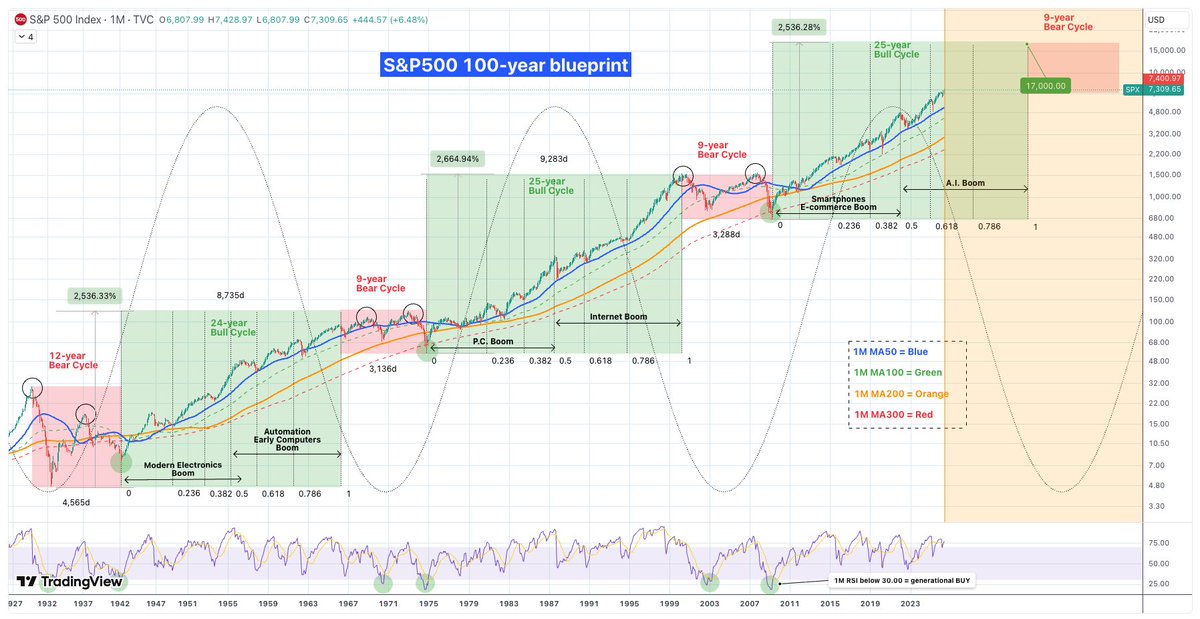
Der 100-Jahre-Plan für den Aktienmarkt
Wenn du dir die letzten 100 Jahre anschaust, siehst du ein klares Muster: Der Markt wiederholt immer wieder die gleichen Zyklen. Seit der Großen Depression 1930 gab es drei große Abwärtsphasen und drei Aufwärtsphasen .
Wir stecken gerade mitten im dritten großen Bullenmarkt.
Die schlechten Zeiten (Bärenmärkte)
Diese Phasen dauerten meistens etwa 9 Jahre (die Weltwirtschaftskrise von 1930 war mit 12 Jahren eine Ausnahme). Ein typisches Zeichen war, dass der Markt zweimal oben und zweimal unten „anklopfte“, bevor es wieder aufwärts ging. Oft krachte der Kurs bis zu einer bestimmten langfristigen Linie (dem 300er-Schnitt im Monatschart) und startete von dort aus neu durch.
Die guten Zeiten (Bullenmärkte)
Die ersten beiden großen Aufwärtsphasen dauerten jeweils 24 und 25 Jahre. Das Spannende: Sobald der Markt einmal Fahrt aufgenommen hatte, fiel er fast nie unter eine bestimmte grüne Linie (den 100er-Schnitt). Die blaue Linie (50er-Schnitt) war dabei immer die beste Chance, um günstig nachzukaufen, wenn es mal zwischendurch ruckelte.
Warum steigt der Markt so extrem?
Hinter jedem Bullenmarkt steckt eine neue Technologie:
Früher waren es industrielle Durchbrüche.
Dann kam der Internet-Boom.
Heute erleben wir den E-Commerce- und Social-Media-Boom.
Klar, irgendwann platzen diese Blasen immer, weil die Leute übertreiben. Aber die Technik bleibt! Das Internet ist nicht verschwunden, nur weil die Kurse im Jahr 2000 abgestürzt sind – es wurde zum Fundament für alles, was wir heute nutzen.
Der KI-Boom
Wir sind jetzt im zweiten Teil des aktuellen Aufschwungs, und der wird von der Künstlichen Intelligenz getrieben. Wahrscheinlich wird diese Blase um das Jahr 2034 platzen. Das wird wehtun, aber danach wird KI das feste Rückgrat unserer gesamten Wirtschaft sein.
Im Grunde sind die letzten 100 Jahre eine Kette von Erfindungen, die die Kurse immer höher treiben. Die Abstürze zwischendurch sind nur dazu da, die heiße Luft rauszulassen und Platz für neues Geld und die nächste Technologie zu machen.
Was bedeutet das für dich heute?
Wenn dieser Zyklus so läuft wie die letzten beiden, könnte der S&P 500 bis auf 17.000 Punkte steigen.
Es wird zwischendurch immer wieder Korrekturen geben. Der Zoll-Crash Anfang 2025 war so ein Moment, hat aber die wichtige blaue Linie nicht ganz berührt.
Schau auf den RSI-Anzeiger. Wenn der unter 30 fällt, ist das eine Chance des Jahrzehnts. Das ist in 100 Jahren erst sechsmal passiert – und jedes Mal war es der perfekte Zeitpunkt zum Kaufen.
Liken, Folgen, Speichern, Kommentieren, Teilen.
Danke für den Support 🫶😊🫶
Best was working with such a great team of AI hardware & software engineers! It was more fun than going to parties on Saturdays by far.
Least awesome was that we had to make several design concessions to move fast, but were able to finish tapeout 45 days ahead of schedule.
AI6 with LPDDR6 memory addresses those design concessions and has many new great ideas. It will deliver a true doubling of performance over AI5 in the same half reticle size using the Samsung 2nm fab in Texas. AI6.5 will further improve performance using TSMC 2nm in Arizona.
Note, both chips have ~half of the TRIP AI computation accelerators dedicated to SRAM, so effective memory bandwidth is an order of magnitude greater than DRAM bandwidth for any calculations in SRAM cache.
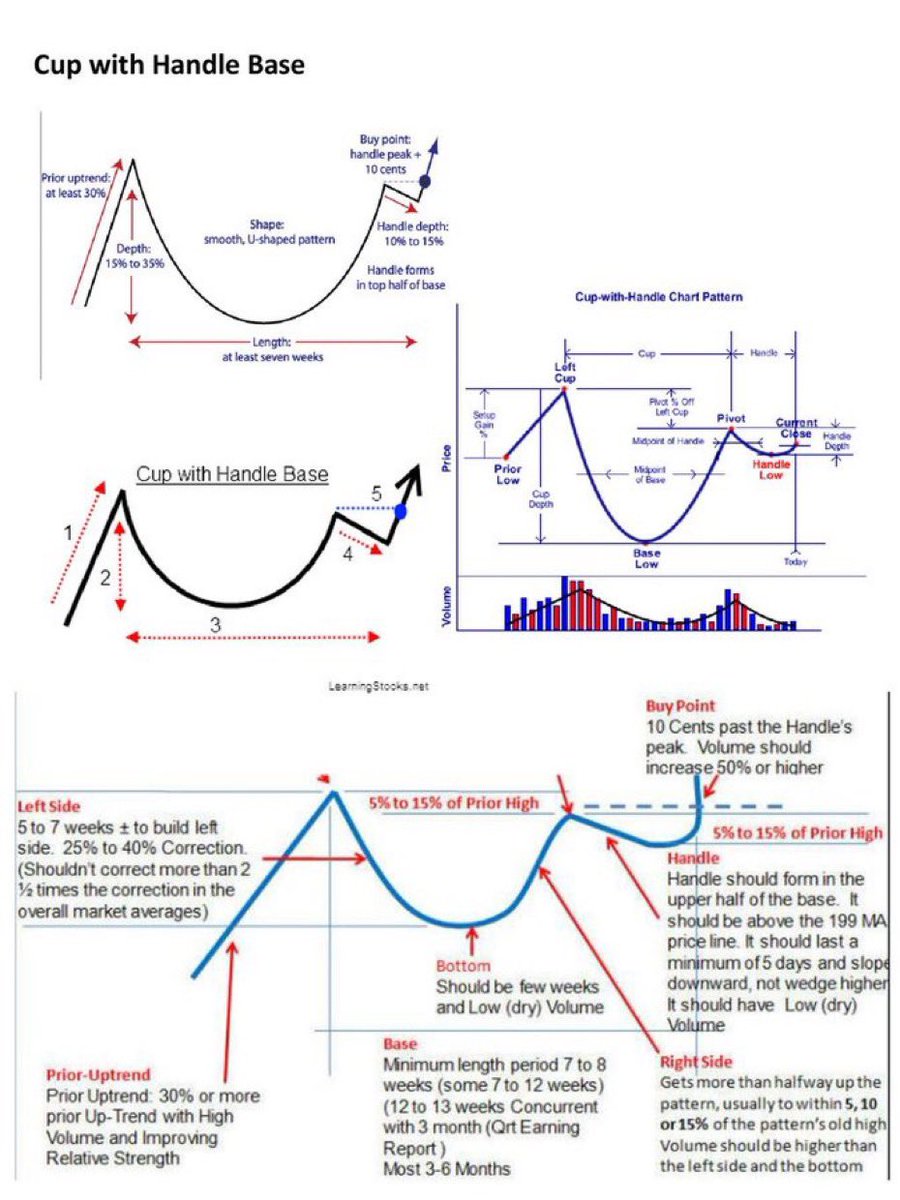
The cup ☕️ with handle base. One of the most important bases to study & identify 📖🧐.
Remember the depth of base should be 12-35% however it can be DEEPER in a bear market. Many leaders emerge from these patterns coming out of a bear market.
10. Focus List (Part 4)
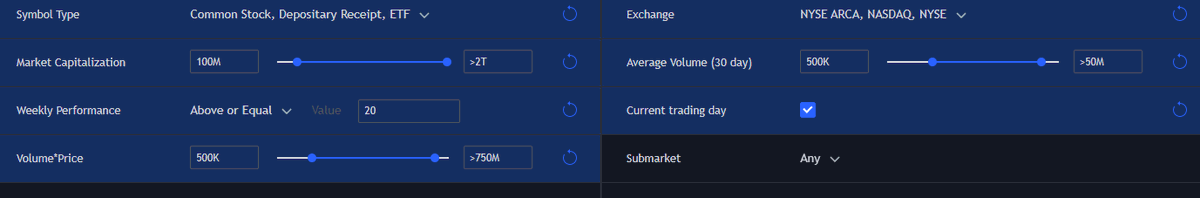
iv) Scans - @tradingview Free Version
Below is a Screenshot for parameters of Scan for '1-Week Mover Exceeding 20%' on @tradingview
You can do the same adjustment based on the filters from Finviz for each scans on @tradingview
Although the parameters for the five scans in Finviz are largely the same, it is interesting to note that some names may not appear on both platforms. If you are proactive, I highly recommend conducting the scans in both platforms.
10. Focus List (Part 3)
iii) Scans - Finviz Free Version
I strongly advocate for utilizing the free tools available on the internet for those who are still striving to become proficient in trading. Trading itself carries significant costs and unforeseen events that can disrupt your equity curve, some of which you may not even be aware of. These include factors such as wide spreads, execution slippages, and locate fees, among others. By leveraging the free tools provided online, you can mitigate some of these costs and gain a deeper understanding of the trading landscape.
In my opinion, a good precise strong mover scan should yield less than 60 results. You want the top quality movers. Below is the direct link to the Finviz version of my scans. You can make amendment to include any of your preferred criteria to only streamline the scan, not expand it.
1. 1-Week Mover Exceeding 20% - https://t.co/y8KjTSgxyL
2. 1-Month Mover Exceeding 30% - https://t.co/Imaw7QjaNK
3. 1-Month Mover Exceeding 50% (I would toggle to this scan instead if there are too many results appearing in '1-Month Mover Exceeding 30%' due to strong market. The whole idea is to look for the strongest mover of each time period - https://t.co/GbvqJsUPqO
4. 3-Month Mover Exceeding 50% -https://t.co/RH84AxUli5
5. 6-Month Mover Exceeding 100% - https://t.co/mM8sdEBjKs
#API3 compared to early $LINK Chart
Both breakout from triangle
$LINK was under ATH for 500 days before exploding
Both ride .236 FR before B/O
$LINK reaches full 34 extension like $QNT
I believe #API3 can also reach XX & XXX Digits in the coming years. Only 1 year old.
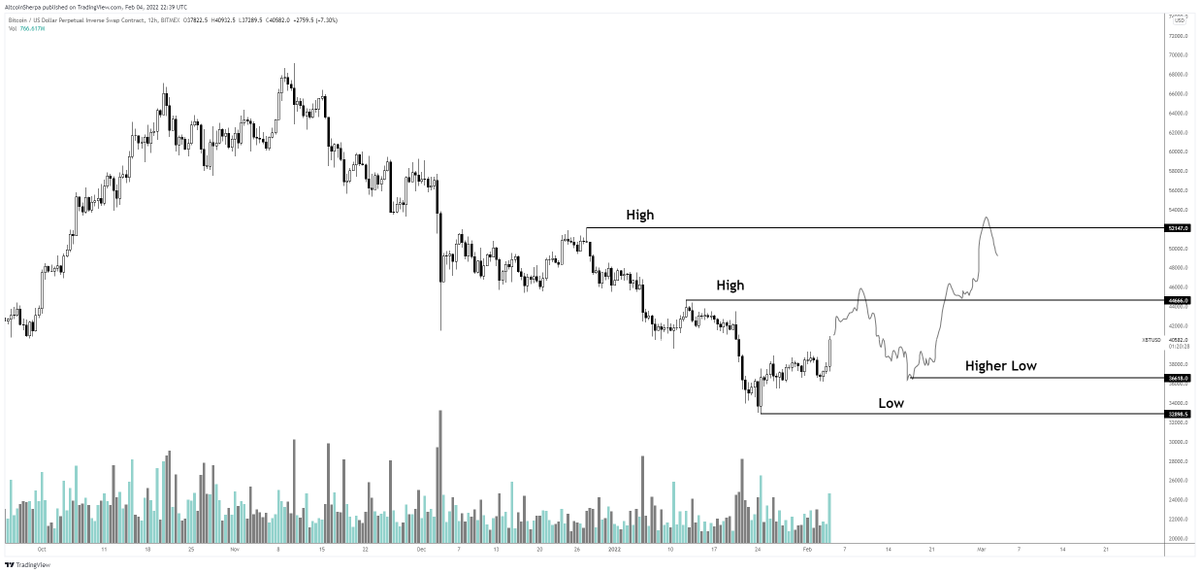
$BTC: There's a long way to go until there's a true break in market structure IMO. For this we need to get to some higher highs and higher lows. For me, I'm really looking to see where the lows are set at. This chart is an example of how we might be able to break MS. #Bitcoin
DEX Naming Rules (Cont.):
2. Vote for your favorite names by liking & retweeting them
3. The DEX team will make the final decision, but the top names have the best chance! Get voting ✍️
You have 24 hours to submit your name ideas via Quote Tweet (until Tuesday, 10/12 4PM UTC) 💡
DEX Naming Rules (Cont.):
2. Vote for your favorite names by liking & retweeting them
3. The DEX team will make the final decision, but the top names have the best chance! Get voting ✍️
You have 24 hours to submit your name ideas via Quote Tweet (until Tuesday, 10/12 4PM UTC) 💡
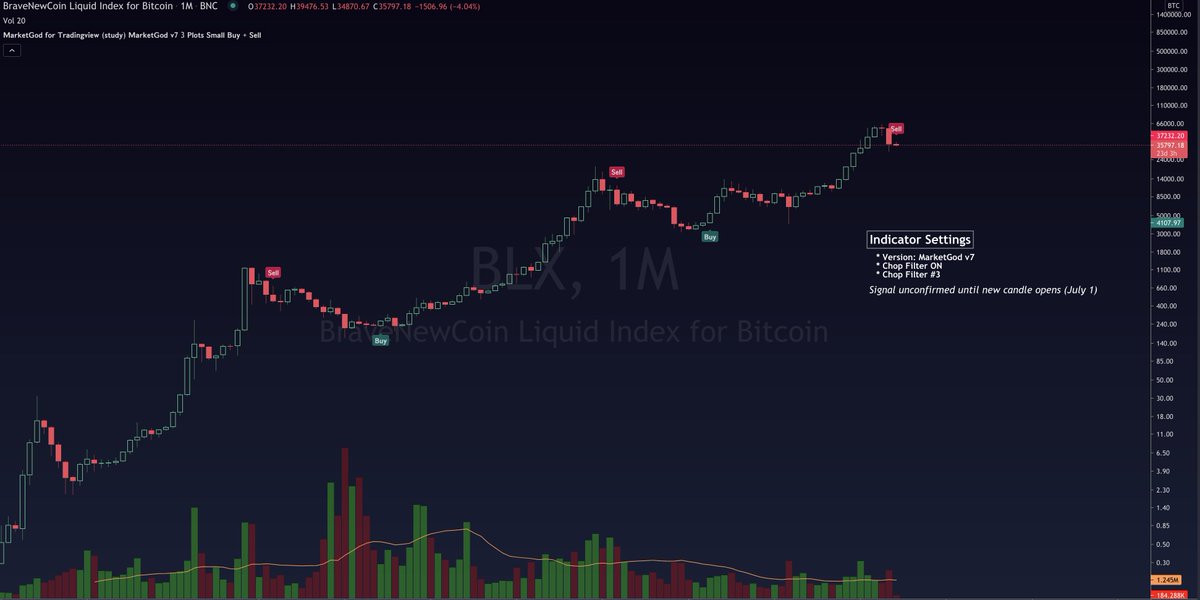
#Bitcoin 1M Chart vs @marketgodx:
#BTC now flashing a 'Sell' signal as of 6/7 with MG v7 (filter @ 3). Price at approx $35k, -$2k from it's 1M open on 6/1 around $37k.
Previous Sell Alerts came at $11k in 3/2018, $600 in 3/2014.
This is not confirmed until 1M closes 7/1/21.