In China, it could reach 35,000 yuan. Michael Howell also predicts the dollar will climb to about $15,000. He advises against buying Bitcoin, gold, or other commodities for now, recommending you wait for a correction instead of chasing FOMO, given looming monetary inflation.
https://t.co/K0ZvNCyYqH
This one’s for the $BTC maxis.
Bitcoin has been tracking something called the BUZZ/SPX ratio.
The BUZZ ETF represents highly speculative and volatile stocks. The white line shows its performance relative to the S&P 500.
When this ratio rises, it signals higher risk appetite in the economy.
Historically, that’s when $BTC performs well too because Bitcoin often trades like a proxy for speculative and high-volatility assets.
Here’s the key takeaway:
Bitcoin (orange) is currently lagging the BUZZ/SPX ratio...
Which points to one thing:
When risk appetite returns, Bitcoin could see a strong catch-up move in 2026.
How to read OrderFlow? 🤔
Here comes another quick guide on how to read OrderFlow like a pro and how you can profit from market-generated information. 👇
/Introduction:
OrderFlow is not another indicator or strategy. It’s simply a visualization of how the market actually works. Instead of only seeing open, high, low, and close on a standard candlestick chart, OrderFlow lets you see the real-time interaction between buyers and sellers, including the volume traded at each price level.
/How the market works:
If you trade the market, you need to understand how it works first! Markets operate as a two-way auction.
On one side, market buyers transact with limit sellers.
On the other, market sellers transact with limit buyers.
Market orders never trade with other market orders, and limit orders never trade with other limit orders!
Limit orders sit in the OrderBook and provide liquidity.
Market orders execute immediately by consuming that liquidity.
From here on, we’ll refer to traders who execute at market as "aggressive traders", and traders who place limit orders and wait for execution as "passive traders".
So when and why does price move?
Let's say a large aggressive sell order hits the market; for example, a 5M contract market sell. To execute the order we need a 5M limit buy order on the other side.
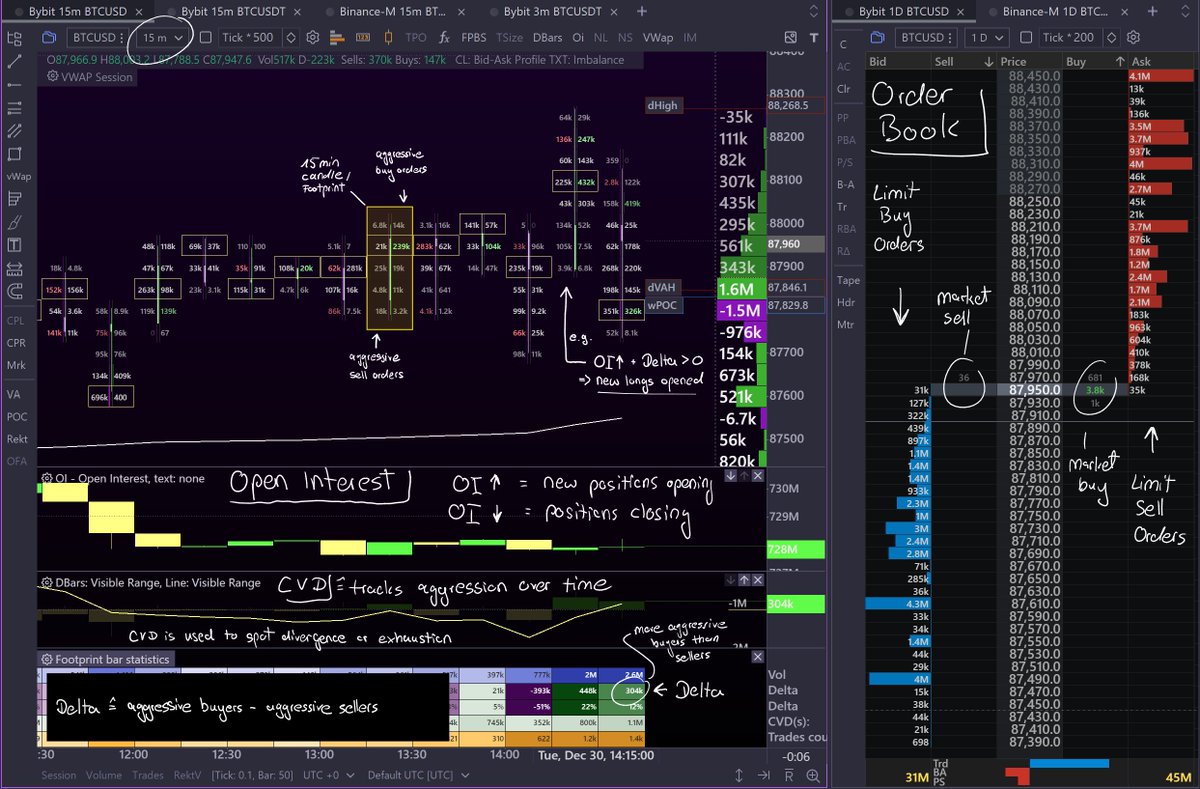
If we look at the current OrderBook (see picture, right side, in blue = limit buys), we can see that at the current price (87,950) there aren’t enough contracts resting on the bid. The order can’t be fully filled there, so price has to move lower to find more passive buyers and enough liquidity to complete the execution.
Price does not move lower because there are more buyers than sellers. Price moves because one side is more aggressive, starts crossing the spread and there isn’t enough liquidity at the current price!
/OrderFlow:
If you understand how the two-way auction works, you can watch it play out in real time using OrderFlow and so-called footprint charts (provided, for example, by @ExochartsC).
On the left side of the picture you see a footprint candle chart, showing aggressive sell orders on the left side of each candle and aggressive buy orders on the right.
Those are actually executed orders: market orders that got matched with limit orders.
You could also say that the left side of each candle shows limit buy orders executed by market sell orders. But for OrderFlow analysis, we focus on the aggressive side of the market, the market orders, because only aggression consumes liquidity and drives price discovery. So It shows intent, because aggressive orders reveal who is actively forcing price to move.
Thus we say we got market sells on the left and market buys on the right.
Now it gets really interesting when price does not follow the aggression.
For example, you see a lot of aggressive market buying (large numbers on the right side of the candle), but price doesn’t move higher. That tells you passive limit sellers are providing liquidity and absorbing the aggressive buyers. The buyers are essentially "hitting a wall".
That’s extremely valuable information you can use in your trading.
/How to trade with OrderFlow (OI, CVD, ...)
(next post coming soon...)
(Chart is showing ByBit's BTCUSD.p, 15min rotation, by @ExochartsC) #Bitcoin $BTC
Astrophysicist: Bitcoin's Real Top IS NOT IN (Math Proves It) https://t.co/2WvAjGGv3i via @YouTube
My newly released interview with Bram Kanstein on his Bitcoin for Millennials.
Bram is a master of editing and highlighting and helping to clarify principal ideas for his audience.
Three main takeaways:
1. Financial assets very much tend toward exponential (compound growth) behavior, gold also. Bitcoin is quite different, behaving as a power law of age since it is a communications network. Metcalfe’s law applies.
2. Bitcoin over its 17-year history has risen very steeply against gold, as the 5th power of age.
3. The bubbles have not been on a four-year cycle. A log periodic cycle is a better explanation and consistent with and expected due to its power law nature.
@Giovann35084111@orionx
The Physics of Price: Rigorous Mathematical Proof of a $600k Bitcoin Super-Cycle
The decade-long Bitcoin narrative of a rigid “4-year halving cycle” is mathematically dead.
Markets assumed price peaks arrived like clockwork every four years. That belief is now the main source of inefficiency.
LPPL analysis shows Bitcoin no longer follows simple time-based cycles. The structure has evolved.
The data is clear: this is not a cycle top. It is early-stage accumulation ahead of a much longer and more violent expansion.
1. The statistical kill shot: AIC scores
In quantitative modeling, the Akaike Information Criterion (AIC) is the final arbiter. It measures fit while penalizing complexity. Lower is better.
Fixed 4-Year Cycle AIC: −6,384.4
LPPL (dynamic) model AIC: −7,508.6
Verdict: LPPL outperforms the 4-year cycle by 1,124 AIC points. That is a statistical landslide.
Conclusion: forcing Bitcoin into a rigid 3.6–4-year box is wrong. The cycles are not fixed. They are expanding.
2. Age-doubling physics
The LPPL model solves for “omega,” the frequency of market oscillations.
In physics, age-doubling (logarithmic time dilation) is a universal pattern seen in earthquakes, material failure, and complex systems. It implies cycles lengthen as systems mature.
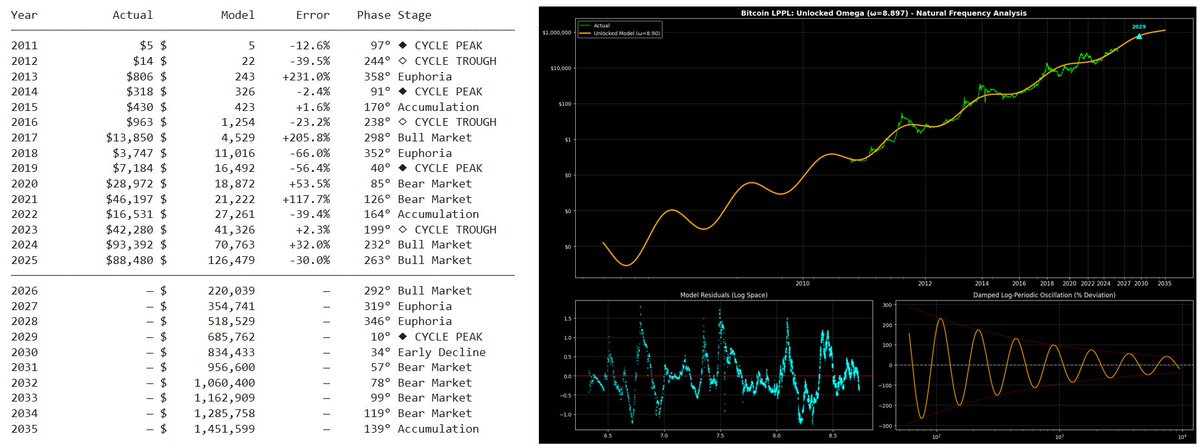
Bitcoin’s measured omega: 8.897.
This is the smoking gun. Bitcoin’s market rhythm is slowing exactly as age-doubling predicts. Each cycle takes longer than the last. Cycles are expanding, not repeating on a fixed schedule.
Why this is bullish: the market expects a late-2025 peak because of the 4-year myth. When that peak and crash fail to appear, cycle-based fear collapses. That vacuum supports a multi-year advance, not a short blow-off.
The coiled spring: current mispricing
As of December 21, 2025, risk is severely mispriced.
Actual price: $88,480
Model trend value: $124,492
Deviation: −29%
This is not euphoria. It is disbelief. Price is 29% below the long-term logarithmic trend while sentiment is focused on a nonexistent top. This is a classic coil: neutral pinning with asymmetric upside.
The roadmap to ~$600k (2026–2029)
With age-doubling in effect, the cycle does not peak in 2025. The LPPL projects a much longer expansion.
Forecast:
2026: The market accepts that the “crash” isn’t coming. Price gravitates toward the mean (~$220k).
2027–2028: Euphoria emerges as the extended-cycle thesis becomes consensus.
July 2029: True cycle peak.
Price targets:
Year-end 2026: ~$220,000
Year-end 2027: ~$355,000
Cycle peak (July 2029): ~$616,000
Summary
The 4-year cycle worked in Bitcoin’s infancy. It is now statistically disproven. The market is pricing a premature top, creating a 29% discount to fair value.
Smart money isn’t trading the halving. It’s trading the updated and more robust power law.
The math points to a slow, relentless climb toward ~$600k that exhausts short-term traders long before it ends.
Buy and Hold the asset.
13/13 Same plot BTC/Gold residuals, but in transformed space (linear fit function).
The pre-halving peak (cross) does not align with the dynamics captured by the fit model; appears to be outside the mechanism!
Feedback and comments on potential misinterpretations are welcome.
There is a fundamental problem with ascribing Bitcoin’s bubble behavior primarily to liquidity and it is this. Yes, one can fit approximately on a log-log chart; below is Michael Howell’s regression with his own proprietary liquidity measure, and the correlation of y = 9.72 x - intercept is high at R^2 = 0.90.
I have found similar correlation, even steeper, with global M3.
But correlation is not causation. Look at the axes, which in this case are in ln (natural log) terms. While the liquidity measure went up about 0.55 in the ln, a factor of 1.73, Bitcoin’s price went up by very nearly 6 in the ln, a factor of 403.
Of course, it went up by close to 10 x faster, because the coefficient for the slope is 9.72.
But what is the underlying mechanism that would provide a 10 x multiplier from liquidity, 10 x leverage? We know what the capital flows need to be because they are the first derivative of price on average.
The price goes as T^5.7, and the annual price and market cap growth goes as [(T+1)/T]^5.7 or about 40%. There is some multiple of new capital for market cap increase, that is measured to be around 2.5, but it falls out for the growth. In other words the capital influx has to grow at 40% now and at much higher rate in the past.
What is it about increasing liquidity by a factor of 1.7 over say a decade that would cause price to grow from $250 to $100,000 approx.? No one has provided an explanation, the increase in global liquidity of 70% would not a priori drive such a huge expansion.
My own work suggests Granger causality for initiating a bubble if liquidity grows > 7%, but there is not enough liquidity growth to sustain a rise in price by factors of 3 to 10 times in a bubble. That requires trader, investor, saver decisions to allocate more capital to Bitcoin.
Also, the slope of the liquidity regression has not changed much but the bubble energies are clearly falling as the reciprocal of Bitcoin age. Why, because the capital pool is much deeper and it becomes harder to impact price but more importantly, from the power law, because the time required to double price is stretched out as time goes on with a power law.
So what does drive dramatic price increases? Higher and higher tiers, new tiers, of capital entering BItcoin, this is not just increases in tens of percent, it is increases by an order of magnitude and then another order of magnitude and then another order of magnitude.
These are entirely new channels opening up. The fiat liquidity is bottled up behind the dam and as you open new sluices the actual inflow of available liquidity into Bitcoin increases dramatically as a result. https://t.co/Gpzfti4Tiu
Liquidity matters and we look forward to more in 2026. But higher prices and market cap are much bigger drivers since they attract higher and much larger capital tiers.
The power law has embedded within it the ability over time to reach higher prices / market cap and thus attract those higher tiers once it (a) proves itself to them at the higher level that (b) it would actually make some significant difference to their balance sheets.
This also explains why we had no Bubble in 2025, because we didn’t get to a high enough price to pull in the next higher tier.
For 2026-2028 the next major capital tier could be regulated banking system balance sheets and the ability to recognize Bitcoin as high-quality collateral for their lending activities. Such as trade finance with cross-border settlement.
New capital tiers is the primary driver, those happen as price rises, liquidity is a secondary driver that can help accelerate.
Commercial banking allocations would dwarf ETF flows and lock Bitcoin into the plumbing of the international monetary system. Systemically important commercial banks are at the scale of $100 billion to $6 trillion in assets. Trade finance is around $10 to $12 trillion.
1% of global bank assets is about $2 trillion, with a 2.5 multiple that level of allocation would mean a triple in price
It is simply not on the same level as Claude, GPT, and Gemini... so why charge the highest price? I am paying the most for this AI, yet often it gives no answer at all... it seems like it gets confused with itself.#Grok#GrokAI@elonmusk


![moneyordebt's tweet photo. There is a fundamental problem with ascribing Bitcoin’s bubble behavior primarily to liquidity and it is this. Yes, one can fit approximately on a log-log chart; below is Michael Howell’s regression with his own proprietary liquidity measure, and the correlation of y = 9.72 x - intercept is high at R^2 = 0.90.
I have found similar correlation, even steeper, with global M3.
But correlation is not causation. Look at the axes, which in this case are in ln (natural log) terms. While the liquidity measure went up about 0.55 in the ln, a factor of 1.73, Bitcoin’s price went up by very nearly 6 in the ln, a factor of 403.
Of course, it went up by close to 10 x faster, because the coefficient for the slope is 9.72.
But what is the underlying mechanism that would provide a 10 x multiplier from liquidity, 10 x leverage? We know what the capital flows need to be because they are the first derivative of price on average.
The price goes as T^5.7, and the annual price and market cap growth goes as [(T+1)/T]^5.7 or about 40%. There is some multiple of new capital for market cap increase, that is measured to be around 2.5, but it falls out for the growth. In other words the capital influx has to grow at 40% now and at much higher rate in the past.
What is it about increasing liquidity by a factor of 1.7 over say a decade that would cause price to grow from $250 to $100,000 approx.? No one has provided an explanation, the increase in global liquidity of 70% would not a priori drive such a huge expansion.
My own work suggests Granger causality for initiating a bubble if liquidity grows > 7%, but there is not enough liquidity growth to sustain a rise in price by factors of 3 to 10 times in a bubble. That requires trader, investor, saver decisions to allocate more capital to Bitcoin.
Also, the slope of the liquidity regression has not changed much but the bubble energies are clearly falling as the reciprocal of Bitcoin age. Why, because the capital pool is much deeper and it becomes harder to impact price but more importantly, from the power law, because the time required to double price is stretched out as time goes on with a power law.
So what does drive dramatic price increases? Higher and higher tiers, new tiers, of capital entering BItcoin, this is not just increases in tens of percent, it is increases by an order of magnitude and then another order of magnitude and then another order of magnitude.
These are entirely new channels opening up. The fiat liquidity is bottled up behind the dam and as you open new sluices the actual inflow of available liquidity into Bitcoin increases dramatically as a result. https://t.co/Gpzfti4Tiu
Liquidity matters and we look forward to more in 2026. But higher prices and market cap are much bigger drivers since they attract higher and much larger capital tiers.
The power law has embedded within it the ability over time to reach higher prices / market cap and thus attract those higher tiers once it (a) proves itself to them at the higher level that (b) it would actually make some significant difference to their balance sheets.
This also explains why we had no Bubble in 2025, because we didn’t get to a high enough price to pull in the next higher tier.
For 2026-2028 the next major capital tier could be regulated banking system balance sheets and the ability to recognize Bitcoin as high-quality collateral for their lending activities. Such as trade finance with cross-border settlement.
New capital tiers is the primary driver, those happen as price rises, liquidity is a secondary driver that can help accelerate.
Commercial banking allocations would dwarf ETF flows and lock Bitcoin into the plumbing of the international monetary system. Systemically important commercial banks are at the scale of $100 billion to $6 trillion in assets. Trade finance is around $10 to $12 trillion.
1% of global bank assets is about $2 trillion, with a 2.5 multiple that level of allocation would mean a triple in price](https://pbs.twimg.com/media/G8lJyxJbYAAWTOo.jpg)









![moneyordebt's tweet photo. There is a fundamental problem with ascribing Bitcoin’s bubble behavior primarily to liquidity and it is this. Yes, one can fit approximately on a log-log chart; below is Michael Howell’s regression with his own proprietary liquidity measure, and the correlation of y = 9.72 x - intercept is high at R^2 = 0.90.
I have found similar correlation, even steeper, with global M3.
But correlation is not causation. Look at the axes, which in this case are in ln (natural log) terms. While the liquidity measure went up about 0.55 in the ln, a factor of 1.73, Bitcoin’s price went up by very nearly 6 in the ln, a factor of 403.
Of course, it went up by close to 10 x faster, because the coefficient for the slope is 9.72.
But what is the underlying mechanism that would provide a 10 x multiplier from liquidity, 10 x leverage? We know what the capital flows need to be because they are the first derivative of price on average.
The price goes as T^5.7, and the annual price and market cap growth goes as [(T+1)/T]^5.7 or about 40%. There is some multiple of new capital for market cap increase, that is measured to be around 2.5, but it falls out for the growth. In other words the capital influx has to grow at 40% now and at much higher rate in the past.
What is it about increasing liquidity by a factor of 1.7 over say a decade that would cause price to grow from $250 to $100,000 approx.? No one has provided an explanation, the increase in global liquidity of 70% would not a priori drive such a huge expansion.
My own work suggests Granger causality for initiating a bubble if liquidity grows > 7%, but there is not enough liquidity growth to sustain a rise in price by factors of 3 to 10 times in a bubble. That requires trader, investor, saver decisions to allocate more capital to Bitcoin.
Also, the slope of the liquidity regression has not changed much but the bubble energies are clearly falling as the reciprocal of Bitcoin age. Why, because the capital pool is much deeper and it becomes harder to impact price but more importantly, from the power law, because the time required to double price is stretched out as time goes on with a power law.
So what does drive dramatic price increases? Higher and higher tiers, new tiers, of capital entering BItcoin, this is not just increases in tens of percent, it is increases by an order of magnitude and then another order of magnitude and then another order of magnitude.
These are entirely new channels opening up. The fiat liquidity is bottled up behind the dam and as you open new sluices the actual inflow of available liquidity into Bitcoin increases dramatically as a result. https://t.co/Gpzfti4Tiu
Liquidity matters and we look forward to more in 2026. But higher prices and market cap are much bigger drivers since they attract higher and much larger capital tiers.
The power law has embedded within it the ability over time to reach higher prices / market cap and thus attract those higher tiers once it (a) proves itself to them at the higher level that (b) it would actually make some significant difference to their balance sheets.
This also explains why we had no Bubble in 2025, because we didn’t get to a high enough price to pull in the next higher tier.
For 2026-2028 the next major capital tier could be regulated banking system balance sheets and the ability to recognize Bitcoin as high-quality collateral for their lending activities. Such as trade finance with cross-border settlement.
New capital tiers is the primary driver, those happen as price rises, liquidity is a secondary driver that can help accelerate.
Commercial banking allocations would dwarf ETF flows and lock Bitcoin into the plumbing of the international monetary system. Systemically important commercial banks are at the scale of $100 billion to $6 trillion in assets. Trade finance is around $10 to $12 trillion.
1% of global bank assets is about $2 trillion, with a 2.5 multiple that level of allocation would mean a triple in price](https://pbs.twimg.com/media/G8lJyxaaQAAYazP.jpg)


