MIT JUST LEAKED THE EXACT DOCUMENT WALL STREET QUANT FIRMS USE TO HIRE PEOPLE.
It is called the MIT Quant Bible.
And it covers everything the $500,000 a year quants actually know that you do not.
Here is what is inside:
Probability fundamentals. Conditional probability, Bayes theorem, expected value, variance, joint distributions. The mathematical foundation every trading decision at Jane Street and Citadel is built on.
Stats fundamentals. The Law of Large Numbers. Central Limit Theorem. Confidence intervals. The tools quants use to know when a signal is real and when it is noise.
Quant research and data science. Least squares, regressions, dimensionality reduction. Real case studies from Two Sigma, QuantCo, and CitiBikes.
Quant trading and market making. What market making actually is and how the theory translates into real trading decisions.
And then the part that makes this document worth more than most finance degrees.
A question bank with real interview questions from Jane Street, Virtu Financial, Optiver, Akuna Capital, Citadel, Hudson River Trading, Two Sigma, Five Rings, and SIG.
Not prep questions.
The actual questions these firms ask.
With answers.
The firms charging $50,000 a year for access to this type of preparation are not going to be happy this exists.
Bookmark this before it disappears.
Follow
@cyrilXBT
for every elite resource that gives you access to what the top 1% actually know
एक छोटा सा उपाय पूजा के पहले अपने पूरे घर को ध्यान करें प्रवेश द्वार से अंत तक हर कक्ष हर स्थान और ये मंत्र ब��ले
ब्रह्मा मुरारिः त्रिपुरांतकारी भानुः शशी भूमिसुतो बुधश्च ।
गुरुश्च शुक्रः शनि राहु केतवः सर्वे ग्रहाः शान्ति करा भवन्तु ॥
नकारात्मक ऊर्जा हटेगी और शुभ फल मिलेंगे!
To find stocks with Elite Relative Strength (RS), you need a systematic scanning process. True market leaders show their strength by making new highs before the major indexes (like the S&P 500 or Nasdaq) or by holding firm when the broader market is correcting.
Here is a step-by-step blueprint to find high-RS stocks using standard scanning tools (like MarketSurge, TradingView, or StockCharts):
1. The Raw Relative Strength Scan (The Baseline)
If you are using a platform that calculates a proprietary RS Rating (like IBD/MarketSurge, which ranks stocks from 1 to 99 based on price performance over the last year), your starting point is simple:
Filter for RS Rating $\ge$ 90: This immediately eliminates 90% of the market, leaving you only with the top 10% of performance.
Filter for RS Rating $\ge$ 95: Use this during a market correction to find the absolute elite tier.
2. Visual RS Scans (The "Line in the Sand")
If you don't have access to 1-99 ratings, you can use the RS Line (which plots the stock's price divided by the S&P 500 index price). Look for these specific visual behaviors:
RS New High Before Price
This is one of the most powerful leading indicators in technical analysis.
The Setup: The stock price is still consolidating or pulling back below its recent peak, but the RS Line has already broken out to a clear new lifetime or 52-week high.
What it means: Institutional accumulation is silently aggressive. Big money is absorbing every share available while the general market is distracted.
Blue Dot Scans (MarketSurge / Custom Scripts)
A "Blue Dot" occurs when a stock's RS line hits a new 52-week high while the stock itself is still in a base or consolidation pattern.
If you use TradingView or ThinkOrSwim, you can search for community scripts called "RS Line New High Before Price" or "IBD RS Blue Dot" to plot this automatically on your charts.
3. Market Correction Scans (The "Resilience" Test)
The absolute best time to find true RS is when the market index ($SPY or $QQQ) is actively falling. When the tide goes out, you see who is swimming with a rocket booster.
Run a scan with these parameters during a market pullback:
Price: Stock is trading above its rising 8-week EMA (or 21-day EMA).
Index Comparison: The S&P 500 is trading below its 21-day or 50-day moving average.
Performance: Stock is within 10% of its 52-week highs, while the index is down 5% to 10%+ from its highs.
4. Combining RS with Volume Signatures
High RS on low volume can be a trap. To ensure the relative strength is backed by institutional footprint, layer your RS scans with volume filters:
RS > 90 + HV1 (Highest Volume in 1 Year) within the last 5-10 days.
RS > 90 + HVE (Highest Volume Ever) on a recent PEG (Power Earnings Gap).
A Quick Example Checklist:
If the market sells off 300 points, look for the stock that finishes the day positive or completely flat on above-average volume. Put that ticker at the top of your watchlist it is your primary candidate for an Inside Day contraction or an Under-Cut and Rally (U/C) setup the moment the market stabilizes.
market opens at 9:30am
his trade was already in at 4am
neural net trained on 11 years of tick data called that setup 5 hours before candle even formed
he's not smarter than the market. just built something that reads patterns human eyes can't process fast enough
4,200 data points per second, 847,000 labeled historical setups, running on a $40/mo server
surfaces 3-4 trades a day. he takes top 2
last 90 days: 71% win rate, 2.3 avg risk/reward
while retail traders watch news at open, this system already decided before sunrise
you're not losing because your analysis is wrong
you're losing because you're competing with something that doesn't sleep, panic or second-guess itself
most people think this requires a PhD and a $2M quant desk
he built his whole setup for under $500 using a free dataset and 3 weeks of evenings
Bookmark this setup
edge was never hidden behind a paywall or locked inside a fund
it was sitting in a format nobody bothered to train on
When I first started learning algo trading, it only took me about a week to realize that systematic trading was the real deal.
However, I decided that I would not make the same mistake I made when I began learning discretionary trading, which is: Learning from people with no track record. It cost me well over a year of mistakes back then.
So from early on, I made it my number 1 priority to ONLY learn from traders with a verified track record. That was my non-negotiable rule.
One of these verified traders I have been learning from is the number one trader on darwinex (SYO); 17 Million AUM, with a track record spanning from 2017.
He has blogs going all the way back to 2019 on trading ideas, advice and tips for systematic traders.
If you want to be the best, learn from the best. His blog page is packed with gems and it has saved me years of mistakes. Here you go: https://t.co/KslFyHJSBv
आपको कुछ जनरल ज्योतिषीय उपाय देता हूं ट्रेडिंग और शेयर मार्केट में लाभ हो उसके लिए
हालांकि आपको वास्तविक स्थाई लाभ तभी होगा जब अपने चार्ट्स और टेक्निकल पर भरोसा रखें
- एक ग्रीन डायल की , रोमन अंक वाली घडी पहने, हरी रुमाल पास में रखे
- गन्ने के रस और दही से शिवलिंग अभिषेक करें
- चांदी की 4 ठोस गोली या एक चौकोर टुकड़ा भी पर्स में रख सकते हैं।
- आपकी कुंडली के 8th भाव में जो भी राशि हो, उसके स्वामी की चीजों का दान करे
- चूंकि 8th हाउस मृत्यु का भी होता तो शमशान में उस चीज का दान करे, 12 राशि में 4 गुण होते अग्नि वायु पृथ्वी और जल, तो आपके 8 भाव में मान लीजिए मेष सिंह या धनु राशि है तो ये अग्नि त��्व राशि हुई तो ऐसे में शमशान में लकड़ी, कोई पंखा आदि बिजली उपकरण का दान आपको नुकसान से भी बचाएगा और जीवन में लंबे वक्त से चल रही परेशानी भी खत्म करेगा
- अगर ट्रेडिंग से कर्ज हुआ हो तो 5 मंगल��ार लगातार हनुमान जी को चौला चढ़ाए, कर्ज की वजह 90% मंगल से जुड़ी होती है तो चाहे कही भी हो कुंडली में हमेशा लाभ देगा
- जिनको व्यापार ट्रेडिंग या इन्वेस्टमेंट में अक्सर हानि होती हो, या कोई शेयर बढ़िया कर रहा पर जैसे ही आप खरीदे बैंड बज जाती हो तो किन्नर को कुछ रुपए दें और उससे 1 रुपया लेकर हरे कपड़े में लपेटकर पर्स में रखें।
#Nifty
#Giftnifty
#Dowjones
#IranWar
#Cruide
#TrumpPedófilo
#Rcbvsgt
I just followed one rule entry of @iManasArora, which helps me a lot, and my number of trades decreased.
I took entry when the stock opens strong and doesn’t go below the previous close and break PDH.
Try this one and will see that your equity curve is rising!
"केवली कुम्भक" विभिन्न प्राणायाम की शक्ति को अब कोई बताने वाला नहीं है! मैं पिताजी , गुरुजी द्वारा नवरात्रि में ललिता सहस्त्रनाम में सम्मिलित होते थे पूजन विधि के प्रारंभ में भूत शुद्धि करवाते थे मंत्रोच्चार के साथ पूरक कुंभक रेचक अद्भुत शांति और प्राण अपान को सम बना देता था और
There was a time when I was obsessed with learning Order Flow.
But back then, it wasn’t available for free anywhere.
Most brokers and even TradingView only had normal candlestick charts.
A few platforms were offering Footprint Charts, but at ₹7K–₹8K per month.
At that stage of my journey, I simply couldn’t afford it.
Today things have changed.
@DhanHQ has launched Order Flow & Footprint Charts for free on their DEXT T3 terminal.
And honestly, if someone wants to learn real technical analysis or improve directional trading, Footprint Charts are one of the best things to study.
Retail traders finally have access to tools that were once only available to professionals.
This free 58-page MIT paper will teach you more about how markets really break than a decade on a trading desk.
In 2007 it caught Goldman, Renaissance and nearly every quant fund losing a quarter of their money in three days.
Bookmark & read it before it happens again.
a russian mathematician solved trading in 1906
wall street found the paper 70 years later, built billion-dollar funds around it, never mentioned it to retail
andrei markov proved markets aren't random - they're state machines
trending, ranging, reversing - each state has a fixed historical probability of shifting to the next
build a transition matrix from real data:
trending -> stays trending: 68%
trending -> flips to range: 21%
trending -> reverses: 11%
now you're not predicting direction. you're entering on 68% historical completion
identify your state, size with kelly, take the trade when math says yes
that's the edge. the whole edge
renaissance has run this since 1988. 37 years of 66% annual returns
paper is free, data is free, implementation is 200 lines of python
Bookmark and use in your own strategy
they kept you staring at candles while they ran probability tables
My uncle told me to get a real job instead of "playing with crypto"
He's been at the same company for 14 years.
I didn't argue.
I showed him my screen without saying a word.
He read the numbers twice.
"That's fake"
30 days. $300 in. $24,200 out. 73% win rate.
He looked up.
"What is this"
https://t.co/Xih0tk6bxi
86 million on-chain trades. Every wallet that ever touched Polymarket. All public.
One Claude prompt. 14,000 wallets ranked by profit. 4 minutes. 47 targets returned.
Top 20 made more than the bottom 13,000 combined.
"That's a cheat code"
https://t.co/zm2ifgjABQ
73 terminal screens. Whale tracking. Insider detection. Cross-platform arb vs Kalshi. Wash trade detection. Never touches your keys.
https://t.co/DlTWAuJIiQ
ML catches fresh wallets entering low-liquidity markets before anything moves. January: flagged a wallet that turned $35K into $442K before the event resolved.
https://t.co/TY2P9bH4lO
Three agents. No shared memory. Two agree - full size. One alone - half. Disagree - no trade.
One rule. 40% fewer losing trades overnight.
"How much does all this cost"
$25 a month.
He's been at the same desk for 14 years. Same salary. Same commute. Same everything.
Didn't say anything for a while.
"I've been doing it wrong this whole time"
Maybe.
Everything is public. Everything is free.
The only thing that costs you is waiting.
An ex-Tudor quant PM just sat down for 76 minutes and explained what's happened to the industry over the last 15 years.
His main claim: there hasn't been a single new idea in trading in 15 years.
Every algorithm and strategy moving billions through Wall Street today is a repackaging of something that already existed in 2010.
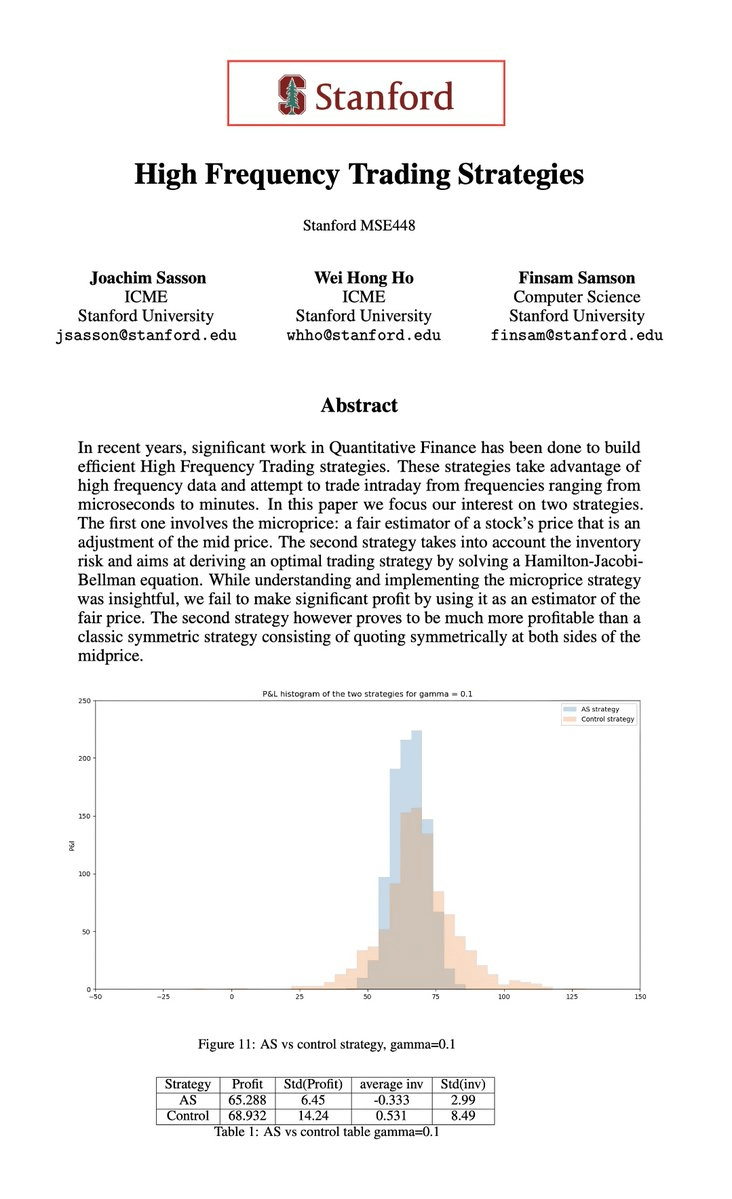
I build institutional-level quant systems for a living
This Stanford paper is the closest thing to an HFT desk I have ever seen published publicly
14 pages, top signal combination, statistical framework
The same framework I broke down in 11 steps in the article below - serial demeaning, cross-sectional normalization, residual weighting, empirical Kelly
Read it first
Then read the article
Most people are right about the market and still losing money because they never found these 14 pages